SlideShare una empresa de Scribd logo
1 de 17
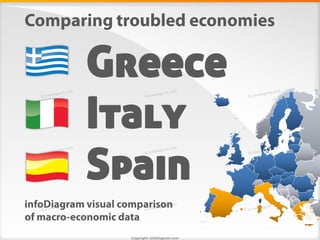
Greece
Italy
Spain
 Copyright: infoDiagram.com
Comparing EU
countries
Set of visualized data
• GDP per capita & GDP growth
• Government debt
• Unemployment rate
• Population


European Union


         Spain               Italy

                                                     Greece

                        Copyright: infoDiagram.com
0
                                                                                  100
                                                                                  200
                                                                                  250

                                                                                  150
                                                                                  300


                                                                                   50
                                                                                  44,0             Bulgaria
                                                                                  46,0             Romania
                                                                                  51,0             Latvia
                                                                                   57,0            Lithuania
                                                                                   63,0            Poland
                                                                                   64,0            Estonia
                                                                                   65,0            Hungary
                                                                                    74,0           Slovakia
                                                                                    80,0           Czech Republic
                                                                                    80,0           Portugal
                                                                                     83,0          Malta
                                                                                     85,0          Slovenia
                                                                                     90,0          Greece
                                                                                      99,0         Cyprus


Copyright: infoDiagram.com
                                                                                      100,0        EU 27
                                                                                      100,0        Spain
                                                                                      101,0        Italy
                                                                                       108,0       France
                                                                                       112,0       United Kingdom
                                                       GDP 2010 per capita, PPS

                                                                                       115,0       Finland
                                                                                        118,0      Germany
                                                                                        119,0      Belgium
                                                                                        123,0      Sweden
                                                                                                                    GDP 2010 per capita, PPS


                                                                                        126,0      Austria
                                                                                        127,0      Denmark
                                                                                         128,0     Ireland
                                                                                         133,0     Netherlands
                                                                                                 271,0
                                                                                                   Luxembourg
                       2012-04-12
                                    Source: Eurostat
GDP 2010 per capita, PPS


 EU 27
                    100
                                                           100
  Italy
                    101

 Spain
                    100
                                                                 101   90
Greece
               90                       100

          80   85   90    95   100 105
                                                                            Source: Eurostat
                                   Copyright: infoDiagram.com
                                                                                   2012-04-12
Facts & observations

               Greece has the highest 10 year note yield in the eurozone at 24%.
                Spain and Italy while not the highest yield in Europe are a proxy
                     for overall Eurozone risk due to the size and diversity
                                 of their respective economies.


The Troika (EU, ECB and IMF) overseeing Greece's bailout has mandated
    that Greece cut its debt to GDP ratio to 120.5% of GDP by 2020.


          On Aug 13, 2012 it was announced that Greece’s national output
    shrank in the 2nd quarter by 6.2 per cent on an annual basis. The contraction
        was a marginal improvement on a 6.5 per cent fall in the 1st quarter.
    The Athens think-tank IOBE predicted on July 2012, that output would shrink
                              by 6.9 per cent this year.


                                 Copyright: infoDiagram.com
0,0
                                                                           5,0


                                                                         -35,0
                                                                         -30,0
                                                                         -20,0
                                                                         -15,0
                                                                         -10,0
                                                                          -5,0


                                                                         -25,0
                                                                        -31,3                                                Ireland
                                                                                                    -10,6                    Greece
                                                                                                    -10,3                    United Kingdom
                                                                                                      -9,8                   Portugal
                                                                                                       -9,3                  Spain
                                                                                                        -8,3                 Latvia
                                                                                                         -7,8                Poland
                                                                                                         -7,7                Slovakia
                                                                                                          -7,1               France
                                                                                                          -7,0               Lithuania
                                                                                                          -6,9               Romania
                                                                                                          -6,6               EU 27
                                                                                                           -5,8              Slovenia
                                                                                                            -5,3             Cyprus


Copyright: infoDiagram.com
                                                                                                            -5,1             Netherlands
                                                                                                            -4,8             Czech Republic
                                                                                                             -4,6            Italy
                                                                                                             -4,4            Austria
                                                                            Government Debt, 2010

                                                                                                             -4,3            Germany
                                                                                                             -4,2            Hungary
                                                                                                              -4,1           Belgium
                                                                                                               -3,6          Malta
                                                                                                                -3,1         Bulgaria
                                                                                                                 -2,6        Denmark
                                                                                                                                              Government Debt 2010 (EU)


                                                                                                                 -2,5        Finland
                                                                                                                  -1,1       Luxembourg
                                                                                                                         0,2 Estonia
                                                                                                                         0,2 Sweden
       Government deficit/surplus, debt 2012-03-06
                                                     Source: Eurostat
Government Debt 2010 (EU)


 EU 27
                        -6,6
                                                         -6,6%
  Italy
                         -4,6

 Spain
                      -9,3
                                                                 -4,6%       -10,6%
Greece
                -10,6                  -9,3%

      -12,0    -7,0          -2,0   3,0
                                                                                          Source: Eurostat
                                    Copyright: infoDiagram.com      Government deficit/surplus, debt 2012-03-06
Facts & observations


      In February 2012 Greece executed the largest debt restructure
ever attempted in the Eurozone with private holders of Greek government
  bonds (banks, insurers and investment funds), "voluntarily" accepting
              a bond swap with a 53.5% nominal write-off.


              On March 9, 2012 the International Swaps and Derivatives Association
               ruled that the earlier debt restructuring constituted a "credit event"
               meaning a maximum of $3.16 billion of net outstanding Greek credit
           default swap contracts could be paid out and settled between counterparties.


                                Copyright: infoDiagram.com
Facts & observations

Spain's unemployment rate stood at 24.6% between April and June,
            up from 24.4% during the previous quarter.
      That's the highest level since 1976, soon after the death
 of the dictator Francisco Franco, and before the country returned
                            to democracy.


           Euro-zone unemployment currently stands at a fresh record high
               of 11.2%, while the unemployment rate in the Eurozone's
     largest economy of Germany rose for a fourth straight month to 6.8% in July.


                           Copyright: infoDiagram.com
0
                                                                                 5
                                                                                10
                                                                                15
                                                                                20
                                                                                25
                                                                                30
                                                                                4,2                Austria
                                                                                4,9                Netherlands
                                                                                5,1                Luxembourg
                                                                                 5,7               Germany
                                                                                  6,7              Czech Republic
                                                                                  6,8              Malta
                                                                                  7,1              Belgium
                                                                                  7,5              Finland
                                                                                  7,5              Romania
                                                                                  7,5              Sweden
                                                                                   7,8             Denmark
                                                                                   8,3             United Kingdom
                                                                                   8,7             Slovenia
                                                                                    8,9            Italy


Copyright: infoDiagram.com
                                                                                    9,4            Cyprus
                                                                                     9,9           France
                                                                                     10,0          EU 27
                                                                                     10,1          Poland
                                                                                      11,0         Hungary
                                                       Unemployment (2011.12)


                                                                                      11,7         Estonia
                                                                                      11,8         Bulgaria
                                                                                        14,1       Slovakia
                                                                                        14,3       Lithuania
                                                                                        14,6       Latvia
                                                                                        14,6       Portugal
                                                                                                                    Unemployment rate, Dec 2011


                                                                                        14,7       Ireland
                                                                                             21,0 Greece
                                                                                              23,0 Spain
                                    Source: Eurostat
                       2012-04-02
Unemployment rate, Dec 2011


 EU 27
              10
                                                       10
  Italy
              8,9

 Spain
                    23

                                                            8,9   21
Greece                              23
                    21

          0         10   20    30
                                                                       Source: Eurostat
                              Copyright: infoDiagram.com
                                                                              2012-04-02
20,0
                                                              40,0
                                                              60,0
                                                             100,0


                                                               0,0
                                                              80,0
                                                             0,4                Malta
                                                             0,5                Luxembourg
                                                             0,8                Cyprus
                                                             1,3                Estonia
                                                             2,1                Slovenia
                                                             2,2                Latvia
                                                             3,2                Lithuania
                                                              4,5               Ireland
                                                              5,4               Finland
                                                              5,4               Slovakia
                                                              5,6               Denmark
                                                              7,5               Bulgaria
                                                               8,4              Austria
                                                               9,4              Sweden


Copyright: infoDiagram.com
                                                Population
                                                               10,0             Hungary
                                                               10,5             Czech Republic
                                                               10,6             Portugal
                                                               11,0             Belgium
                                                                                                 Population 2011


                                                               11,3             Greece
                                                                16,7            Netherlands
                                                                 21,4           Romania
                                                                    38,2        Poland
                                                                     46,2       Spain
                                                                        60,6 Italy
                                                                        62,4 United Kingdom
                                                                         65,0 France
                                                                            81,8Germany
       2012-03-30
                             Source: Eurostat
Population 2011


  Italy
                     60,6


 Spain
                 46,2

                                                                60,6
Greece                                 46,2                            11,3
              11,3

          0      20     40    60    80
                                                                              Source: Eurostat
                                   Copyright: infoDiagram.com                        2012-03-30
-10
                                                                              -5
                                                                                   0
                                                                                         5
                                                                                              10
                                                                       -6,9                         Greece
                                                                              -1,6                  Portugal
                                                                                -0,2                Slovenia
                                                                                       0,4          Italy
                                                                                       0,5          Cyprus
                                                                                       0,7          Ireland
                                                                                       0,7          Spain
                                                                                       0,7          United Kingdom
                                                                                        1,0         Denmark
                                                                                        1,2         Netherlands
                                                                                        1,5         EU 27
                                                                                         1,6        Luxembourg
                                                                                         1,7        Bulgaria
                                                                                         1,7        Czech Republic


Copyright: infoDiagram.com
                                                                                         1,7        France
                                                                                         1,7        Hungary
                                                                                         1,9        Belgium
                                                                                         2,1        Malta
                                                GDP growth 2010-2011

                                                                                          2,5       Romania
                                                                                          2,9       Finland
                                                                                          3,0       Germany
                                                                                           3,1      Austria
                                                                                                                     GDP growth 2010-2011


                                                                                           3,3      Slovakia
                                                                                            3,9     Sweden
                                                                                            4,3     Poland
                                                                                              5,5 Latvia
                                                                                              5,9 Lithuania
                                                                                                7,6 Estonia
       2012-04-16
                             Source: Eurostat
GDP growth 2010-2011


 EU 27
                            1,5
                                                        1,5%
  Italy
                            0,4

 Spain
                            0,7
                                                               0,4%   -6,9%
Greece
                 -6,9                 0,7%

          -10   -5      0             5
                                                                              Source: Eurostat
                                  Copyright: infoDiagram.com                         2012-04-16
Contact us in case
of questions
or topic cooperation

www.infoDiagram.com


                       Copyright: infoDiagram.com
For more presentations,
hit FOLLOW on slideshare.net/infodiagram
      Follow


                  Copyright: infoDiagram.com

Más contenido relacionado

Más de Peter Zvirinsky

Create Happy Holidays card in 5 minutes using PowerPoint
Create Happy Holidays card in 5 minutes using PowerPointCreate Happy Holidays card in 5 minutes using PowerPoint
Create Happy Holidays card in 5 minutes using PowerPointPeter Zvirinsky
 
How to Create Diagrams instead of Text
How to Create Diagrams instead of TextHow to Create Diagrams instead of Text
How to Create Diagrams instead of TextPeter Zvirinsky
 
Illustrating Top-Management Concepts in Your Presentation
Illustrating Top-Management Concepts in Your PresentationIllustrating Top-Management Concepts in Your Presentation
Illustrating Top-Management Concepts in Your PresentationPeter Zvirinsky
 
Making attractive Big Data Diagrams
Making attractive Big Data DiagramsMaking attractive Big Data Diagrams
Making attractive Big Data DiagramsPeter Zvirinsky
 
Presentation Rooms - Training Toolbox, part 2
Presentation Rooms - Training Toolbox, part 2Presentation Rooms - Training Toolbox, part 2
Presentation Rooms - Training Toolbox, part 2Peter Zvirinsky
 
Sustainable Transport and Green Fuel Types
Sustainable Transport and Green Fuel TypesSustainable Transport and Green Fuel Types
Sustainable Transport and Green Fuel TypesPeter Zvirinsky
 
Waste Sources Treatment Ecology Presentation Visuals
Waste Sources Treatment Ecology Presentation VisualsWaste Sources Treatment Ecology Presentation Visuals
Waste Sources Treatment Ecology Presentation VisualsPeter Zvirinsky
 
Hand Drawn Pencil Symbols Banners Visuals ppt
Hand Drawn Pencil Symbols Banners Visuals pptHand Drawn Pencil Symbols Banners Visuals ppt
Hand Drawn Pencil Symbols Banners Visuals pptPeter Zvirinsky
 
Creative Presentation Slides Design Making
Creative Presentation Slides Design Making Creative Presentation Slides Design Making
Creative Presentation Slides Design Making Peter Zvirinsky
 
Infographics Key Data KPI presentation slides
Infographics Key Data KPI presentation slidesInfographics Key Data KPI presentation slides
Infographics Key Data KPI presentation slidesPeter Zvirinsky
 
BPO Transition Framework visuals toolbox PPT
BPO Transition Framework visuals toolbox PPTBPO Transition Framework visuals toolbox PPT
BPO Transition Framework visuals toolbox PPTPeter Zvirinsky
 
Infographics Shapes TimeLines PPT Flow Diagrams - infodiagram part2
Infographics Shapes TimeLines PPT Flow Diagrams - infodiagram part2Infographics Shapes TimeLines PPT Flow Diagrams - infodiagram part2
Infographics Shapes TimeLines PPT Flow Diagrams - infodiagram part2Peter Zvirinsky
 
Infographics Text Lists Powerpoint diagrams
Infographics Text Lists Powerpoint diagramsInfographics Text Lists Powerpoint diagrams
Infographics Text Lists Powerpoint diagramsPeter Zvirinsky
 
Fireworks Injuries Infographics
Fireworks Injuries InfographicsFireworks Injuries Infographics
Fireworks Injuries InfographicsPeter Zvirinsky
 
Uncertainty in IT project - SCRUM rules
Uncertainty in IT project - SCRUM rulesUncertainty in IT project - SCRUM rules
Uncertainty in IT project - SCRUM rulesPeter Zvirinsky
 
Healthcare medical & pharma visuals presentation toolbox
Healthcare medical & pharma visuals presentation toolboxHealthcare medical & pharma visuals presentation toolbox
Healthcare medical & pharma visuals presentation toolboxPeter Zvirinsky
 
Diagram Mistakes in Presentation Slide Design
Diagram Mistakes in Presentation Slide DesignDiagram Mistakes in Presentation Slide Design
Diagram Mistakes in Presentation Slide DesignPeter Zvirinsky
 
Feedback training visuals toolbox presentation
Feedback training visuals toolbox presentationFeedback training visuals toolbox presentation
Feedback training visuals toolbox presentationPeter Zvirinsky
 
Housing Logistics Visuals PPT InfoDiagram
Housing Logistics Visuals PPT InfoDiagramHousing Logistics Visuals PPT InfoDiagram
Housing Logistics Visuals PPT InfoDiagramPeter Zvirinsky
 
How to Illustrate Energy Resources Presentation
How to Illustrate Energy Resources PresentationHow to Illustrate Energy Resources Presentation
How to Illustrate Energy Resources PresentationPeter Zvirinsky
 

Más de Peter Zvirinsky (20)

Create Happy Holidays card in 5 minutes using PowerPoint
Create Happy Holidays card in 5 minutes using PowerPointCreate Happy Holidays card in 5 minutes using PowerPoint
Create Happy Holidays card in 5 minutes using PowerPoint
 
How to Create Diagrams instead of Text
How to Create Diagrams instead of TextHow to Create Diagrams instead of Text
How to Create Diagrams instead of Text
 
Illustrating Top-Management Concepts in Your Presentation
Illustrating Top-Management Concepts in Your PresentationIllustrating Top-Management Concepts in Your Presentation
Illustrating Top-Management Concepts in Your Presentation
 
Making attractive Big Data Diagrams
Making attractive Big Data DiagramsMaking attractive Big Data Diagrams
Making attractive Big Data Diagrams
 
Presentation Rooms - Training Toolbox, part 2
Presentation Rooms - Training Toolbox, part 2Presentation Rooms - Training Toolbox, part 2
Presentation Rooms - Training Toolbox, part 2
 
Sustainable Transport and Green Fuel Types
Sustainable Transport and Green Fuel TypesSustainable Transport and Green Fuel Types
Sustainable Transport and Green Fuel Types
 
Waste Sources Treatment Ecology Presentation Visuals
Waste Sources Treatment Ecology Presentation VisualsWaste Sources Treatment Ecology Presentation Visuals
Waste Sources Treatment Ecology Presentation Visuals
 
Hand Drawn Pencil Symbols Banners Visuals ppt
Hand Drawn Pencil Symbols Banners Visuals pptHand Drawn Pencil Symbols Banners Visuals ppt
Hand Drawn Pencil Symbols Banners Visuals ppt
 
Creative Presentation Slides Design Making
Creative Presentation Slides Design Making Creative Presentation Slides Design Making
Creative Presentation Slides Design Making
 
Infographics Key Data KPI presentation slides
Infographics Key Data KPI presentation slidesInfographics Key Data KPI presentation slides
Infographics Key Data KPI presentation slides
 
BPO Transition Framework visuals toolbox PPT
BPO Transition Framework visuals toolbox PPTBPO Transition Framework visuals toolbox PPT
BPO Transition Framework visuals toolbox PPT
 
Infographics Shapes TimeLines PPT Flow Diagrams - infodiagram part2
Infographics Shapes TimeLines PPT Flow Diagrams - infodiagram part2Infographics Shapes TimeLines PPT Flow Diagrams - infodiagram part2
Infographics Shapes TimeLines PPT Flow Diagrams - infodiagram part2
 
Infographics Text Lists Powerpoint diagrams
Infographics Text Lists Powerpoint diagramsInfographics Text Lists Powerpoint diagrams
Infographics Text Lists Powerpoint diagrams
 
Fireworks Injuries Infographics
Fireworks Injuries InfographicsFireworks Injuries Infographics
Fireworks Injuries Infographics
 
Uncertainty in IT project - SCRUM rules
Uncertainty in IT project - SCRUM rulesUncertainty in IT project - SCRUM rules
Uncertainty in IT project - SCRUM rules
 
Healthcare medical & pharma visuals presentation toolbox
Healthcare medical & pharma visuals presentation toolboxHealthcare medical & pharma visuals presentation toolbox
Healthcare medical & pharma visuals presentation toolbox
 
Diagram Mistakes in Presentation Slide Design
Diagram Mistakes in Presentation Slide DesignDiagram Mistakes in Presentation Slide Design
Diagram Mistakes in Presentation Slide Design
 
Feedback training visuals toolbox presentation
Feedback training visuals toolbox presentationFeedback training visuals toolbox presentation
Feedback training visuals toolbox presentation
 
Housing Logistics Visuals PPT InfoDiagram
Housing Logistics Visuals PPT InfoDiagramHousing Logistics Visuals PPT InfoDiagram
Housing Logistics Visuals PPT InfoDiagram
 
How to Illustrate Energy Resources Presentation
How to Illustrate Energy Resources PresentationHow to Illustrate Energy Resources Presentation
How to Illustrate Energy Resources Presentation
 

Último

Send Files | Sendbig.comSend Files | Sendbig.com
Send Files | Sendbig.comSend Files | Sendbig.comSend Files | Sendbig.comSend Files | Sendbig.com
Send Files | Sendbig.comSend Files | Sendbig.comSendBig4
 
The McKinsey 7S Framework: A Holistic Approach to Harmonizing All Parts of th...
The McKinsey 7S Framework: A Holistic Approach to Harmonizing All Parts of th...The McKinsey 7S Framework: A Holistic Approach to Harmonizing All Parts of th...
The McKinsey 7S Framework: A Holistic Approach to Harmonizing All Parts of th...Operational Excellence Consulting
 
Healthcare Feb. & Mar. Healthcare Newsletter
Healthcare Feb. & Mar. Healthcare NewsletterHealthcare Feb. & Mar. Healthcare Newsletter
Healthcare Feb. & Mar. Healthcare NewsletterJamesConcepcion7
 
WSMM Technology February.March Newsletter_vF.pdf
WSMM Technology February.March Newsletter_vF.pdfWSMM Technology February.March Newsletter_vF.pdf
WSMM Technology February.March Newsletter_vF.pdfJamesConcepcion7
 
WSMM Media and Entertainment Feb_March_Final.pdf
WSMM Media and Entertainment Feb_March_Final.pdfWSMM Media and Entertainment Feb_March_Final.pdf
WSMM Media and Entertainment Feb_March_Final.pdfJamesConcepcion7
 
Welding Electrode Making Machine By Deccan Dynamics
Welding Electrode Making Machine By Deccan DynamicsWelding Electrode Making Machine By Deccan Dynamics
Welding Electrode Making Machine By Deccan DynamicsIndiaMART InterMESH Limited
 
PSCC - Capability Statement Presentation
PSCC - Capability Statement PresentationPSCC - Capability Statement Presentation
PSCC - Capability Statement PresentationAnamaria Contreras
 
Introducing the Analogic framework for business planning applications
Introducing the Analogic framework for business planning applicationsIntroducing the Analogic framework for business planning applications
Introducing the Analogic framework for business planning applicationsKnowledgeSeed
 
NAB Show Exhibitor List 2024 - Exhibitors Data
NAB Show Exhibitor List 2024 - Exhibitors DataNAB Show Exhibitor List 2024 - Exhibitors Data
NAB Show Exhibitor List 2024 - Exhibitors DataExhibitors Data
 
Technical Leaders - Working with the Management Team
Technical Leaders - Working with the Management TeamTechnical Leaders - Working with the Management Team
Technical Leaders - Working with the Management TeamArik Fletcher
 
How Generative AI Is Transforming Your Business | Byond Growth Insights | Apr...
How Generative AI Is Transforming Your Business | Byond Growth Insights | Apr...How Generative AI Is Transforming Your Business | Byond Growth Insights | Apr...
How Generative AI Is Transforming Your Business | Byond Growth Insights | Apr...Hector Del Castillo, CPM, CPMM
 
The-Ethical-issues-ghhhhhhhhjof-Byjus.pptx
The-Ethical-issues-ghhhhhhhhjof-Byjus.pptxThe-Ethical-issues-ghhhhhhhhjof-Byjus.pptx
The-Ethical-issues-ghhhhhhhhjof-Byjus.pptxmbikashkanyari
 
BAILMENT & PLEDGE business law notes.pptx
BAILMENT & PLEDGE business law notes.pptxBAILMENT & PLEDGE business law notes.pptx
BAILMENT & PLEDGE business law notes.pptxran17april2001
 
Fordham -How effective decision-making is within the IT department - Analysis...
Fordham -How effective decision-making is within the IT department - Analysis...Fordham -How effective decision-making is within the IT department - Analysis...
Fordham -How effective decision-making is within the IT department - Analysis...Peter Ward
 
Cybersecurity Awareness Training Presentation v2024.03
Cybersecurity Awareness Training Presentation v2024.03Cybersecurity Awareness Training Presentation v2024.03
Cybersecurity Awareness Training Presentation v2024.03DallasHaselhorst
 
Cyber Security Training in Office Environment
Cyber Security Training in Office EnvironmentCyber Security Training in Office Environment
Cyber Security Training in Office Environmentelijahj01012
 
trending-flavors-and-ingredients-in-salty-snacks-us-2024_Redacted-V2.pdf
trending-flavors-and-ingredients-in-salty-snacks-us-2024_Redacted-V2.pdftrending-flavors-and-ingredients-in-salty-snacks-us-2024_Redacted-V2.pdf
trending-flavors-and-ingredients-in-salty-snacks-us-2024_Redacted-V2.pdfMintel Group
 
Pitch Deck Teardown: Xpanceo's $40M Seed deck
Pitch Deck Teardown: Xpanceo's $40M Seed deckPitch Deck Teardown: Xpanceo's $40M Seed deck
Pitch Deck Teardown: Xpanceo's $40M Seed deckHajeJanKamps
 
Excvation Safety for safety officers reference
Excvation Safety for safety officers referenceExcvation Safety for safety officers reference
Excvation Safety for safety officers referencessuser2c065e
 

Último (20)

Send Files | Sendbig.comSend Files | Sendbig.com
Send Files | Sendbig.comSend Files | Sendbig.comSend Files | Sendbig.comSend Files | Sendbig.com
Send Files | Sendbig.comSend Files | Sendbig.com
 
The McKinsey 7S Framework: A Holistic Approach to Harmonizing All Parts of th...
The McKinsey 7S Framework: A Holistic Approach to Harmonizing All Parts of th...The McKinsey 7S Framework: A Holistic Approach to Harmonizing All Parts of th...
The McKinsey 7S Framework: A Holistic Approach to Harmonizing All Parts of th...
 
Healthcare Feb. & Mar. Healthcare Newsletter
Healthcare Feb. & Mar. Healthcare NewsletterHealthcare Feb. & Mar. Healthcare Newsletter
Healthcare Feb. & Mar. Healthcare Newsletter
 
WSMM Technology February.March Newsletter_vF.pdf
WSMM Technology February.March Newsletter_vF.pdfWSMM Technology February.March Newsletter_vF.pdf
WSMM Technology February.March Newsletter_vF.pdf
 
WSMM Media and Entertainment Feb_March_Final.pdf
WSMM Media and Entertainment Feb_March_Final.pdfWSMM Media and Entertainment Feb_March_Final.pdf
WSMM Media and Entertainment Feb_March_Final.pdf
 
Welding Electrode Making Machine By Deccan Dynamics
Welding Electrode Making Machine By Deccan DynamicsWelding Electrode Making Machine By Deccan Dynamics
Welding Electrode Making Machine By Deccan Dynamics
 
PSCC - Capability Statement Presentation
PSCC - Capability Statement PresentationPSCC - Capability Statement Presentation
PSCC - Capability Statement Presentation
 
Introducing the Analogic framework for business planning applications
Introducing the Analogic framework for business planning applicationsIntroducing the Analogic framework for business planning applications
Introducing the Analogic framework for business planning applications
 
NAB Show Exhibitor List 2024 - Exhibitors Data
NAB Show Exhibitor List 2024 - Exhibitors DataNAB Show Exhibitor List 2024 - Exhibitors Data
NAB Show Exhibitor List 2024 - Exhibitors Data
 
Technical Leaders - Working with the Management Team
Technical Leaders - Working with the Management TeamTechnical Leaders - Working with the Management Team
Technical Leaders - Working with the Management Team
 
How Generative AI Is Transforming Your Business | Byond Growth Insights | Apr...
How Generative AI Is Transforming Your Business | Byond Growth Insights | Apr...How Generative AI Is Transforming Your Business | Byond Growth Insights | Apr...
How Generative AI Is Transforming Your Business | Byond Growth Insights | Apr...
 
The-Ethical-issues-ghhhhhhhhjof-Byjus.pptx
The-Ethical-issues-ghhhhhhhhjof-Byjus.pptxThe-Ethical-issues-ghhhhhhhhjof-Byjus.pptx
The-Ethical-issues-ghhhhhhhhjof-Byjus.pptx
 
The Bizz Quiz-E-Summit-E-Cell-IITPatna.pptx
The Bizz Quiz-E-Summit-E-Cell-IITPatna.pptxThe Bizz Quiz-E-Summit-E-Cell-IITPatna.pptx
The Bizz Quiz-E-Summit-E-Cell-IITPatna.pptx
 
BAILMENT & PLEDGE business law notes.pptx
BAILMENT & PLEDGE business law notes.pptxBAILMENT & PLEDGE business law notes.pptx
BAILMENT & PLEDGE business law notes.pptx
 
Fordham -How effective decision-making is within the IT department - Analysis...
Fordham -How effective decision-making is within the IT department - Analysis...Fordham -How effective decision-making is within the IT department - Analysis...
Fordham -How effective decision-making is within the IT department - Analysis...
 
Cybersecurity Awareness Training Presentation v2024.03
Cybersecurity Awareness Training Presentation v2024.03Cybersecurity Awareness Training Presentation v2024.03
Cybersecurity Awareness Training Presentation v2024.03
 
Cyber Security Training in Office Environment
Cyber Security Training in Office EnvironmentCyber Security Training in Office Environment
Cyber Security Training in Office Environment
 
trending-flavors-and-ingredients-in-salty-snacks-us-2024_Redacted-V2.pdf
trending-flavors-and-ingredients-in-salty-snacks-us-2024_Redacted-V2.pdftrending-flavors-and-ingredients-in-salty-snacks-us-2024_Redacted-V2.pdf
trending-flavors-and-ingredients-in-salty-snacks-us-2024_Redacted-V2.pdf
 
Pitch Deck Teardown: Xpanceo's $40M Seed deck
Pitch Deck Teardown: Xpanceo's $40M Seed deckPitch Deck Teardown: Xpanceo's $40M Seed deck
Pitch Deck Teardown: Xpanceo's $40M Seed deck
 
Excvation Safety for safety officers reference
Excvation Safety for safety officers referenceExcvation Safety for safety officers reference
Excvation Safety for safety officers reference
 

Greece Spain Italy comparing economies infoDiagram

  • 2. Comparing EU countries Set of visualized data • GDP per capita & GDP growth • Government debt • Unemployment rate • Population European Union Spain Italy Greece Copyright: infoDiagram.com
  • 3. 0 100 200 250 150 300 50 44,0 Bulgaria 46,0 Romania 51,0 Latvia 57,0 Lithuania 63,0 Poland 64,0 Estonia 65,0 Hungary 74,0 Slovakia 80,0 Czech Republic 80,0 Portugal 83,0 Malta 85,0 Slovenia 90,0 Greece 99,0 Cyprus Copyright: infoDiagram.com 100,0 EU 27 100,0 Spain 101,0 Italy 108,0 France 112,0 United Kingdom GDP 2010 per capita, PPS 115,0 Finland 118,0 Germany 119,0 Belgium 123,0 Sweden GDP 2010 per capita, PPS 126,0 Austria 127,0 Denmark 128,0 Ireland 133,0 Netherlands 271,0 Luxembourg 2012-04-12 Source: Eurostat
  • 4. GDP 2010 per capita, PPS EU 27 100 100 Italy 101 Spain 100 101 90 Greece 90 100 80 85 90 95 100 105 Source: Eurostat Copyright: infoDiagram.com 2012-04-12
  • 5. Facts & observations Greece has the highest 10 year note yield in the eurozone at 24%. Spain and Italy while not the highest yield in Europe are a proxy for overall Eurozone risk due to the size and diversity of their respective economies. The Troika (EU, ECB and IMF) overseeing Greece's bailout has mandated that Greece cut its debt to GDP ratio to 120.5% of GDP by 2020. On Aug 13, 2012 it was announced that Greece’s national output shrank in the 2nd quarter by 6.2 per cent on an annual basis. The contraction was a marginal improvement on a 6.5 per cent fall in the 1st quarter. The Athens think-tank IOBE predicted on July 2012, that output would shrink by 6.9 per cent this year. Copyright: infoDiagram.com
  • 6. 0,0 5,0 -35,0 -30,0 -20,0 -15,0 -10,0 -5,0 -25,0 -31,3 Ireland -10,6 Greece -10,3 United Kingdom -9,8 Portugal -9,3 Spain -8,3 Latvia -7,8 Poland -7,7 Slovakia -7,1 France -7,0 Lithuania -6,9 Romania -6,6 EU 27 -5,8 Slovenia -5,3 Cyprus Copyright: infoDiagram.com -5,1 Netherlands -4,8 Czech Republic -4,6 Italy -4,4 Austria Government Debt, 2010 -4,3 Germany -4,2 Hungary -4,1 Belgium -3,6 Malta -3,1 Bulgaria -2,6 Denmark Government Debt 2010 (EU) -2,5 Finland -1,1 Luxembourg 0,2 Estonia 0,2 Sweden Government deficit/surplus, debt 2012-03-06 Source: Eurostat
  • 7. Government Debt 2010 (EU) EU 27 -6,6 -6,6% Italy -4,6 Spain -9,3 -4,6% -10,6% Greece -10,6 -9,3% -12,0 -7,0 -2,0 3,0 Source: Eurostat Copyright: infoDiagram.com Government deficit/surplus, debt 2012-03-06
  • 8. Facts & observations In February 2012 Greece executed the largest debt restructure ever attempted in the Eurozone with private holders of Greek government bonds (banks, insurers and investment funds), "voluntarily" accepting a bond swap with a 53.5% nominal write-off. On March 9, 2012 the International Swaps and Derivatives Association ruled that the earlier debt restructuring constituted a "credit event" meaning a maximum of $3.16 billion of net outstanding Greek credit default swap contracts could be paid out and settled between counterparties. Copyright: infoDiagram.com
  • 9. Facts & observations Spain's unemployment rate stood at 24.6% between April and June, up from 24.4% during the previous quarter. That's the highest level since 1976, soon after the death of the dictator Francisco Franco, and before the country returned to democracy. Euro-zone unemployment currently stands at a fresh record high of 11.2%, while the unemployment rate in the Eurozone's largest economy of Germany rose for a fourth straight month to 6.8% in July. Copyright: infoDiagram.com
  • 10. 0 5 10 15 20 25 30 4,2 Austria 4,9 Netherlands 5,1 Luxembourg 5,7 Germany 6,7 Czech Republic 6,8 Malta 7,1 Belgium 7,5 Finland 7,5 Romania 7,5 Sweden 7,8 Denmark 8,3 United Kingdom 8,7 Slovenia 8,9 Italy Copyright: infoDiagram.com 9,4 Cyprus 9,9 France 10,0 EU 27 10,1 Poland 11,0 Hungary Unemployment (2011.12) 11,7 Estonia 11,8 Bulgaria 14,1 Slovakia 14,3 Lithuania 14,6 Latvia 14,6 Portugal Unemployment rate, Dec 2011 14,7 Ireland 21,0 Greece 23,0 Spain Source: Eurostat 2012-04-02
  • 11. Unemployment rate, Dec 2011 EU 27 10 10 Italy 8,9 Spain 23 8,9 21 Greece 23 21 0 10 20 30 Source: Eurostat Copyright: infoDiagram.com 2012-04-02
  • 12. 20,0 40,0 60,0 100,0 0,0 80,0 0,4 Malta 0,5 Luxembourg 0,8 Cyprus 1,3 Estonia 2,1 Slovenia 2,2 Latvia 3,2 Lithuania 4,5 Ireland 5,4 Finland 5,4 Slovakia 5,6 Denmark 7,5 Bulgaria 8,4 Austria 9,4 Sweden Copyright: infoDiagram.com Population 10,0 Hungary 10,5 Czech Republic 10,6 Portugal 11,0 Belgium Population 2011 11,3 Greece 16,7 Netherlands 21,4 Romania 38,2 Poland 46,2 Spain 60,6 Italy 62,4 United Kingdom 65,0 France 81,8Germany 2012-03-30 Source: Eurostat
  • 13. Population 2011 Italy 60,6 Spain 46,2 60,6 Greece 46,2 11,3 11,3 0 20 40 60 80 Source: Eurostat Copyright: infoDiagram.com 2012-03-30
  • 14. -10 -5 0 5 10 -6,9 Greece -1,6 Portugal -0,2 Slovenia 0,4 Italy 0,5 Cyprus 0,7 Ireland 0,7 Spain 0,7 United Kingdom 1,0 Denmark 1,2 Netherlands 1,5 EU 27 1,6 Luxembourg 1,7 Bulgaria 1,7 Czech Republic Copyright: infoDiagram.com 1,7 France 1,7 Hungary 1,9 Belgium 2,1 Malta GDP growth 2010-2011 2,5 Romania 2,9 Finland 3,0 Germany 3,1 Austria GDP growth 2010-2011 3,3 Slovakia 3,9 Sweden 4,3 Poland 5,5 Latvia 5,9 Lithuania 7,6 Estonia 2012-04-16 Source: Eurostat
  • 15. GDP growth 2010-2011 EU 27 1,5 1,5% Italy 0,4 Spain 0,7 0,4% -6,9% Greece -6,9 0,7% -10 -5 0 5 Source: Eurostat Copyright: infoDiagram.com 2012-04-16
  • 16. Contact us in case of questions or topic cooperation www.infoDiagram.com Copyright: infoDiagram.com
  • 17. For more presentations, hit FOLLOW on slideshare.net/infodiagram Follow Copyright: infoDiagram.com