1. IBM Corporation Financial Profile June 2009
Recent Highlights: 2Q'09 IBM's ongoing transformation drove strong results and improved operating leverage
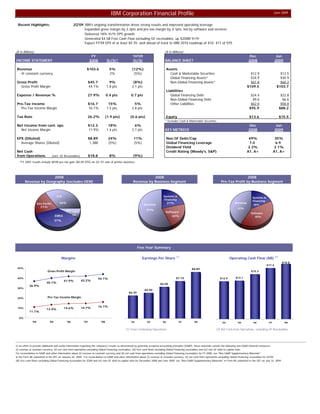
Expanded gross margin by 2.3pts and pre-tax margin by 4.1pts, led by software and services
Delivered 18% Yr/Yr EPS growth
Generated $4.5B Free Cash Flow excluding GF receivables, up $200M Yr/Yr
Expect FY'09 EPS of at least $9.70; well ahead of track to IBM 2010 roadmap of $10- $11 of EPS
($ in Billions) ($ in Billions)
FY 1H'09 Dec Jun
INCOME STATEMENT 2008 Yr/Yr* Yr/Yr BALANCE SHEET 2008 2009
Revenue $103.6 5% (12%) Assets
@ constant currency 2% (5%) Cash & Marketable Securities $12.9 $12.5
Global Financing Assets* $34.9 $30.9
Gross Profit $45.7 9% (8%) Non-Global Financing Assets* $61.8 $60.2
Gross Profit Margin 44.1% 1.8 pts 2.1 pts $109.5 $103.7
Liabilities
Expense / Revenue % 27.9% 0.4 pts 0.7 pts Global Financing Debt $24.4 $22.8
Non-Global Financing Debt $9.6 $6.6
Pre-Tax Income $16.7 15% 5% Other Liabilities $62.0 $58.8
Pre-Tax Income Margin 16.1% 1.5 pts 2.8 pts $95.9 $88.2
Tax Rate 26.2% (1.9 pts) (0.6 pts) Equity $13.6 $15.5
* Excludes Cash & Marketable Securities
Net Income from cont. ops. $12.3 18% 6% Dec Jun
Net Income Margin 11.9% 1.4 pts 2.1 pts KEY METRICS 2008 2009
EPS (Diluted) $8.89 24% 11% Non GF Debt/Cap 49% 35%
Average Shares (Diluted) 1,388 (5%) (5%) Global Financing Leverage 7.0 6.9
Dividend Yield 2.3% 2.1%
Net Cash Credit Rating (Moody's, S&P) A1, A+ A1, A+
from Operations (excl. GF Receivables) $18.8 8% (9%)
*FY 2007 results include $81M pre-tax gain ($0.05 EPS) on 2Q '07 sale of printer business.
2008 2008 2008
Revenue by Geography (excludes OEM) Revenue by Business Segment Pre-Tax Profit by Business Segment
U.S. Systems & Systems &
Financing Financing
34% Comm's 21% Services
Asia Pacific Services 18%
21% 42%
8% Can/ 57%
Software Software
EMEA LA 22% 40%
37%
Five Year Summary
Margins Earnings Per Share (1) Operating Cash Flow ($B) (2)
$18.8
$17.4
50% $8.89
Gross Profit Margin $15.3
40% 44.1% $7.15 $12.9 $13.1
41.9% 42.2%
40.1% $6.05
36.9%
30%
$4.90
$4.39
20% Pre-Tax Income Margin
14.7% 16.1%
10%
13.4% 14.6%
11.1%
0%
'04 '05 '06 '07 '08 '04 '05 '06 '07 '08 '04 '05 '06 '07 '08
(1) From Continuing Operations (2) Net Cash from Operations, excluding GF Receivables
In an effort to provide additional and useful information regarding the company’s results as determined by generally accepted accounting principles (GAAP), these materials contain the following non-GAAP financial measures:
(i) revenue at constant currency, (ii) net cash from operations excluding Global Financing receivables, (iii) free cash flows excluding Global Financing receivables and (iv) non GF debt-to-capital ratio.
For reconciliation to GAAP and other information about (i) revenue at constant currency and (ii) net cash from operations excluding Global Financing receivables for FY 2008, see "Non GAAP Supplementary Materials"
in the Form 8K submitted to the SEC on January 20, 2009. For reconciliation to GAAP and other information about (i) revenue at constant currency, (ii) net cash from operations excluding Global Financing receivables for 2Q'09,
(iii) free cash flows excluding Global Financing receivables for 2Q09 and (iv) non GF debt-to-capital ratio for December 2008 and June 2009, see "Non GAAP Supplementary Materials" in Form 8K submitted to the SEC on July 16, 2009.
2. IBM Corporation Key Segment Profiles
Services Revenue Profile Services
2008 Global Services Revenue = $58.9B, +9% yr/yr (+6% @cc) Global Technology Services Global Business Services
Global Technology Services Global Business Services • Focus on higher-growth segments • Deeper Client Relationships
$39.3B, +9% yr/yr (+6% @cc) $19.6B, +9% yr/yr (+5% @cc) - Service Management - Operational Excellence
Consulting - Converged Communications
Maintenance Systems Integration - Continuity and compliance • Differentiated Solutions
$7.2B, +9% yr/yr Application Management and Services
• Continue market leadership in - Differentiated Solutions
Integrated Tech. outsourcing
Services - Global delivery model • Delivered Globally
$9.3B, +10% yr/yr - Service quality - Flexible Delivery Model
- Cloud computing
Business
Transformation • Margin Expansion Strategy provides distinctive
Outsourcing - Lead through service quality competitive advantage enabling
$2.6B, +11% yr/yr - Standardize delivery processes continuous margin expansion
- Leverage IBM IP and assets
Strategic Outsourcing
$20.2B, +8% yr/yr Long-term Pre-tax income growth model 10%-12%
Software Revenue Profile Software
2008 Software Revenue = $22.1B, +11% yr/yr (+8% @cc)
• Deliver value through:
- Mission critical software
PLM - Short-term ROI and transformation projects
$1.0B, -9% yr/yr
• Utilize core middleware to drive Industry Framework solutions
Other Branded Middleware - Leverage IBM's unique assets/deliverables
$1.5B, +34% yr/yr $12.4B, +14% yr/yr - Cross-brand opportunity
WebSphere +6% - New revenue sources
Information Mgmt +24%
Operating Systems Tivoli +3% • Leverage Smarter Planet and Business Analytics & Optimization
$2.3B, +1% yr/yr Lotus +10% opportunities
Rational +13%
• Continue profit growth and IBM margin expansion
Other Middleware
$4.9B, +5% yr/yr
Long-Term pre-tax income growth Model: 12%-15%
(14%-17% excluding amortization of purchased intangibles)
Systems & Technology Revenue Profile Systems & Technology
2008 Systems & Technology Revenue = $19.3B, -10% yr/yr (-11% @cc)
• Continue Systems leadership to gain share and capture growth
Other
$0.4B, -7% yr/yr
Retail Store Solutions • Extend leadership in virtualization and consolidation
$0.7B, -15% yr/yr
Microelectronics OEM Servers • Position IBM to win the future computing infrastructure opportunity
$1.9B, -28% yr/yr $12.7B, -5% yr/yr
System z +12%
Converged System p +11% • Drive additional growth and margin opportunity through:
Storage Legacy System i -66% - System Design
$3.6B, -3% yr/yr System x -17% - Virtualization
- Workload Management
• Capture emerging workloads for Smarter Planet
Long-term Pre-tax income growth Model: 7%-9%