SlideShare a Scribd company logo
1 of 6
Download to read offline
IOSR Journal of Economics and Finance (IOSR-JEF)
e-ISSN: 2321-5933, p-ISSN: 2321-5925.Volume 6, Issue 6. Ver. I (Nov. - Dec. 2015), PP 26-31
www.iosrjournals.org
DOI: 10.9790/5933-06612631 www.iosrjournals.org 26 | Page
Primary Education in Andhra Pradesh
V.Jagannathan
Lecture in Economics, P.S.Govt.degree College Penukonda- Ananatapuramu District A.P
Abstract: Education is the most important element of growth and prosperity of a nation. India is in the process
of transforming itself into a developed nation by 2020. Yet we have 350 million people who need literacy and
many more who have to acquire employment skills to suit the emerging modern India and globe. Children who
belong to weaker sections of our society are undernourished and only a small percentage of them managed to
complete eight years of satisfactory education. We need to think specially for them. Primary education is the
foundation on which the development of every citizen and the nation as a whole built on. In recent past, India
has made a huge progress in terms of increasing primary education enrolment, retention, regular attendance
rate and expanding literacy to approximately two third of the population. India’s improved education system is
often cited as one of the main contributors to the economic development of India. At the same time, the quality
of elementary education in India had also been a major concern.
Key words: Primary schools, Infrastructure facilities, Enrolment, Student –teacher ratios, Dropout rates and
Expenditure on education.
I. Introduction
Primary education is the foundation on which the development of every citizen and the nation as a
whole built on. In recent past, India has made a huge progress in terms of increasing primary education
enrolment, retention, regular attendance rate and expanding literacy to approximately two third of the
population. India’s improved education system is often cited as one of the main contributors to the economic
development of India. At the same time, the quality of elementary education in India had also been a major
concern.
Free and compulsory education to all children up to the age fourteen is constitutional commitment in
India. The parliament of India has recently passed Right to Education Act through which education has become
fundamental right of all children of age group 6-14 years. The country is yet to achieve the elusive goal of
universalization of Elementary Education (UEE), which means 100 percent enrolment and retention of children
with schooling facilities in all habitations. It is to fill this gap that the government has launched the Sarva
Shiksha Abhiyan in 2001, one of the largest such programs in the world.
It is the education that it would accelerate economic growth, that it would improve the levels of living
of the people and that it would encourage modern attitudes. Education is also recognized as a basic input for
empowerment to individual and overall development of the society. Almost all third world nations believe that it
is the rapid expansion of educational opportunities that holds the basic key for national development. Despite its
importance, education continues to be a neglected area at the policy level .after many years of planning and
promises total literacy in India remains to be a distant dream. The literacy rate for the country as a whole in
2001 worked out to 65.38 percent for the population aged seven years and above. The corresponding figures for
males and females are 75.85 and 54.16 percent respectively. Kerala with a literacy rate of 90.92 per cent holds
the first rank while Bihar with a literacy rate 47.53 percent ranks last in the country. In 2001 the overall literacy
rate in Andhra Pradesh stood at 61 percent.
This paper makes an attempt to analyze the performance of primary education in Andhra Pradesh in
terms of number of schools, infrastructure facilities, enrolment, dropout rates, student teacher ratios and
expenditure on primary education. Here primary education .here primary education covers up to class V in
Andhra Pradesh .this study mainly relies on secondary data .it also makes use of the data relating to upper
primary schools, high schools and all India statistics for the purpose of comparative analysis.
Primary schools
Large number of primary schools is necessary to meet the demand and to achieve the objective of total
literacy. Table 1 shows the progress of primary schools between 1986 and 2005 in Andhra Pradesh. The total
number of schools increased from 44,346 in 1986 to 63,362 in 2002 and again declined to 6, 51,680 in 2005,
than by 2013 it become 1,22,441. The data presented in table 1 clearly reveals that as high as 91.55 percent of
primary schools are being managed by local bodies like mandal praja parishats, Zilla praja parishats and
municipalities. But the percentage of schools managed by local bodies declined from 91.55 in 1986 to 80.35 in
2005 later it increasing in positive manner. The share of private aided schools in total schools is not significant.
Primary Education in Andhra Pradesh
DOI: 10.9790/5933-06612631 www.iosrjournals.org 27 | Page
While the percentage of government schools increased from 2.55 in 1986 to 8.24 in 2005 and 46.48 by 2013. In
absolute terms the number of government schools rose from 1,131 to 5,085 in 2005 than 56.922 by 2013 during
the same period it is also interesting to note that the number of private unaided schools rose significantly from
643 (1.45%) in 1986 to 4,756 (7.71%) in 2005 than 10,385 by 2013.
Table-1
Primary schools by management
Management 1986 2002 2005 2013
Government
1,131
(2.55)
5,666
(8.94)
5,085
(8.24)
56,922
(46.48)
Local bodies
40,599
(91.55)
51,268
(80.91)
49,559
(80.35)
52,150
(42.60)
Private aided
1,973
(4.45)
2,265
(3.57)
2,280
(3.70)
2,984
(2.43)
Private unaided
643
(1.45)
4,163
(6.57)
4,756
(7.71)
10,385
(8.49)
Total
44,346
(100.00)
63,362
(100.00)
61,680
(100.00)
1,22,441
(100.00)
Source: 1. Fifth all India educational survey, NCERT, New Delhi,
2. Statistical abstracts, directorate of economics and statistics, government of AP.
Infrastructure facilities
Availability of teachers and infrastructure facilities in schools is necessary to provide quality education.
Table 2 shows the schools having basic infrastructure facilities for different years. These basic facilities include
permanent building, black- board, drinking water, toilets, library, playground and electricity. As high as eighty
per cent of the primary schools have pucca buildings but nearly half of the schools have single rooms and about
31 percent of the schools are single teacher schools. It is also evident that the percentage of schools without
important infrastructure facilities increased over a period of time. However there are schools without important
infrastructure facilities. About 30 percent of schools do not have drinking water by 2005 later increased up to 72
per cent by 2013, nearly 74 percent of schools do not have separate toilets for girls and 58 percent of schools are
not having toilets.
Only 57 percent of schools have facility and more than forty percent of schools do not have playground
facility. As high as 76 per cent of schools do not have electricity facility. Unless these basic facilities are
improved in all primary schools we cannot expect teachers to succeed in accomplishing even the more modest
aims of primary education. In a highly completive world all schools must have good infrastructure facilities.
Otherwise they cannot attract more students and the objective of universalization of elementary education
cannot be achieved.
Table- 2
Basic facilities in primary schools
Facility
Percentage of schools having
1979 1986 2005 2013
Pucca building 45.00 67.30 76.27 79.89
Drinking water 41.00 42.50 65.14 71.93
Toilet 5.00 10.80 42.27 73.64
Girls toilet -- 2.10 25.90 72.63
Library 34.00 -- 50.06 54.36
Play ground 51.00 54.92 46.72 57.45
Electricity -- -- 15.72 76.48
Boundary wall -- -- 45.53 69.58
Source: 1. Fourth & fifth all India educational survey, NCERT, New Delhi, 1978-79&1992.
2. Elementary education in India, NIEPA department of elementary Education and literacy, government of
India, 2006.
Enrolment
Accessibility of schooling facilities is no longer a major problem. As shown in table 3 the number of
schools in Andhra Pradesh increased from 29,076 in 1956-57 to 70,620 in 2012-13 registering a 4.10 fold
increase. Out of total primary schools 70,620 (99.11%) are for boys and 562 (0.82%) for girls, the number of
children enrolled in classes I-V rose significantly from 24.54 lakh to 74.40 lakh during the same period. The rate
of enrolment also improved from 57.94 percent in 1956-57 to 107.02 percent in 2012-13. Gender wise
enrolment ratios for classes’ I-V are calculated separately to know the differences in the enrolment ratios of
Primary Education in Andhra Pradesh
DOI: 10.9790/5933-06612631 www.iosrjournals.org 28 | Page
boys increased from 86.2 to 118.07 while the enrolment ratio rose from 57.94 to 107.02 during the same period.
In 1990 and 2000 the enrolment ratio of girls was less than that of boys.
Table -3
Growth of primary education in Andhra Pradesh.
year No of schools
No. of children
Enrolled
In (lakhs)
Rate of enrolment
(in %)
No of children
Per school.
1956-57 29,076 24.54 57.94 84
1960-61 34,040 29.76 68.25 87
1965-66 37,320 37.69 76.61 100
1973-74 36,984 40.40 64.55 109
1977-78 38,836 46.76 70.55 120
1981-82 40,691 54.66 85.00 134
1984-85 41,702 64.12 89.10 153
1989-90 49,000 69.21 88.52 141
1995-96 49,125 76.40 94.92 155
2002-03 63,362 63.51 117.74 100
2004-05 61,680 55.24 109.88 90
2011-12 55,570 53.09 101.28 84
2012-13 70,620 74.40 107.02 101
Source: 1. Andhra Pradesh at 50: a data based analysis, data news features, Hyderabad, 1998.
2. Statistical abstracts, directorate of economics and statistics, government of AP.
But in 2012-13 the enrolment ratios of boys and girls are more or less equal to each other and they are
greater than 100 percent. It is due to the inclusion of under age and over age children, here enrolment is simply
the percentage of enrolment in classes I – V to the estimated child population in the age group of 6-10 years. It
is observed that there is no steady growth in the average number of children enrolled in each school. The
average number of children per school varied from 84 in 1956-57 to 155 1995-96 than 101 in 2012-13. In 2012-
13 the average number of children per school is 101. This implies the fact that on an average there are only 20
students I each class.
Student –teacher ratios
The number of teachers in the primary schools of Andhra Pradesh increased from 78,521 in 1960-61 to
1, 66,935 in 2004-05 than decreased slightly to 1, 04,772 by 2013. At the same time the percentage of women
teachers also rose from 18.62 to 48.02 during the same period. One of the important indicators that influence
classroom transaction is the student –teacher ratio which is presented by region in table 4. Student –ratio rose
from 27.5 in 1981 to 51.9 in 1991. Afterwards the student –teacher ratio in the state as a whole started declining
and reached to 31.1 in 2005 than 32.7 by 2013. Among the three regions the student-teacher ratio in 2013
ranged between 32.7 in coastal Andhra and 31.5 in Telangana. This indicates that the regional disparities in
student –teacher ratios have narrowed down over a period from 1991 to 2013. The heaviest pupil –teacher ratio
in primary schools is observed in Bihar (76.1), followed by Uttar Pradesh (74.1),Jharkhand(54.1) and west
Bengal(50.1) .while the lowest pupil –teacher ratio is found in Sikkim (10.1), Jammu &Kashmir and Nagaland
each with 15:1 (Arum C. Mehta, 2012-13).
Table- 4
Student teacher ratios in primary schools
Region 1981 1991 2001 2005 2013
Coastal Andhra 27.5 51.9 44.0 31.1 32.7
Rayalaseema 33.4 49.7 46.6 30.6 34.4
Telangana 23.0 48.5 50.6 35.9 31.5
Andhra Pradesh 27.5 51.9 46.5 33.1 29.5
Source: 1. Census and department of Education, Government of AP.
2. Statistical abstracts, directorate of economics and statistics, government of AP.
Primary Education in Andhra Pradesh
DOI: 10.9790/5933-06612631 www.iosrjournals.org 29 | Page
Figure 1 Student teacher ratios in primary schools
Dropout rates
The ratios of students going out of the school system to the enrolment in class I in the base year is
termed as dropout rate. Dropout rates in classes I-V,I-VII and I-X are shown in table 5. In Andhra Pradesh the
dropout rate in classes’ I-V was recorded at 31.95 percent in 2004-05 and declined to 16.17 by 2013. It is
observed that the differences in the dropout rates of boys and girls declined. For instance in 2012-13 the dropout
rated of boys and girls were recorded at 16.69 percent and 15.62 percent respectively. In 2012-13 the dropout
rates in classes I –VII and I-X were recorded at 26.83 percent and 31.95 percent respectively. It means only 32
percent of the total students enrolled in class I reached class X. the dropout rate of girls in classes’ I-VII and I-X
is high compared to that of boys. The dropout rates of both boys and girls are increasing from primary to upper
primary and to high school.
Table-5
Dropout rates in Andhra Pradesh
Classes 2002-03 2004-05 2013
Boys Girls Total Boys Girls Total Boys Girls Total
I-V 33.74 30.91 32.39 31.77 32.14 31.95 16.69 15.62 16.17
I-VII 49.93 53.22 51.52 51.96 54.46 53.17 27.24 26.41 26.83
I-X 67.46 71.02 69.12 62.30 65.24 63.69 28.36 45.24 31.95
Source: 1. statistical Abstracts, Directorate of Economics and Statistics, Government of AP.
Figure 2 Dropout rates in Andhra Pradesh
Primary Education in Andhra Pradesh
DOI: 10.9790/5933-06612631 www.iosrjournals.org 30 | Page
District wise data for 2012-13 reveals that the dropout rates in classes I-V are very high in Mahaboob
Nagar district (49.02%) followed by Medak district (52.34 %) and Warangal district (52.13). while the dropout
rates in Classes I-V are very low in Kadapa district (8.34%) followed by Hyderabad district (8.53%) and Chittor
district (9.71 percent). gender wise dropout rates are also high in the districts of Mahaboob Nagar, Medak and
Warangal.
Expenditure on education:
The analysis of public expenditure and financial resources is recognized as an important variable in
understanding the status of education only recently after the 1990 conference in jominten, South Africa and the
revised national policy on education in 1992. Table 6 shows the trends in the expenditure on education in
Andhra Pradesh. Of the total expenditure on education the percentage share of primary education are below the
requirements (above 60 percent). The ratio of total expenditure on education to G.S.D.P. remains more or less at
three percent. (V. Ratna Reddy & R. Nageswara Rao, 2012) therefore the investment in education needs to be
increased and a greater allocation to primary education is necessary if every child is to be got into school.
Table-6
Trends in the expenditure on education
Year Expenditure on education
As % to GSDP
Percentage share
of primary education
1980-81 2.9 44
1985-86 3.3 46
1990-91 2.8 46
1995-96 2.4 55
1996-97 2.6 54
1997-98 2.7 53
1998-99 2.9 56
1999-00 3.1 57
2000-01 3.3 51
2001-02 3.2 53
2002-03 3.9 48
2003-04 3.4 54
2010-11 4.8 52
2012-13 4.4 50
Source: 1.Andhra Pradesh Development, Centre for Economic and Social Studies, Hyderabad, 2003.
Primary Education in Andhra Pradesh
DOI: 10.9790/5933-06612631 www.iosrjournals.org 31 | Page
Figure 3 Trends in the expenditure in Education
Summary
The numbers of primary schools in Andhra Pradesh rose significantly from 29,076 in 1956-57 to 61689
in 2004-05 than 70,620 by 2013 majority of the primary schools (70.30%) are managed by local bodies, it is
evident that the percentage share of private schools had shown increasing trend from 1.45 in 1986 to 7.75 in
2005 and 8.51 by 2013. The study clearly reveals that many schools do not have basic facilities like drinking
water, toilets, library, playground, electricity etc. it is quite impressive to note that the enrolment ratio exceeded
100 percent and recorded at 07 percent in 2013. Not only that the gap between the enrolment ratios of boys and
girls declined substantly over a period of time. It is also observed that the number of schools established for girls
is only 487 which account for 0.72 percent of total primary schools in Andhra Pradesh.
As far as student – teacher ratio is concerned Andhra Pradesh is in better position. Because the student
–teacher ratio declined from 51.9 in 1991 to 33.1 in 2005 and 31.2 by 2013. Region wise statistics reveal that
the student –teacher ratio in 2001 was low in coastal Andhra compared to that of Telangana and Rayalaseema
regions. The gap between the dropouts’ rates of boys and girls narrowed down considerably. But the dropout
rates of both boys and girls are very high in classes’ I-VII and I-X. for instance in 2012-13 the dropout rates of
boys and girls in I-VII were recorded at 26.41 to 26.83 45.24 respectively, similarly in classes I-X the dropout
rates of boys and girls were recorded at 45.24 to 31.95 respectively .it is also found that there are some districts
like Kadapa, Hyderabad and chitter where the dropout rates in classes I-V are very low and ranged between 8.34
and 9.71 percent, it is observed that the share of primary education in total expenditure from 44 percent 1980-81
to 57 percent in 2000 than declined to 50 per cent by 2013. But the expenditure on education as per cent to
GSDP of AP. Remained more or less around 4 percent. It implies the fact the education was not given much
importance.
Suggestions
Since majority of the primary schools are not having the basic facilities there is dire need for providing
infrastructure facilities in all schools. Despite several efforts the dropouts continue. This must be checked by
implementing the existing programs effectively and by encouraging the parents who lack motivation and
capacity to send their children to school regularly. As the primary education is the base for higher education and
achieving total literacy its performance must be improved. The retention at primary level is the main concern.
Economy should be addressing the problems of disadvantage groups. Financial allocations for education are to
be increased to solve its problems and to improve the performance of primary education. Otherwise the
performance of primary education may not be up to our expectations.
References
[1]. Aruna, R. (1999), “learn thoroughly: primary schooling in Tamilnadu , economic and political weekly , vol. 34, No. 18.
[2]. Chalam,K.S.(1998), “Education “, in V.Hanumantha Rao rt.al (ed), Andhra Pradesh at 50: a data based analysis , Hyderabad: data
news features.
[3]. Kaul, Rekha (2001), “assessing primary education –going beyond the classroom”, economic and political weekly , vol. XXXVI, no.
2 p. 13-19, January.
[4]. Ratna Reddy , V and R.nageswara Rao, (2003),”primary education: causes and constrains”, in C.H. Hanumantha Rao and
S.Mahendra Dev (ed) Andhra Pradesh development , centre for economic and social studies , Hyderabad.
[5]. Sheriff, A. and P.K.Gosh (2000), “Indian education scene and public expenditure gap “, economic and political weekly, April 15, P.
1396-1406.
2.9
3.3
2.8
2.4
2.6
2.7
2.9
3.1
3.3
3.2
3.9
3.4
4.8
4.4
44
46
46
55
54
53
56
57
51
53
48
54
52
50
Percentage
Acadamic years
Trends in the expenditure in Education
Expenditure on education As % to GSDP Percentage share of primary education

More Related Content

What's hot

20120928 education system in india
20120928 education system in india20120928 education system in india
20120928 education system in indiaRiddhi Dash
 
Indian education system
Indian education systemIndian education system
Indian education systemsairam bandaru
 
Problems in the indian education system
Problems in the indian education systemProblems in the indian education system
Problems in the indian education systemJaslynn joan
 
Education system in india
Education system in indiaEducation system in india
Education system in indiaYash Wadhwani
 
Education sector in india
Education sector in indiaEducation sector in india
Education sector in indiaArjun Gupta
 
Education sector in India
Education sector in IndiaEducation sector in India
Education sector in IndiaRajat Kumar
 
Indian Education System - Understanding the Faultlines
Indian Education System - Understanding the FaultlinesIndian Education System - Understanding the Faultlines
Indian Education System - Understanding the FaultlinesBal Utsav
 
Copy of litrecy in india ujjwal & tarang 8 c
Copy of litrecy in india ujjwal & tarang 8 cCopy of litrecy in india ujjwal & tarang 8 c
Copy of litrecy in india ujjwal & tarang 8 cTarang Bansal
 
Ppt on education system in india
Ppt on education system in indiaPpt on education system in india
Ppt on education system in indiakbcock
 
Problems of Elementary Education in Valsad District of Gujarat
Problems of Elementary Education in Valsad District of GujaratProblems of Elementary Education in Valsad District of Gujarat
Problems of Elementary Education in Valsad District of Gujaratijtsrd
 
Education in Rural India
Education in Rural IndiaEducation in Rural India
Education in Rural IndiaKrishna Omer
 
Primary education in India
Primary  education  in  IndiaPrimary  education  in  India
Primary education in IndiaDEEPAK CHAUDHARY
 
Indian education system
Indian education systemIndian education system
Indian education systemPraveen2992
 
Indian education system
Indian education systemIndian education system
Indian education systemAshish Kumar
 
Education industry in india ppt
Education industry in india pptEducation industry in india ppt
Education industry in india pptparth_banerjee1976
 

What's hot (20)

20120928 education system in india
20120928 education system in india20120928 education system in india
20120928 education system in india
 
Education and Training Sector Report January 2018
Education and Training Sector Report January 2018Education and Training Sector Report January 2018
Education and Training Sector Report January 2018
 
Indian education system
Indian education systemIndian education system
Indian education system
 
Problems in the indian education system
Problems in the indian education systemProblems in the indian education system
Problems in the indian education system
 
rockstar
rockstarrockstar
rockstar
 
Education and Training Sector Report - January 2019
Education and Training Sector Report - January 2019Education and Training Sector Report - January 2019
Education and Training Sector Report - January 2019
 
Education system in india
Education system in indiaEducation system in india
Education system in india
 
Education sector in india
Education sector in indiaEducation sector in india
Education sector in india
 
Education sector in India
Education sector in IndiaEducation sector in India
Education sector in India
 
Indian Education System - Understanding the Faultlines
Indian Education System - Understanding the FaultlinesIndian Education System - Understanding the Faultlines
Indian Education System - Understanding the Faultlines
 
Copy of litrecy in india ujjwal & tarang 8 c
Copy of litrecy in india ujjwal & tarang 8 cCopy of litrecy in india ujjwal & tarang 8 c
Copy of litrecy in india ujjwal & tarang 8 c
 
Education in India
Education in IndiaEducation in India
Education in India
 
Ppt on education system in india
Ppt on education system in indiaPpt on education system in india
Ppt on education system in india
 
10120140504010
1012014050401010120140504010
10120140504010
 
Problems of Elementary Education in Valsad District of Gujarat
Problems of Elementary Education in Valsad District of GujaratProblems of Elementary Education in Valsad District of Gujarat
Problems of Elementary Education in Valsad District of Gujarat
 
Education in Rural India
Education in Rural IndiaEducation in Rural India
Education in Rural India
 
Primary education in India
Primary  education  in  IndiaPrimary  education  in  India
Primary education in India
 
Indian education system
Indian education systemIndian education system
Indian education system
 
Indian education system
Indian education systemIndian education system
Indian education system
 
Education industry in india ppt
Education industry in india pptEducation industry in india ppt
Education industry in india ppt
 

Viewers also liked

Concept presentation
Concept presentationConcept presentation
Concept presentationmschool419
 
Translational science
Translational scienceTranslational science
Translational scienceoatext
 
Awarding Passion & Skills
Awarding Passion & Skills Awarding Passion & Skills
Awarding Passion & Skills Kiran Shaw
 
жера №43
жера  №43жера  №43
жера №43kidsher
 
Critical Review of Poverty Reduction Programme in Nigeria: Evidence from Sout...
Critical Review of Poverty Reduction Programme in Nigeria: Evidence from Sout...Critical Review of Poverty Reduction Programme in Nigeria: Evidence from Sout...
Critical Review of Poverty Reduction Programme in Nigeria: Evidence from Sout...iosrjce
 
Documentos primaria-sesiones-unidad02-integradas-sexto grado-sesion23-integ_6to
Documentos primaria-sesiones-unidad02-integradas-sexto grado-sesion23-integ_6toDocumentos primaria-sesiones-unidad02-integradas-sexto grado-sesion23-integ_6to
Documentos primaria-sesiones-unidad02-integradas-sexto grado-sesion23-integ_6toTeresa Clotilde Ojeda Sánchez
 
Poultry India - Knowledge Day 2015 Speaker Dr. Marcelo Paniago
Poultry India - Knowledge Day 2015 Speaker Dr. Marcelo PaniagoPoultry India - Knowledge Day 2015 Speaker Dr. Marcelo Paniago
Poultry India - Knowledge Day 2015 Speaker Dr. Marcelo PaniagoPoultry India
 

Viewers also liked (7)

Concept presentation
Concept presentationConcept presentation
Concept presentation
 
Translational science
Translational scienceTranslational science
Translational science
 
Awarding Passion & Skills
Awarding Passion & Skills Awarding Passion & Skills
Awarding Passion & Skills
 
жера №43
жера  №43жера  №43
жера №43
 
Critical Review of Poverty Reduction Programme in Nigeria: Evidence from Sout...
Critical Review of Poverty Reduction Programme in Nigeria: Evidence from Sout...Critical Review of Poverty Reduction Programme in Nigeria: Evidence from Sout...
Critical Review of Poverty Reduction Programme in Nigeria: Evidence from Sout...
 
Documentos primaria-sesiones-unidad02-integradas-sexto grado-sesion23-integ_6to
Documentos primaria-sesiones-unidad02-integradas-sexto grado-sesion23-integ_6toDocumentos primaria-sesiones-unidad02-integradas-sexto grado-sesion23-integ_6to
Documentos primaria-sesiones-unidad02-integradas-sexto grado-sesion23-integ_6to
 
Poultry India - Knowledge Day 2015 Speaker Dr. Marcelo Paniago
Poultry India - Knowledge Day 2015 Speaker Dr. Marcelo PaniagoPoultry India - Knowledge Day 2015 Speaker Dr. Marcelo Paniago
Poultry India - Knowledge Day 2015 Speaker Dr. Marcelo Paniago
 

Similar to Primary Education in Andhra Pradesh

Status of elementary education in gujarat
Status of elementary education in gujaratStatus of elementary education in gujarat
Status of elementary education in gujaratPremlatakshatriya
 
Status of Education in India by Mohit Rajput
Status of Education in India by Mohit RajputStatus of Education in India by Mohit Rajput
Status of Education in India by Mohit RajputMohit Rajput
 
Hindrances in promotion of education
Hindrances in promotion of educationHindrances in promotion of education
Hindrances in promotion of educationtalhawaseem8
 
2012 ICSA Indian Economics Lecture 5
2012 ICSA Indian Economics Lecture 52012 ICSA Indian Economics Lecture 5
2012 ICSA Indian Economics Lecture 5Dr. Subir Maitra
 
ISR Project - Education to underprivileged
ISR Project - Education to underprivilegedISR Project - Education to underprivileged
ISR Project - Education to underprivilegedPallavi Srivastava
 
Sarva shiksha abhiyaan (ssa)
Sarva shiksha abhiyaan (ssa)Sarva shiksha abhiyaan (ssa)
Sarva shiksha abhiyaan (ssa)Thanavathi C
 
Vision for higher education in india
Vision for higher education in indiaVision for higher education in india
Vision for higher education in indiaBhakti Sharma
 
Literacy rate in India
Literacy rate in IndiaLiteracy rate in India
Literacy rate in IndiaAltacit Global
 
Level of Participation of Muslim Children in Primary & Upper Primary Education
Level of Participation of Muslim Children in Primary & Upper Primary EducationLevel of Participation of Muslim Children in Primary & Upper Primary Education
Level of Participation of Muslim Children in Primary & Upper Primary Educationpaperpublications3
 
Education Industry In India
Education Industry In IndiaEducation Industry In India
Education Industry In IndiaParth Banerjee
 
Status of Elementary Education in Uttarakhand
Status of Elementary Education in UttarakhandStatus of Elementary Education in Uttarakhand
Status of Elementary Education in Uttarakhandijtsrd
 
11.effectiveness of open and distance education and the relevance of ict
11.effectiveness of open and distance education and the relevance of ict11.effectiveness of open and distance education and the relevance of ict
11.effectiveness of open and distance education and the relevance of ictAlexander Decker
 
Effectiveness of open and distance education and the relevance of ict
Effectiveness of open and distance education and the relevance of ictEffectiveness of open and distance education and the relevance of ict
Effectiveness of open and distance education and the relevance of ictAlexander Decker
 
2015 EMIS Data Summary
2015 EMIS Data Summary2015 EMIS Data Summary
2015 EMIS Data SummaryAntoine Huss
 

Similar to Primary Education in Andhra Pradesh (20)

Status of elementary education in gujarat
Status of elementary education in gujaratStatus of elementary education in gujarat
Status of elementary education in gujarat
 
Status of Education in India by Mohit Rajput
Status of Education in India by Mohit RajputStatus of Education in India by Mohit Rajput
Status of Education in India by Mohit Rajput
 
krazziie
krazziiekrazziie
krazziie
 
Hindrances in promotion of education
Hindrances in promotion of educationHindrances in promotion of education
Hindrances in promotion of education
 
2012 ICSA Indian Economics Lecture 5
2012 ICSA Indian Economics Lecture 52012 ICSA Indian Economics Lecture 5
2012 ICSA Indian Economics Lecture 5
 
ISR Project - Education to underprivileged
ISR Project - Education to underprivilegedISR Project - Education to underprivileged
ISR Project - Education to underprivileged
 
Sarva shiksha abhiyaan (ssa)
Sarva shiksha abhiyaan (ssa)Sarva shiksha abhiyaan (ssa)
Sarva shiksha abhiyaan (ssa)
 
Vision for higher education in india
Vision for higher education in indiaVision for higher education in india
Vision for higher education in india
 
E0413024027
E0413024027E0413024027
E0413024027
 
Literacy rate in India
Literacy rate in IndiaLiteracy rate in India
Literacy rate in India
 
Level of Participation of Muslim Children in Primary & Upper Primary Education
Level of Participation of Muslim Children in Primary & Upper Primary EducationLevel of Participation of Muslim Children in Primary & Upper Primary Education
Level of Participation of Muslim Children in Primary & Upper Primary Education
 
Level of Participation of Muslim Children in Primary & Upper Primary Education
Level of Participation of Muslim Children in Primary & Upper Primary EducationLevel of Participation of Muslim Children in Primary & Upper Primary Education
Level of Participation of Muslim Children in Primary & Upper Primary Education
 
Education Industry In India
Education Industry In IndiaEducation Industry In India
Education Industry In India
 
Status of Elementary Education in Uttarakhand
Status of Elementary Education in UttarakhandStatus of Elementary Education in Uttarakhand
Status of Elementary Education in Uttarakhand
 
Psm and education
Psm and educationPsm and education
Psm and education
 
11.effectiveness of open and distance education and the relevance of ict
11.effectiveness of open and distance education and the relevance of ict11.effectiveness of open and distance education and the relevance of ict
11.effectiveness of open and distance education and the relevance of ict
 
Effectiveness of open and distance education and the relevance of ict
Effectiveness of open and distance education and the relevance of ictEffectiveness of open and distance education and the relevance of ict
Effectiveness of open and distance education and the relevance of ict
 
GITAMITES
GITAMITESGITAMITES
GITAMITES
 
Indian education
Indian educationIndian education
Indian education
 
2015 EMIS Data Summary
2015 EMIS Data Summary2015 EMIS Data Summary
2015 EMIS Data Summary
 

More from iosrjce

An Examination of Effectuation Dimension as Financing Practice of Small and M...
An Examination of Effectuation Dimension as Financing Practice of Small and M...An Examination of Effectuation Dimension as Financing Practice of Small and M...
An Examination of Effectuation Dimension as Financing Practice of Small and M...iosrjce
 
Does Goods and Services Tax (GST) Leads to Indian Economic Development?
Does Goods and Services Tax (GST) Leads to Indian Economic Development?Does Goods and Services Tax (GST) Leads to Indian Economic Development?
Does Goods and Services Tax (GST) Leads to Indian Economic Development?iosrjce
 
Childhood Factors that influence success in later life
Childhood Factors that influence success in later lifeChildhood Factors that influence success in later life
Childhood Factors that influence success in later lifeiosrjce
 
Emotional Intelligence and Work Performance Relationship: A Study on Sales Pe...
Emotional Intelligence and Work Performance Relationship: A Study on Sales Pe...Emotional Intelligence and Work Performance Relationship: A Study on Sales Pe...
Emotional Intelligence and Work Performance Relationship: A Study on Sales Pe...iosrjce
 
Customer’s Acceptance of Internet Banking in Dubai
Customer’s Acceptance of Internet Banking in DubaiCustomer’s Acceptance of Internet Banking in Dubai
Customer’s Acceptance of Internet Banking in Dubaiiosrjce
 
A Study of Employee Satisfaction relating to Job Security & Working Hours amo...
A Study of Employee Satisfaction relating to Job Security & Working Hours amo...A Study of Employee Satisfaction relating to Job Security & Working Hours amo...
A Study of Employee Satisfaction relating to Job Security & Working Hours amo...iosrjce
 
Consumer Perspectives on Brand Preference: A Choice Based Model Approach
Consumer Perspectives on Brand Preference: A Choice Based Model ApproachConsumer Perspectives on Brand Preference: A Choice Based Model Approach
Consumer Perspectives on Brand Preference: A Choice Based Model Approachiosrjce
 
Student`S Approach towards Social Network Sites
Student`S Approach towards Social Network SitesStudent`S Approach towards Social Network Sites
Student`S Approach towards Social Network Sitesiosrjce
 
Broadcast Management in Nigeria: The systems approach as an imperative
Broadcast Management in Nigeria: The systems approach as an imperativeBroadcast Management in Nigeria: The systems approach as an imperative
Broadcast Management in Nigeria: The systems approach as an imperativeiosrjce
 
A Study on Retailer’s Perception on Soya Products with Special Reference to T...
A Study on Retailer’s Perception on Soya Products with Special Reference to T...A Study on Retailer’s Perception on Soya Products with Special Reference to T...
A Study on Retailer’s Perception on Soya Products with Special Reference to T...iosrjce
 
A Study Factors Influence on Organisation Citizenship Behaviour in Corporate ...
A Study Factors Influence on Organisation Citizenship Behaviour in Corporate ...A Study Factors Influence on Organisation Citizenship Behaviour in Corporate ...
A Study Factors Influence on Organisation Citizenship Behaviour in Corporate ...iosrjce
 
Consumers’ Behaviour on Sony Xperia: A Case Study on Bangladesh
Consumers’ Behaviour on Sony Xperia: A Case Study on BangladeshConsumers’ Behaviour on Sony Xperia: A Case Study on Bangladesh
Consumers’ Behaviour on Sony Xperia: A Case Study on Bangladeshiosrjce
 
Design of a Balanced Scorecard on Nonprofit Organizations (Study on Yayasan P...
Design of a Balanced Scorecard on Nonprofit Organizations (Study on Yayasan P...Design of a Balanced Scorecard on Nonprofit Organizations (Study on Yayasan P...
Design of a Balanced Scorecard on Nonprofit Organizations (Study on Yayasan P...iosrjce
 
Public Sector Reforms and Outsourcing Services in Nigeria: An Empirical Evalu...
Public Sector Reforms and Outsourcing Services in Nigeria: An Empirical Evalu...Public Sector Reforms and Outsourcing Services in Nigeria: An Empirical Evalu...
Public Sector Reforms and Outsourcing Services in Nigeria: An Empirical Evalu...iosrjce
 
Media Innovations and its Impact on Brand awareness & Consideration
Media Innovations and its Impact on Brand awareness & ConsiderationMedia Innovations and its Impact on Brand awareness & Consideration
Media Innovations and its Impact on Brand awareness & Considerationiosrjce
 
Customer experience in supermarkets and hypermarkets – A comparative study
Customer experience in supermarkets and hypermarkets – A comparative studyCustomer experience in supermarkets and hypermarkets – A comparative study
Customer experience in supermarkets and hypermarkets – A comparative studyiosrjce
 
Social Media and Small Businesses: A Combinational Strategic Approach under t...
Social Media and Small Businesses: A Combinational Strategic Approach under t...Social Media and Small Businesses: A Combinational Strategic Approach under t...
Social Media and Small Businesses: A Combinational Strategic Approach under t...iosrjce
 
Secretarial Performance and the Gender Question (A Study of Selected Tertiary...
Secretarial Performance and the Gender Question (A Study of Selected Tertiary...Secretarial Performance and the Gender Question (A Study of Selected Tertiary...
Secretarial Performance and the Gender Question (A Study of Selected Tertiary...iosrjce
 
Implementation of Quality Management principles at Zimbabwe Open University (...
Implementation of Quality Management principles at Zimbabwe Open University (...Implementation of Quality Management principles at Zimbabwe Open University (...
Implementation of Quality Management principles at Zimbabwe Open University (...iosrjce
 
Organizational Conflicts Management In Selected Organizaions In Lagos State, ...
Organizational Conflicts Management In Selected Organizaions In Lagos State, ...Organizational Conflicts Management In Selected Organizaions In Lagos State, ...
Organizational Conflicts Management In Selected Organizaions In Lagos State, ...iosrjce
 

More from iosrjce (20)

An Examination of Effectuation Dimension as Financing Practice of Small and M...
An Examination of Effectuation Dimension as Financing Practice of Small and M...An Examination of Effectuation Dimension as Financing Practice of Small and M...
An Examination of Effectuation Dimension as Financing Practice of Small and M...
 
Does Goods and Services Tax (GST) Leads to Indian Economic Development?
Does Goods and Services Tax (GST) Leads to Indian Economic Development?Does Goods and Services Tax (GST) Leads to Indian Economic Development?
Does Goods and Services Tax (GST) Leads to Indian Economic Development?
 
Childhood Factors that influence success in later life
Childhood Factors that influence success in later lifeChildhood Factors that influence success in later life
Childhood Factors that influence success in later life
 
Emotional Intelligence and Work Performance Relationship: A Study on Sales Pe...
Emotional Intelligence and Work Performance Relationship: A Study on Sales Pe...Emotional Intelligence and Work Performance Relationship: A Study on Sales Pe...
Emotional Intelligence and Work Performance Relationship: A Study on Sales Pe...
 
Customer’s Acceptance of Internet Banking in Dubai
Customer’s Acceptance of Internet Banking in DubaiCustomer’s Acceptance of Internet Banking in Dubai
Customer’s Acceptance of Internet Banking in Dubai
 
A Study of Employee Satisfaction relating to Job Security & Working Hours amo...
A Study of Employee Satisfaction relating to Job Security & Working Hours amo...A Study of Employee Satisfaction relating to Job Security & Working Hours amo...
A Study of Employee Satisfaction relating to Job Security & Working Hours amo...
 
Consumer Perspectives on Brand Preference: A Choice Based Model Approach
Consumer Perspectives on Brand Preference: A Choice Based Model ApproachConsumer Perspectives on Brand Preference: A Choice Based Model Approach
Consumer Perspectives on Brand Preference: A Choice Based Model Approach
 
Student`S Approach towards Social Network Sites
Student`S Approach towards Social Network SitesStudent`S Approach towards Social Network Sites
Student`S Approach towards Social Network Sites
 
Broadcast Management in Nigeria: The systems approach as an imperative
Broadcast Management in Nigeria: The systems approach as an imperativeBroadcast Management in Nigeria: The systems approach as an imperative
Broadcast Management in Nigeria: The systems approach as an imperative
 
A Study on Retailer’s Perception on Soya Products with Special Reference to T...
A Study on Retailer’s Perception on Soya Products with Special Reference to T...A Study on Retailer’s Perception on Soya Products with Special Reference to T...
A Study on Retailer’s Perception on Soya Products with Special Reference to T...
 
A Study Factors Influence on Organisation Citizenship Behaviour in Corporate ...
A Study Factors Influence on Organisation Citizenship Behaviour in Corporate ...A Study Factors Influence on Organisation Citizenship Behaviour in Corporate ...
A Study Factors Influence on Organisation Citizenship Behaviour in Corporate ...
 
Consumers’ Behaviour on Sony Xperia: A Case Study on Bangladesh
Consumers’ Behaviour on Sony Xperia: A Case Study on BangladeshConsumers’ Behaviour on Sony Xperia: A Case Study on Bangladesh
Consumers’ Behaviour on Sony Xperia: A Case Study on Bangladesh
 
Design of a Balanced Scorecard on Nonprofit Organizations (Study on Yayasan P...
Design of a Balanced Scorecard on Nonprofit Organizations (Study on Yayasan P...Design of a Balanced Scorecard on Nonprofit Organizations (Study on Yayasan P...
Design of a Balanced Scorecard on Nonprofit Organizations (Study on Yayasan P...
 
Public Sector Reforms and Outsourcing Services in Nigeria: An Empirical Evalu...
Public Sector Reforms and Outsourcing Services in Nigeria: An Empirical Evalu...Public Sector Reforms and Outsourcing Services in Nigeria: An Empirical Evalu...
Public Sector Reforms and Outsourcing Services in Nigeria: An Empirical Evalu...
 
Media Innovations and its Impact on Brand awareness & Consideration
Media Innovations and its Impact on Brand awareness & ConsiderationMedia Innovations and its Impact on Brand awareness & Consideration
Media Innovations and its Impact on Brand awareness & Consideration
 
Customer experience in supermarkets and hypermarkets – A comparative study
Customer experience in supermarkets and hypermarkets – A comparative studyCustomer experience in supermarkets and hypermarkets – A comparative study
Customer experience in supermarkets and hypermarkets – A comparative study
 
Social Media and Small Businesses: A Combinational Strategic Approach under t...
Social Media and Small Businesses: A Combinational Strategic Approach under t...Social Media and Small Businesses: A Combinational Strategic Approach under t...
Social Media and Small Businesses: A Combinational Strategic Approach under t...
 
Secretarial Performance and the Gender Question (A Study of Selected Tertiary...
Secretarial Performance and the Gender Question (A Study of Selected Tertiary...Secretarial Performance and the Gender Question (A Study of Selected Tertiary...
Secretarial Performance and the Gender Question (A Study of Selected Tertiary...
 
Implementation of Quality Management principles at Zimbabwe Open University (...
Implementation of Quality Management principles at Zimbabwe Open University (...Implementation of Quality Management principles at Zimbabwe Open University (...
Implementation of Quality Management principles at Zimbabwe Open University (...
 
Organizational Conflicts Management In Selected Organizaions In Lagos State, ...
Organizational Conflicts Management In Selected Organizaions In Lagos State, ...Organizational Conflicts Management In Selected Organizaions In Lagos State, ...
Organizational Conflicts Management In Selected Organizaions In Lagos State, ...
 

Recently uploaded

Tenets of Physiocracy History of Economic
Tenets of Physiocracy History of EconomicTenets of Physiocracy History of Economic
Tenets of Physiocracy History of Economiccinemoviesu
 
government_intervention_in_business_ownership[1].pdf
government_intervention_in_business_ownership[1].pdfgovernment_intervention_in_business_ownership[1].pdf
government_intervention_in_business_ownership[1].pdfshaunmashale756
 
Call Girls Near Delhi Pride Hotel, New Delhi|9873777170
Call Girls Near Delhi Pride Hotel, New Delhi|9873777170Call Girls Near Delhi Pride Hotel, New Delhi|9873777170
Call Girls Near Delhi Pride Hotel, New Delhi|9873777170Sonam Pathan
 
NO1 WorldWide Love marriage specialist baba ji Amil Baba Kala ilam powerful v...
NO1 WorldWide Love marriage specialist baba ji Amil Baba Kala ilam powerful v...NO1 WorldWide Love marriage specialist baba ji Amil Baba Kala ilam powerful v...
NO1 WorldWide Love marriage specialist baba ji Amil Baba Kala ilam powerful v...Amil baba
 
Stock Market Brief Deck for "this does not happen often".pdf
Stock Market Brief Deck for "this does not happen often".pdfStock Market Brief Deck for "this does not happen often".pdf
Stock Market Brief Deck for "this does not happen often".pdfMichael Silva
 
fca-bsps-decision-letter-redacted (1).pdf
fca-bsps-decision-letter-redacted (1).pdffca-bsps-decision-letter-redacted (1).pdf
fca-bsps-decision-letter-redacted (1).pdfHenry Tapper
 
SBP-Market-Operations and market managment
SBP-Market-Operations and market managmentSBP-Market-Operations and market managment
SBP-Market-Operations and market managmentfactical
 
project management information system lecture notes
project management information system lecture notesproject management information system lecture notes
project management information system lecture notesongomchris
 
Bladex 1Q24 Earning Results Presentation
Bladex 1Q24 Earning Results PresentationBladex 1Q24 Earning Results Presentation
Bladex 1Q24 Earning Results PresentationBladex
 
Call Girls Near Golden Tulip Essential Hotel, New Delhi 9873777170
Call Girls Near Golden Tulip Essential Hotel, New Delhi 9873777170Call Girls Near Golden Tulip Essential Hotel, New Delhi 9873777170
Call Girls Near Golden Tulip Essential Hotel, New Delhi 9873777170Sonam Pathan
 
BPPG response - Options for Defined Benefit schemes - 19Apr24.pdf
BPPG response - Options for Defined Benefit schemes - 19Apr24.pdfBPPG response - Options for Defined Benefit schemes - 19Apr24.pdf
BPPG response - Options for Defined Benefit schemes - 19Apr24.pdfHenry Tapper
 
Economic Risk Factor Update: April 2024 [SlideShare]
Economic Risk Factor Update: April 2024 [SlideShare]Economic Risk Factor Update: April 2024 [SlideShare]
Economic Risk Factor Update: April 2024 [SlideShare]Commonwealth
 
Managing Finances in a Small Business (yes).pdf
Managing Finances  in a Small Business (yes).pdfManaging Finances  in a Small Business (yes).pdf
Managing Finances in a Small Business (yes).pdfmar yame
 
(办理学位证)加拿大萨省大学毕业证成绩单原版一比一
(办理学位证)加拿大萨省大学毕业证成绩单原版一比一(办理学位证)加拿大萨省大学毕业证成绩单原版一比一
(办理学位证)加拿大萨省大学毕业证成绩单原版一比一S SDS
 
原版1:1复刻堪萨斯大学毕业证KU毕业证留信学历认证
原版1:1复刻堪萨斯大学毕业证KU毕业证留信学历认证原版1:1复刻堪萨斯大学毕业证KU毕业证留信学历认证
原版1:1复刻堪萨斯大学毕业证KU毕业证留信学历认证jdkhjh
 
letter-from-the-chair-to-the-fca-relating-to-british-steel-pensions-scheme-15...
letter-from-the-chair-to-the-fca-relating-to-british-steel-pensions-scheme-15...letter-from-the-chair-to-the-fca-relating-to-british-steel-pensions-scheme-15...
letter-from-the-chair-to-the-fca-relating-to-british-steel-pensions-scheme-15...Henry Tapper
 
PMFBY , Pradhan Mantri Fasal bima yojna
PMFBY , Pradhan Mantri  Fasal bima yojnaPMFBY , Pradhan Mantri  Fasal bima yojna
PMFBY , Pradhan Mantri Fasal bima yojnaDharmendra Kumar
 
Financial analysis on Risk and Return.ppt
Financial analysis on Risk and Return.pptFinancial analysis on Risk and Return.ppt
Financial analysis on Risk and Return.ppttadegebreyesus
 
原版1:1复刻温哥华岛大学毕业证Vancouver毕业证留信学历认证
原版1:1复刻温哥华岛大学毕业证Vancouver毕业证留信学历认证原版1:1复刻温哥华岛大学毕业证Vancouver毕业证留信学历认证
原版1:1复刻温哥华岛大学毕业证Vancouver毕业证留信学历认证rjrjkk
 
The Triple Threat | Article on Global Resession | Harsh Kumar
The Triple Threat | Article on Global Resession | Harsh KumarThe Triple Threat | Article on Global Resession | Harsh Kumar
The Triple Threat | Article on Global Resession | Harsh KumarHarsh Kumar
 

Recently uploaded (20)

Tenets of Physiocracy History of Economic
Tenets of Physiocracy History of EconomicTenets of Physiocracy History of Economic
Tenets of Physiocracy History of Economic
 
government_intervention_in_business_ownership[1].pdf
government_intervention_in_business_ownership[1].pdfgovernment_intervention_in_business_ownership[1].pdf
government_intervention_in_business_ownership[1].pdf
 
Call Girls Near Delhi Pride Hotel, New Delhi|9873777170
Call Girls Near Delhi Pride Hotel, New Delhi|9873777170Call Girls Near Delhi Pride Hotel, New Delhi|9873777170
Call Girls Near Delhi Pride Hotel, New Delhi|9873777170
 
NO1 WorldWide Love marriage specialist baba ji Amil Baba Kala ilam powerful v...
NO1 WorldWide Love marriage specialist baba ji Amil Baba Kala ilam powerful v...NO1 WorldWide Love marriage specialist baba ji Amil Baba Kala ilam powerful v...
NO1 WorldWide Love marriage specialist baba ji Amil Baba Kala ilam powerful v...
 
Stock Market Brief Deck for "this does not happen often".pdf
Stock Market Brief Deck for "this does not happen often".pdfStock Market Brief Deck for "this does not happen often".pdf
Stock Market Brief Deck for "this does not happen often".pdf
 
fca-bsps-decision-letter-redacted (1).pdf
fca-bsps-decision-letter-redacted (1).pdffca-bsps-decision-letter-redacted (1).pdf
fca-bsps-decision-letter-redacted (1).pdf
 
SBP-Market-Operations and market managment
SBP-Market-Operations and market managmentSBP-Market-Operations and market managment
SBP-Market-Operations and market managment
 
project management information system lecture notes
project management information system lecture notesproject management information system lecture notes
project management information system lecture notes
 
Bladex 1Q24 Earning Results Presentation
Bladex 1Q24 Earning Results PresentationBladex 1Q24 Earning Results Presentation
Bladex 1Q24 Earning Results Presentation
 
Call Girls Near Golden Tulip Essential Hotel, New Delhi 9873777170
Call Girls Near Golden Tulip Essential Hotel, New Delhi 9873777170Call Girls Near Golden Tulip Essential Hotel, New Delhi 9873777170
Call Girls Near Golden Tulip Essential Hotel, New Delhi 9873777170
 
BPPG response - Options for Defined Benefit schemes - 19Apr24.pdf
BPPG response - Options for Defined Benefit schemes - 19Apr24.pdfBPPG response - Options for Defined Benefit schemes - 19Apr24.pdf
BPPG response - Options for Defined Benefit schemes - 19Apr24.pdf
 
Economic Risk Factor Update: April 2024 [SlideShare]
Economic Risk Factor Update: April 2024 [SlideShare]Economic Risk Factor Update: April 2024 [SlideShare]
Economic Risk Factor Update: April 2024 [SlideShare]
 
Managing Finances in a Small Business (yes).pdf
Managing Finances  in a Small Business (yes).pdfManaging Finances  in a Small Business (yes).pdf
Managing Finances in a Small Business (yes).pdf
 
(办理学位证)加拿大萨省大学毕业证成绩单原版一比一
(办理学位证)加拿大萨省大学毕业证成绩单原版一比一(办理学位证)加拿大萨省大学毕业证成绩单原版一比一
(办理学位证)加拿大萨省大学毕业证成绩单原版一比一
 
原版1:1复刻堪萨斯大学毕业证KU毕业证留信学历认证
原版1:1复刻堪萨斯大学毕业证KU毕业证留信学历认证原版1:1复刻堪萨斯大学毕业证KU毕业证留信学历认证
原版1:1复刻堪萨斯大学毕业证KU毕业证留信学历认证
 
letter-from-the-chair-to-the-fca-relating-to-british-steel-pensions-scheme-15...
letter-from-the-chair-to-the-fca-relating-to-british-steel-pensions-scheme-15...letter-from-the-chair-to-the-fca-relating-to-british-steel-pensions-scheme-15...
letter-from-the-chair-to-the-fca-relating-to-british-steel-pensions-scheme-15...
 
PMFBY , Pradhan Mantri Fasal bima yojna
PMFBY , Pradhan Mantri  Fasal bima yojnaPMFBY , Pradhan Mantri  Fasal bima yojna
PMFBY , Pradhan Mantri Fasal bima yojna
 
Financial analysis on Risk and Return.ppt
Financial analysis on Risk and Return.pptFinancial analysis on Risk and Return.ppt
Financial analysis on Risk and Return.ppt
 
原版1:1复刻温哥华岛大学毕业证Vancouver毕业证留信学历认证
原版1:1复刻温哥华岛大学毕业证Vancouver毕业证留信学历认证原版1:1复刻温哥华岛大学毕业证Vancouver毕业证留信学历认证
原版1:1复刻温哥华岛大学毕业证Vancouver毕业证留信学历认证
 
The Triple Threat | Article on Global Resession | Harsh Kumar
The Triple Threat | Article on Global Resession | Harsh KumarThe Triple Threat | Article on Global Resession | Harsh Kumar
The Triple Threat | Article on Global Resession | Harsh Kumar
 

Primary Education in Andhra Pradesh

  • 1. IOSR Journal of Economics and Finance (IOSR-JEF) e-ISSN: 2321-5933, p-ISSN: 2321-5925.Volume 6, Issue 6. Ver. I (Nov. - Dec. 2015), PP 26-31 www.iosrjournals.org DOI: 10.9790/5933-06612631 www.iosrjournals.org 26 | Page Primary Education in Andhra Pradesh V.Jagannathan Lecture in Economics, P.S.Govt.degree College Penukonda- Ananatapuramu District A.P Abstract: Education is the most important element of growth and prosperity of a nation. India is in the process of transforming itself into a developed nation by 2020. Yet we have 350 million people who need literacy and many more who have to acquire employment skills to suit the emerging modern India and globe. Children who belong to weaker sections of our society are undernourished and only a small percentage of them managed to complete eight years of satisfactory education. We need to think specially for them. Primary education is the foundation on which the development of every citizen and the nation as a whole built on. In recent past, India has made a huge progress in terms of increasing primary education enrolment, retention, regular attendance rate and expanding literacy to approximately two third of the population. India’s improved education system is often cited as one of the main contributors to the economic development of India. At the same time, the quality of elementary education in India had also been a major concern. Key words: Primary schools, Infrastructure facilities, Enrolment, Student –teacher ratios, Dropout rates and Expenditure on education. I. Introduction Primary education is the foundation on which the development of every citizen and the nation as a whole built on. In recent past, India has made a huge progress in terms of increasing primary education enrolment, retention, regular attendance rate and expanding literacy to approximately two third of the population. India’s improved education system is often cited as one of the main contributors to the economic development of India. At the same time, the quality of elementary education in India had also been a major concern. Free and compulsory education to all children up to the age fourteen is constitutional commitment in India. The parliament of India has recently passed Right to Education Act through which education has become fundamental right of all children of age group 6-14 years. The country is yet to achieve the elusive goal of universalization of Elementary Education (UEE), which means 100 percent enrolment and retention of children with schooling facilities in all habitations. It is to fill this gap that the government has launched the Sarva Shiksha Abhiyan in 2001, one of the largest such programs in the world. It is the education that it would accelerate economic growth, that it would improve the levels of living of the people and that it would encourage modern attitudes. Education is also recognized as a basic input for empowerment to individual and overall development of the society. Almost all third world nations believe that it is the rapid expansion of educational opportunities that holds the basic key for national development. Despite its importance, education continues to be a neglected area at the policy level .after many years of planning and promises total literacy in India remains to be a distant dream. The literacy rate for the country as a whole in 2001 worked out to 65.38 percent for the population aged seven years and above. The corresponding figures for males and females are 75.85 and 54.16 percent respectively. Kerala with a literacy rate of 90.92 per cent holds the first rank while Bihar with a literacy rate 47.53 percent ranks last in the country. In 2001 the overall literacy rate in Andhra Pradesh stood at 61 percent. This paper makes an attempt to analyze the performance of primary education in Andhra Pradesh in terms of number of schools, infrastructure facilities, enrolment, dropout rates, student teacher ratios and expenditure on primary education. Here primary education .here primary education covers up to class V in Andhra Pradesh .this study mainly relies on secondary data .it also makes use of the data relating to upper primary schools, high schools and all India statistics for the purpose of comparative analysis. Primary schools Large number of primary schools is necessary to meet the demand and to achieve the objective of total literacy. Table 1 shows the progress of primary schools between 1986 and 2005 in Andhra Pradesh. The total number of schools increased from 44,346 in 1986 to 63,362 in 2002 and again declined to 6, 51,680 in 2005, than by 2013 it become 1,22,441. The data presented in table 1 clearly reveals that as high as 91.55 percent of primary schools are being managed by local bodies like mandal praja parishats, Zilla praja parishats and municipalities. But the percentage of schools managed by local bodies declined from 91.55 in 1986 to 80.35 in 2005 later it increasing in positive manner. The share of private aided schools in total schools is not significant.
  • 2. Primary Education in Andhra Pradesh DOI: 10.9790/5933-06612631 www.iosrjournals.org 27 | Page While the percentage of government schools increased from 2.55 in 1986 to 8.24 in 2005 and 46.48 by 2013. In absolute terms the number of government schools rose from 1,131 to 5,085 in 2005 than 56.922 by 2013 during the same period it is also interesting to note that the number of private unaided schools rose significantly from 643 (1.45%) in 1986 to 4,756 (7.71%) in 2005 than 10,385 by 2013. Table-1 Primary schools by management Management 1986 2002 2005 2013 Government 1,131 (2.55) 5,666 (8.94) 5,085 (8.24) 56,922 (46.48) Local bodies 40,599 (91.55) 51,268 (80.91) 49,559 (80.35) 52,150 (42.60) Private aided 1,973 (4.45) 2,265 (3.57) 2,280 (3.70) 2,984 (2.43) Private unaided 643 (1.45) 4,163 (6.57) 4,756 (7.71) 10,385 (8.49) Total 44,346 (100.00) 63,362 (100.00) 61,680 (100.00) 1,22,441 (100.00) Source: 1. Fifth all India educational survey, NCERT, New Delhi, 2. Statistical abstracts, directorate of economics and statistics, government of AP. Infrastructure facilities Availability of teachers and infrastructure facilities in schools is necessary to provide quality education. Table 2 shows the schools having basic infrastructure facilities for different years. These basic facilities include permanent building, black- board, drinking water, toilets, library, playground and electricity. As high as eighty per cent of the primary schools have pucca buildings but nearly half of the schools have single rooms and about 31 percent of the schools are single teacher schools. It is also evident that the percentage of schools without important infrastructure facilities increased over a period of time. However there are schools without important infrastructure facilities. About 30 percent of schools do not have drinking water by 2005 later increased up to 72 per cent by 2013, nearly 74 percent of schools do not have separate toilets for girls and 58 percent of schools are not having toilets. Only 57 percent of schools have facility and more than forty percent of schools do not have playground facility. As high as 76 per cent of schools do not have electricity facility. Unless these basic facilities are improved in all primary schools we cannot expect teachers to succeed in accomplishing even the more modest aims of primary education. In a highly completive world all schools must have good infrastructure facilities. Otherwise they cannot attract more students and the objective of universalization of elementary education cannot be achieved. Table- 2 Basic facilities in primary schools Facility Percentage of schools having 1979 1986 2005 2013 Pucca building 45.00 67.30 76.27 79.89 Drinking water 41.00 42.50 65.14 71.93 Toilet 5.00 10.80 42.27 73.64 Girls toilet -- 2.10 25.90 72.63 Library 34.00 -- 50.06 54.36 Play ground 51.00 54.92 46.72 57.45 Electricity -- -- 15.72 76.48 Boundary wall -- -- 45.53 69.58 Source: 1. Fourth & fifth all India educational survey, NCERT, New Delhi, 1978-79&1992. 2. Elementary education in India, NIEPA department of elementary Education and literacy, government of India, 2006. Enrolment Accessibility of schooling facilities is no longer a major problem. As shown in table 3 the number of schools in Andhra Pradesh increased from 29,076 in 1956-57 to 70,620 in 2012-13 registering a 4.10 fold increase. Out of total primary schools 70,620 (99.11%) are for boys and 562 (0.82%) for girls, the number of children enrolled in classes I-V rose significantly from 24.54 lakh to 74.40 lakh during the same period. The rate of enrolment also improved from 57.94 percent in 1956-57 to 107.02 percent in 2012-13. Gender wise enrolment ratios for classes’ I-V are calculated separately to know the differences in the enrolment ratios of
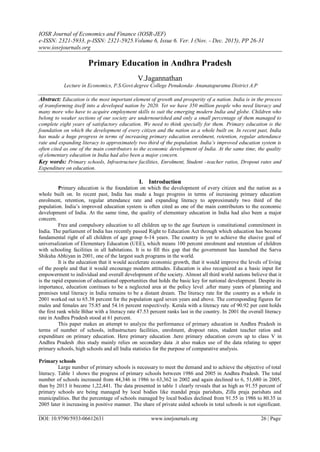
  • 3. Primary Education in Andhra Pradesh DOI: 10.9790/5933-06612631 www.iosrjournals.org 28 | Page boys increased from 86.2 to 118.07 while the enrolment ratio rose from 57.94 to 107.02 during the same period. In 1990 and 2000 the enrolment ratio of girls was less than that of boys. Table -3 Growth of primary education in Andhra Pradesh. year No of schools No. of children Enrolled In (lakhs) Rate of enrolment (in %) No of children Per school. 1956-57 29,076 24.54 57.94 84 1960-61 34,040 29.76 68.25 87 1965-66 37,320 37.69 76.61 100 1973-74 36,984 40.40 64.55 109 1977-78 38,836 46.76 70.55 120 1981-82 40,691 54.66 85.00 134 1984-85 41,702 64.12 89.10 153 1989-90 49,000 69.21 88.52 141 1995-96 49,125 76.40 94.92 155 2002-03 63,362 63.51 117.74 100 2004-05 61,680 55.24 109.88 90 2011-12 55,570 53.09 101.28 84 2012-13 70,620 74.40 107.02 101 Source: 1. Andhra Pradesh at 50: a data based analysis, data news features, Hyderabad, 1998. 2. Statistical abstracts, directorate of economics and statistics, government of AP. But in 2012-13 the enrolment ratios of boys and girls are more or less equal to each other and they are greater than 100 percent. It is due to the inclusion of under age and over age children, here enrolment is simply the percentage of enrolment in classes I – V to the estimated child population in the age group of 6-10 years. It is observed that there is no steady growth in the average number of children enrolled in each school. The average number of children per school varied from 84 in 1956-57 to 155 1995-96 than 101 in 2012-13. In 2012- 13 the average number of children per school is 101. This implies the fact that on an average there are only 20 students I each class. Student –teacher ratios The number of teachers in the primary schools of Andhra Pradesh increased from 78,521 in 1960-61 to 1, 66,935 in 2004-05 than decreased slightly to 1, 04,772 by 2013. At the same time the percentage of women teachers also rose from 18.62 to 48.02 during the same period. One of the important indicators that influence classroom transaction is the student –teacher ratio which is presented by region in table 4. Student –ratio rose from 27.5 in 1981 to 51.9 in 1991. Afterwards the student –teacher ratio in the state as a whole started declining and reached to 31.1 in 2005 than 32.7 by 2013. Among the three regions the student-teacher ratio in 2013 ranged between 32.7 in coastal Andhra and 31.5 in Telangana. This indicates that the regional disparities in student –teacher ratios have narrowed down over a period from 1991 to 2013. The heaviest pupil –teacher ratio in primary schools is observed in Bihar (76.1), followed by Uttar Pradesh (74.1),Jharkhand(54.1) and west Bengal(50.1) .while the lowest pupil –teacher ratio is found in Sikkim (10.1), Jammu &Kashmir and Nagaland each with 15:1 (Arum C. Mehta, 2012-13). Table- 4 Student teacher ratios in primary schools Region 1981 1991 2001 2005 2013 Coastal Andhra 27.5 51.9 44.0 31.1 32.7 Rayalaseema 33.4 49.7 46.6 30.6 34.4 Telangana 23.0 48.5 50.6 35.9 31.5 Andhra Pradesh 27.5 51.9 46.5 33.1 29.5 Source: 1. Census and department of Education, Government of AP. 2. Statistical abstracts, directorate of economics and statistics, government of AP.
  • 4. Primary Education in Andhra Pradesh DOI: 10.9790/5933-06612631 www.iosrjournals.org 29 | Page Figure 1 Student teacher ratios in primary schools Dropout rates The ratios of students going out of the school system to the enrolment in class I in the base year is termed as dropout rate. Dropout rates in classes I-V,I-VII and I-X are shown in table 5. In Andhra Pradesh the dropout rate in classes’ I-V was recorded at 31.95 percent in 2004-05 and declined to 16.17 by 2013. It is observed that the differences in the dropout rates of boys and girls declined. For instance in 2012-13 the dropout rated of boys and girls were recorded at 16.69 percent and 15.62 percent respectively. In 2012-13 the dropout rates in classes I –VII and I-X were recorded at 26.83 percent and 31.95 percent respectively. It means only 32 percent of the total students enrolled in class I reached class X. the dropout rate of girls in classes’ I-VII and I-X is high compared to that of boys. The dropout rates of both boys and girls are increasing from primary to upper primary and to high school. Table-5 Dropout rates in Andhra Pradesh Classes 2002-03 2004-05 2013 Boys Girls Total Boys Girls Total Boys Girls Total I-V 33.74 30.91 32.39 31.77 32.14 31.95 16.69 15.62 16.17 I-VII 49.93 53.22 51.52 51.96 54.46 53.17 27.24 26.41 26.83 I-X 67.46 71.02 69.12 62.30 65.24 63.69 28.36 45.24 31.95 Source: 1. statistical Abstracts, Directorate of Economics and Statistics, Government of AP. Figure 2 Dropout rates in Andhra Pradesh
  • 5. Primary Education in Andhra Pradesh DOI: 10.9790/5933-06612631 www.iosrjournals.org 30 | Page District wise data for 2012-13 reveals that the dropout rates in classes I-V are very high in Mahaboob Nagar district (49.02%) followed by Medak district (52.34 %) and Warangal district (52.13). while the dropout rates in Classes I-V are very low in Kadapa district (8.34%) followed by Hyderabad district (8.53%) and Chittor district (9.71 percent). gender wise dropout rates are also high in the districts of Mahaboob Nagar, Medak and Warangal. Expenditure on education: The analysis of public expenditure and financial resources is recognized as an important variable in understanding the status of education only recently after the 1990 conference in jominten, South Africa and the revised national policy on education in 1992. Table 6 shows the trends in the expenditure on education in Andhra Pradesh. Of the total expenditure on education the percentage share of primary education are below the requirements (above 60 percent). The ratio of total expenditure on education to G.S.D.P. remains more or less at three percent. (V. Ratna Reddy & R. Nageswara Rao, 2012) therefore the investment in education needs to be increased and a greater allocation to primary education is necessary if every child is to be got into school. Table-6 Trends in the expenditure on education Year Expenditure on education As % to GSDP Percentage share of primary education 1980-81 2.9 44 1985-86 3.3 46 1990-91 2.8 46 1995-96 2.4 55 1996-97 2.6 54 1997-98 2.7 53 1998-99 2.9 56 1999-00 3.1 57 2000-01 3.3 51 2001-02 3.2 53 2002-03 3.9 48 2003-04 3.4 54 2010-11 4.8 52 2012-13 4.4 50 Source: 1.Andhra Pradesh Development, Centre for Economic and Social Studies, Hyderabad, 2003.
  • 6. Primary Education in Andhra Pradesh DOI: 10.9790/5933-06612631 www.iosrjournals.org 31 | Page Figure 3 Trends in the expenditure in Education Summary The numbers of primary schools in Andhra Pradesh rose significantly from 29,076 in 1956-57 to 61689 in 2004-05 than 70,620 by 2013 majority of the primary schools (70.30%) are managed by local bodies, it is evident that the percentage share of private schools had shown increasing trend from 1.45 in 1986 to 7.75 in 2005 and 8.51 by 2013. The study clearly reveals that many schools do not have basic facilities like drinking water, toilets, library, playground, electricity etc. it is quite impressive to note that the enrolment ratio exceeded 100 percent and recorded at 07 percent in 2013. Not only that the gap between the enrolment ratios of boys and girls declined substantly over a period of time. It is also observed that the number of schools established for girls is only 487 which account for 0.72 percent of total primary schools in Andhra Pradesh. As far as student – teacher ratio is concerned Andhra Pradesh is in better position. Because the student –teacher ratio declined from 51.9 in 1991 to 33.1 in 2005 and 31.2 by 2013. Region wise statistics reveal that the student –teacher ratio in 2001 was low in coastal Andhra compared to that of Telangana and Rayalaseema regions. The gap between the dropouts’ rates of boys and girls narrowed down considerably. But the dropout rates of both boys and girls are very high in classes’ I-VII and I-X. for instance in 2012-13 the dropout rates of boys and girls in I-VII were recorded at 26.41 to 26.83 45.24 respectively, similarly in classes I-X the dropout rates of boys and girls were recorded at 45.24 to 31.95 respectively .it is also found that there are some districts like Kadapa, Hyderabad and chitter where the dropout rates in classes I-V are very low and ranged between 8.34 and 9.71 percent, it is observed that the share of primary education in total expenditure from 44 percent 1980-81 to 57 percent in 2000 than declined to 50 per cent by 2013. But the expenditure on education as per cent to GSDP of AP. Remained more or less around 4 percent. It implies the fact the education was not given much importance. Suggestions Since majority of the primary schools are not having the basic facilities there is dire need for providing infrastructure facilities in all schools. Despite several efforts the dropouts continue. This must be checked by implementing the existing programs effectively and by encouraging the parents who lack motivation and capacity to send their children to school regularly. As the primary education is the base for higher education and achieving total literacy its performance must be improved. The retention at primary level is the main concern. Economy should be addressing the problems of disadvantage groups. Financial allocations for education are to be increased to solve its problems and to improve the performance of primary education. Otherwise the performance of primary education may not be up to our expectations. References [1]. Aruna, R. (1999), “learn thoroughly: primary schooling in Tamilnadu , economic and political weekly , vol. 34, No. 18. [2]. Chalam,K.S.(1998), “Education “, in V.Hanumantha Rao rt.al (ed), Andhra Pradesh at 50: a data based analysis , Hyderabad: data news features. [3]. Kaul, Rekha (2001), “assessing primary education –going beyond the classroom”, economic and political weekly , vol. XXXVI, no. 2 p. 13-19, January. [4]. Ratna Reddy , V and R.nageswara Rao, (2003),”primary education: causes and constrains”, in C.H. Hanumantha Rao and S.Mahendra Dev (ed) Andhra Pradesh development , centre for economic and social studies , Hyderabad. [5]. Sheriff, A. and P.K.Gosh (2000), “Indian education scene and public expenditure gap “, economic and political weekly, April 15, P. 1396-1406. 2.9 3.3 2.8 2.4 2.6 2.7 2.9 3.1 3.3 3.2 3.9 3.4 4.8 4.4 44 46 46 55 54 53 56 57 51 53 48 54 52 50 Percentage Acadamic years Trends in the expenditure in Education Expenditure on education As % to GSDP Percentage share of primary education