
Recomendados
Más contenido relacionado
La actualidad más candente
La actualidad más candente (19)
Destacado
Similar a Supplemental Data – Q2 2014 Earnings Call
Similar a Supplemental Data – Q2 2014 Earnings Call (20)
Más de irneenahpaperinc
Más de irneenahpaperinc (16)
Último
Último (20)
Supplemental Data – Q2 2014 Earnings Call
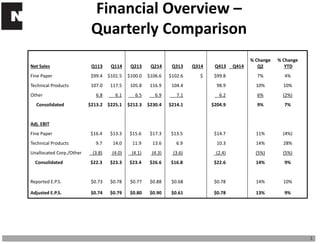
- 1. 1 Net Sales Q113 Q114 Q213 Q214 Q313 Q314 Q413 Q414 % Change Q2 % Change YTD Fine Paper $99.4 $101.5 $100.0 $106.6 $102.6 $ $99.8 7% 4% Technical Products 107.0 117.5 105.8 116.9 104.4 98.9 10% 10% Other 6.8 6.1 6.5 6.9 7.1 6.2 6% (2%) Consolidated $213.2 $225.1 $212.3 $230.4 $214.1 $204.9 9% 7% Adj. EBIT Fine Paper $16.4 $13.3 $15.6 $17.3 $13.5 $14.7 11% (4%) Technical Products 9.7 14.0 11.9 13.6 6.9 10.3 14% 28% Unallocated Corp./Other (3.8) (4.0) (4.1) (4.3) (3.6) (2.4) (5%) (5%) Consolidated $22.3 $23.3 $23.4 $26.6 $16.8 $22.6 14% 9% Reported E.P.S. $0.73 $0.78 $0.77 $0.88 $0.68 $0.78 14% 10% Adjusted E.P.S. $0.74 $0.79 $0.80 $0.90 $0.61 $0.78 13% 9% Financial Overview – Quarterly Comparison
- 2. $45.7 $4.5 $3.9 $1.1 $0.2 ($4.6) ($0.9) $49.9 2013 Volume Price/ Mix SG&A/ Other Mfg Energy Other Input Costs 2014 2 YTD EBIT growth driven by increased volumes, price and cost performance Input costs higher primarily due to Q1 spike in US energy prices Change in Adjusted EBIT Profit increase led by strong topline performance across all businesses $23.4 $3.4 $2.2 ($0.9) ($0.7) ($0.7) ($0.1) $26.6 2013 Volume Price/ Mix Mfg SG&A/ Other Energy Other Input Costs 2014 Q2 YTD
- 3. Net Sales 2010 2011 2012 2013 LTM Q2-14 2010-2014 CAGR Fine Paper $273.4 $274.9 $372.7 $401.8 $410.5 11% Technical Products 384.3 421.1 406.6 416.1 437.7 3% Other 0.0 0.0 29.5 26.6 26.3 NM Consolidated $657.7 $696.0 $808.8 $844.5 $874.5 7% Adj. EBIT Fine Paper $37.1 $39.7 $55.8 $60.2 $58.8 12% Technical Products 29.2 33.8 37.6 38.8 44.8 11% Unallocated Corp./Other (14.6) (14.5) (13.1) (13.9) (14.3) NM Consolidated $51.7 $59.0 $80.3 $85.1 $89.3 15% Reported E.P.S. $1.61 $1.82 $2.41 $2.96 $3.12 18% Adjusted E.P.S. $1.47 $1.91 $2.78 $2.93 $3.08 20% Financial Overview – Annual Trends 3
- 4. External Information Q1 Q2 Q3 Q4 Average 2010 1.39 1.28 1.29 1.36 1.33 2011 1.37 1.44 1.42 1.35 1.39 2012 1.31 1.29 1.25 1.30 1.29 2013 1.32 1.31 1.32 1.36 1.33 2014 1.37 1.37 1.37 Q1 Q2 Q3 Q4 Average NBSK 2010 880 993 1,000 967 960 2011 970 1,025 998 917 978 2012 870 900 853 863 872 2013 897 937 947 983 941 2014 1,017 1,030 NBHK 2010 787 947 913 838 871 2011 825 855 828 745 813 2012 720 793 768 753 759 2013 792 853 870 860 844 2014 872 873 Q1 Q2 Q3 Q4 Full Year US 2010 1.6 3.9 2.8 2.8 2.5 2011 (1.3) 3.2 1.4 4.9 1.8 2012 3.7 1.2 2.8 0.1 2.8 2013 1.1 2.5 4.1 2.6 1.9 2014 (2.9) 3.2 1.6 EURO Zone 2010 1.7 3.7 1.4 2.2 1.9 2011 3.7 0.2 0.1 (0.9) 1.7 2012 (0.3) (1.1) (0.6) (2.1) (0.6) 2013 (0.8) 1.3 0.4 1.2 (0.4) 2014 0.8 1.6 1.1 Q1 Q2 Q3 Q4 Full Year 2010 3.4 2.8 (1.3) (3.4) (0.3) 2011 (3.8) (4.9) (2.1) (2.9) (3.4) 2012 (0.9) (5.0) (7.1) (4.4) (4.5) 2013 (7.6) (2.5) 0.3 2.5 (1.9) 2014 (2.9) (3.3) Source: Bank of America Merrill Lynch – July 3, 2014 Source: PPPC UNCOATED WOODFREE PAPERS STATISTICS – June 2014 N.A. Uncoated Free Sheet Market % Change Demand Source: Average (Bank of America/JPMorgan/Goldman Sachs/Commerzbank) – June 2014 4 Source: RISI – July, 2014 % GDP Growth Exchange Rate (EURO/US) Pulp Market List Price $/MT
- 5. Quarterly GAAP Reconciliation Table 5 Continuing Operations $ millions Q113 Q114 Q213 Q214 Q313 Q314 Q413 Q413 GAAP Operating Income $ 22.2 $ 23.0 $ 22.6 $ 25.9 $ 16.4 $ $ 22.6 $ Pension settlement charge - - 0.2 - - - Integration/Restructuring costs 0.1 0.3 0.1 0.7 0.4 - Early extinguishment of debt - - 0.5 - - - Adjusted Operating Income $ 22.3 $ 23.3 $ 23.4 $ 26.6 $ 16.8 $ $ 22.6 $ GAAP Income $ 12.1 $ 13.2 $ 12.8 $ 15.0 $ 11.4 $ $ 13.1 $ Pension settlement charge - - 0.1 - - - Integration/Restructuring costs 0.1 0.2 0.1 0.4 0.2 - Early extinguishment of debt - - 0.3 - - - R&D tax credit - - - - (1.4) - Adjusted Income $ 12.2 $ 13.4 $ 13.3 $15.4 $ 10.2 $ $ 13.1 $ GAAP Earnings per Diluted Common Share $ 0.73 $ 0.78 $ 0.77 $ 0.88 $ 0.68 $ $ 0.78 $ Pension settlement charge - - 0.01 - - - Integration/Restructuring costs 0.01 0.01 - 0.02 0.01 - Early extinguishment of debt - - 0.02 - - - R&D tax credit - - - - (0.08) - Adjusted Earnings per Share $ 0.74 $ 0.79 $ 0.80 $ 0.90 $ 0.61 $ $ 0.78 $
- 6. Annual GAAP Reconciliation Table 6 Continuing Operations $ millions 2010 2011 2012 2013 LTM 2014 GAAP Operating Income $ 55.1 $ 56.6 $ 70.4 $ 83.8 $87.9 Gain on Ripon Sale (3.4) - - - - Pension settlement charge - - 3.5 0.2 - Integration/Restructuring costs - - 5.8 0.6 1.4 Early extinguishment of debt - 2.4 0.6 0.5 - Adjusted Operating Income $ 51.7 $ 59.0 $ 80.3 $ 85.1 $ 89.3 GAAP Income $ 25.0 $ 29.3 $ 39.9 $ 49.4 $ 52.7 Gain on Ripon Sale (2.1) - - - - Pension settlement charge - - 2.2 0.1 - Integration costs - - 3.5 0.4 0.8 Early extinguishment of debt - 1.4 0.4 0.3 - R&D tax credit - - - (1.4) (1.4) Adjusted Income $ 22.9 $ 30.7 $ 46.0 $ 48.8 $ 52.1 GAAP Earnings per Diluted Common Share $ 1.61 $ 1.82 $ 2.41 $ 2.96 $ 3.12 Gain on Ripon Sale (0.14) - - - - Pension settlement charge - - 0.13 0.01 - Integration costs - - 0.22 0.02 0.04 Early extinguishment of debt - 0.09 0.02 0.02 - R&D tax credit - - - (0.08) (0.08) Adjusted Earnings per Share $1.47 $ 1.91 $ 2.78 $ 2.93 $ 3.08