SlideShare a Scribd company logo
1 of 20
Download to read offline
496,800,000   children immunized


266,000,000   people covered by social safety net programs


188,600,000   pregnant women received antenatal care


145,420,000   people gained access to improved water
              sources


124,670,000   children given a dose of vitamin A


 65,790,000   people gained access to basic health services


 34,900,000   insecticide-treated malaria bednets
              distributed


  9,910,000   people benefited from improved sanitation


  4,140,000   teachers recruited and/or trained


  2,660,000   health personnel received training


  1,960,000   additional households connected to piped
              water services


    330,000   improved community water points
              constructed or rehabilitated


    180,000   kilometers of roads built or rehabilitated


Annual Report 2012
Annual Report 2012
The World Bank is committed to achieving
and communicating results.
In its ongoing dedication to overcoming poverty and creating
opportunity for people in developing countries, the Bank is making
progress both internally and in the field, and it continues to improve
the way it serves its client countries. This year the Annual Report
showcases the World Bank Corporate Scorecard, which includes
a snapshot of country results achieved by partner countries with
support from the Bank. As we are fast approaching 2015, the target
year for reaching the Millennium Development Goals (MDGs), the
inclusion of results indicators this year is particularly relevant.

On the cover of this report, you will see some results that our partner
countries achieved through Bank-supported projects around the
world. These results, accomplished mostly over the past decade,
illustrate the efforts of the International Bank for Reconstruction and
Development (IBRD) and the International Development Association
(IDA), which together comprise the World Bank.

We encourage you to read the chapters on the enclosed CD-ROM to
learn more about the World Bank’s work; its activities and outcomes
in the six regions; specific results throughout the developing world
over time; comprehensive lending data and a World Bank lending
presentation; and full financial statements. Multiple links are provided
throughout the text to connect you with even more information.
We invite you to visit the websites for the Annual Report, Corporate
Scorecard—with full indicator definitions—and Results to broaden
your understanding of how the World Bank works with its member
countries:

       worldbank.org/annualreport/2012
       corporatescorecard.worldbank.org
       worldbank.org/results
Contents
                                                                    Message from Robert B. Zoellick .........................................................1
                                                                    Message from Dr. Jim Yong Kim ..........................................................3
                                                                    Message from the Board of Executive Directors ...................................4
                                                                    The World Bank’s Commitment to Results:
                                                                    The Corporate Scorecard .....................................................................7
                                                                         Tier I: Development Context..........................................................8
                                                                         Tier II: Country Results Supported by the Bank ...........................10
                                                                         Tier III: Development Outcomes and Operational
                                                                         Effectiveness ...............................................................................12
                                                                         Tier IV: Organizational Effectiveness and Modernization .............14
                                                                    The World Bank Group Affiliates ........................................................16
                                                                    The Role of IBRD ................................................................................16
                                                                    The Role of IDA ..................................................................................18
                                                                    Operational Summary .......................................................................20
                                                                    World Bank Lending by Theme and Sector ........................................22


                                                                         This Annual Report, which covers the period from July 1, 2011, to
                                                                         June 30, 2012, has been prepared by the Executive Directors of both
                                                                         the International Bank for Reconstruction and Development (IBRD)
                                                                         and the International Development Association (IDA)—collectively
                                                                         known as the World Bank—in accordance with the respective bylaws
                                                                         of the two institutions. Dr. Jim Yong Kim, President of IBRD and IDA
                                                                         and Chairman of the Board of Executive Directors, has submitted this
The World Bank Annual Report 2012 CD-ROM Contents                        report, together with the accompanying administrative budgets and
                                                                         audited financial statements, to the Board of Governors.
  The World Bank Annual Report 2012 (booklet), in 8 languages
  Responding with Global Knowledge and Experience, in 8 languages        All dollar amounts used in this Annual Report are current U.S. dollars
  The Regions                                                            unless otherwise specified. As a result of rounding, numbers in tables
                                                                         may not add to totals, and percentages in figures may not add to
  World Bank for Results 2012
                                                                         100. Throughout this report, the terms “World Bank” and “Bank” refer
  Financial Statements                                                   to IBRD and IDA. “World Bank Group” refers collectively to IBRD, IDA,
  Income by Region                                                       IFC, MIGA, and ICSID.
  Lending Data                                                           Annual Reports for the International Finance Corporation (IFC),
  New Operations Approved                                                the Multilateral Investment Guarantee Agency (MIGA), and the
  Organizational Information                                             International Centre for Settlement of Investment Disputes (ICSID)
                                                                         are published separately.
  World Bank Lending Presentation
Annual Report 2012


Message from Robert B. Zoellick

The past five years have been a time of testing for
the World Bank Group and our ability to respond to
the needs of our clients. Developing and developed
countries have been challenged by the triple
threat of the food, fuel, and financial crises. They’ve
faced hunger, poverty, joblessness, and debt—an
economic, social, and human crisis with political
implications. Through these difficult times, the
World Bank Group has stepped up to support our
clients with flexibility, speed, innovation, and a focus
on results. Out of challenge, we have looked for
opportunity and hope.
     The World Bank Group’s shareholders have supported our priorities and
performance with first-rate financial support. In 2007 and 2010, two record-breaking
IDA replenishments raised more than $90 billion. In 2010, shareholders backed the
IBRD’s first capital increase in more than 20 years. Today, we have a well-resourced
Bank with an AAA rating.
     We have been modernizing multilateralism for a world economy with multiple
poles of growth and democratizing development through greater openness and
accountability, sharing knowledge and information. We are laying the foundations
for expanding social accountability, fighting corruption, and building better
governance. We have maintained our focus on the poor in all regions, especially
Africa, emphasizing the need for fiscally responsible human safety nets to protect
the most vulnerable. At the same time, we have customized new products for the
middle-income countries that are increasingly important drivers of growth. Our
agenda has included gender equality, food security, climate change and biodiversity,
infrastructure investment, disaster prevention, financial innovation, and inclusion.
     The World Bank Group has paid special attention to the central role of the private
sector in development. We are supporting the enabling environment for investment
and private sector activity; extending financing to small and medium-sized
businesses and microfinance; supporting trade finance; promoting greater attention
to public-private partnerships; and encouraging investment in countries that need it
the most, especially conflict-affected and fragile states.
     In fiscal 2012, the World Bank Group committed $52.6 billion in loans, grants,
equity investments, and guarantees to its members and to private businesses. IBRD
commitments totaled $20.6 billion, compared with $26.7 billion in 2011. IDA, the
Bank’s fund for the poorest countries, made commitments of $14.8 billion, compared
with $16.3 billion in 2011.
     This Annual Report incorporates the World Bank Corporate Scorecard, a focused
snapshot of the Bank’s overall performance. Its purpose is to help Management and
the Board of Executive Directors to evaluate progress and pinpoint programs and
initiatives that require improvement.
     Results are at the core of the Scorecard. You can read about many of the Bank’s
achievements in the “World Bank for Results 2012” chapter on the CD-ROM that
accompanies the printed version of this Annual Report. This year, we have placed the


                                           1
The World Bank


majority of our content—such as the Bank’s response to the global economic crisis
and the six regional briefs—in electronic formats, to reflect readership preference,
reduce paper, and lower costs.
     One important area of the Bank’s results is in “Gender Equality and
Development”—the theme of World Development Report 2012. The lives of girls
and women have changed dramatically over the past decades: today, more girls
and women are literate, in school, in the labor force, and living longer than ever
before. Yet women still fall behind in earning and productivity, pre- and post-natal
care, and in the strength of their voices in society. The main message of the Report
is that gender equality is both a core development objective in its own right as
well as smart economics—enhancing productivity and improving prospects for
the next generation. The report points to priority areas for policy going forward,
including closing gender gaps in female mortality, education, access to economic
opportunities, and voice and influence within society.
     The World Bank’s staff are tackling these and other challenges with new and
innovative tools. They range from PforR (Program for Results), a lending instrument
that specifically ties funding to results; to the OKR (Open Knowledge Repository),
an open-access home for our research outputs and knowledge products; to SABER
(Systems Approach for Better Education Results), a global information base that will
help guide education system reform. This year’s Annual Report showcases how these
and other programs have been central to helping us better support our clients’ needs
over the past year.
     This marks my last message to you as President of the World Bank Group. I want
to thank our Governors, Board of Executive Directors, and other partners for their
guidance and support in advancing the work of this vital institution. Most of all, I want
to thank the Bank Group’s leadership team and the committed, hard-working, and
thoughtful staff. You are the ones who bring the work of development to life, in all
quarters of the globe. It has been my privilege to serve with you.


Robert B. Zoellick
President of the World Bank Group and
Chairman of the Board of Executive Directors
2007–2012


                                           2
Annual Report 2012


Message from Dr. Jim Yong Kim

I am pleased to transmit the 2012 Annual
Report of the World Bank. This report highlights
the achievements and effectiveness of the
institution, despite a challenging global economic
environment. It also underscores the importance
of collaboration across the World Bank Group and
working with external partners to advance our
shared goal of building prosperity and eradicating
poverty.
    Today, the World Bank Group has a unique
opportunity to accelerate inclusive and sustainable
growth and social progress. We are continuing
to support our clients as they respond to immediate pressures, especially through
helping countries develop cost-effective social safety nets. But we are also
well positioned to assist countries as they design and implement longer-term
development strategies through our lending, knowledge, experience, and expertise.
    I look forward to working with the Board, our partners and clients, as well as the
Bank Group’s dedicated staff in Washington, DC, and around the world. Our mission
remains more important than ever—to help developing countries respond to
immediate pressures, as well as look toward future opportunities. It is a privilege to
undertake this great work.


Dr. Jim Yong Kim
President of the World Bank Group and
Chairman of the Board of Executive Directors


                                           3
The World Bank                                                                                                                                                                             Annual Report 2012


                                                                                       From left to right (standing) Rogerio Studart, Ingrid Hoven, Agapito Mendes Dias, Merza Hasan, Piero Cipollone, Jorg Frieden,
                                                                                       Vadim Grishin, Marie-Lucie Morin, Shaolin Yang, Marta Garcia Jauregui, Hekinus Manao, Sid Ahmed Dib (Alternate), Ruud Treffers,
                                                                                       Konstantin Huber, In-Kang Cho (Alternate), Hassan Ahmed Taha, Mukesh N. Prasad; (seated) Ian Solomon, Felix Alberto Camarasa,
                                                                                       Ambroise Fayolle, Susanna Moorehead, Abdulrahman Almofadhi, Anna Brandt, Renosi Mokate, Nobumitsu Hayashi.
Message from the                                                                       Photo: Frank Vincent

Board of Executive Directors
The 25 resident Executive Directors are responsible for the conduct of the Bank’s          The Independent Evaluation Group (IEG) reports directly to the Board of Executive
general operations under delegated powers from the Board of Governors. As              Directors, providing independent advice on the relevance, sustainability, and impact
provided in the Articles of Agreement, five Executive Directors are appointed by       of operations. The Board also monitors the compliance of projects with operational
single countries having the largest number of shares, with the rest elected by other   policies and procedures through the independent Inspection Panel, which also
member countries to form constituencies in an election process every two years.        reports to the Board. (See http://worldbank.org/ieg and http://worldbank.org/
    The Board considers and decides on the International Bank for Reconstruction       inspectionpanel.)
and Development (IBRD) loan and guarantee proposals and the International
Development Association (IDA) credit, grant, and guarantee proposals made by           Board Achievements of 2012
the President. Executive Directors fulfill an important role in guiding the general
                                                                                       Executive Directors continued to exercise their oversight of the institution amid a
operations of the Bank and its strategic direction, representing the evolving
                                                                                       challenging global economic outlook, emphasizing reforms to advance poverty
perspectives of member countries on the global role of the Bank, as well as clients’
                                                                                       reduction and inclusive growth, as well as support for crisis resilience. The Board
experience. They are also responsible for presenting to the Board of Governors an
                                                                                       considered a number of documents key to these concerns. These documents
audit of accounts, an administrative budget, and The World Bank Annual Report on
                                                                                       included the World Development Report 2012: Gender Equality and Development,
fiscal year results, operations, and policies of the Bank.
                                                                                       and the report “Safety Nets Work: During Crisis and Prosperity,” which concentrates
    Executive Directors also serve on one or more standing committees: the
                                                                                       on improving the design and efficiency of existing social safety net programs and
Audit Committee, Budget Committee, Committee on Development Effectiveness,
                                                                                       creating new ones where needed. Executive Directors also looked forward to the
Committee on Governance and Administrative Matters, and Human Resources
                                                                                       World Development Report 2013: Jobs.
Committee. The Executive Directors’ Steering Committee, an informal advisory body,
                                                                                           Directors discussed progress toward the Millennium Development Goals (MDGs)
also meets regularly.
                                                                                       in the Global Monitoring Report: Food Prices, Nutrition, and the MDGs. In addition,
    Directors periodically visit member countries to review Bank assistance in
                                                                                       they discussed key reform efforts, such as the Open Data, Open Knowledge,
progress. They meet a wide range of stakeholders, including government officials,
                                                                                       Open Solutions Initiative described in the report “Update on the Bank’s Business
beneficiaries, representatives of nongovernmental organizations, other development
partners, and the business community, as well as Bank staff. In October 2011 and
February and May of 2012, Directors visited countries in Europe and Central Asia,
South Asia, and West Africa.

                                         4                                                                                                             5
The World Bank


Modernization: Results, Openness, and Accountability.” The Board also gave its
attention to the ongoing ministerial-level dialogue on sustainable development in
support of the Rio+20 and G-20 processes, and welcomed the report “The World Bank
Group Innovations in Leveraging the Private Sector for Development.”
     Executive Directors further supported drought and famine relief in the Horn of
Africa with funds from the Crisis Response Window and affirmed their commitment
to implementing the New Deal for Engagement in Fragile States, and to the
MDGs, especially in lagging regions, fragile states, and for vulnerable and excluded
populations.
     Executive Directors selected Dr. Jim Yong Kim as President for a five-year term
beginning on July 1, 2012. Dr. Kim is President of the World Bank Group and
Chairman of the Board of Executive Directors.
     The Board approved approximately $35.3 billion in financial assistance in fiscal
2012, comprising about $20.6 billion in IBRD lending and $14.8 billion in IDA support.
Executive Directors also reviewed 49 country assistance strategy products, 41 of
which were prepared jointly with the International Finance Corporation (IFC). The
Board approved an administrative budget for the World Bank of just under $1.9 billion
for fiscal 2013. (See http://worldbank.org/boards.)


                                          6
Annual Report 2012


   The World Bank’s Commitment to Results:
   The Corporate Scorecard
   The Corporate Scorecard provides information on the Bank’s overall performance and results
   achieved by its clients. The Scorecard facilitates dialogue between Management and the
   Board on progress made and areas that need attention. Introduced two years ago, the four-tier
   Scorecard covers the full spectrum of IBRD and IDA activities.
       Tier I provides the Global Development Context—the indicators show the long-term
   development outcomes that countries are achieving, and provide the context and direction for
   the Bank’s work. These high-level outcomes cannot be attributed directly to the Bank, because
   countries and their development partners all contribute to these achievements over the
   long term through a combination of multisector interventions, actions, and policy decisions.
   These indicators are also affected by external factors such as global crises. Tier II is Country
   Results Supported by the Bank. This tier highlights development results that countries have
   achieved with Bank support. Tier III, Development Outcomes and Operational Effectiveness,
   provides information on the effectiveness of the Bank’s operations and services. Organizational
   Effectiveness and Modernization, Tier IV, assesses how well the Bank is functioning and
   adapting to better support countries in achieving results. In addition, the Bank operates a
   comprehensive web-based results reporting system.


               I         Development Context
                         What is the development progress in Bank client countries as a group?
                         Growth, Jobs, and Poverty
                         Institutions and Governance
                         Human Development and Gender
                         Sustainable Development
 RESULTS


                         Finance, Private Sector Development, and Trade


                          Country Results Supported by the Bank
               II         How is the Bank supporting countries in achieving results?
                         Institutions and Governance                                                                      Y


                         Human Development and Gender                                                                     G


                         Sustainable Development                                                                          G


                         Finance, Private Sector Development, and Trade                                                   G


               III        Development Outcomes and Operational Effectiveness
                          Is the Bank managing the performance of its activities effectively to achieve results?
                         Development Outcomes                                                                                 Y


                         Lending Operations                                                                                   Y
 PERFORMANCE


                         Knowledge Activities                                                                              G


                         Use of Country Systems                                                                            G


               IV         Organizational Effectiveness and Modernization
                          Is the Bank managing skills, capacity, resources, and processes efficiently? Is business
                          modernization on track?
                         Resources and Alignment                                                                           G


                         Capacity and Skills                                                                               Y


                         Business Modernization                                                                            Y


                         Sector Actions related to Post-Crisis Directions                                                  G


LEGEND
 G        Majority of the indicators in the group show improvement or are on-track.
 Y        No clear trend; while some indicators show improvement, others show decline or no change.
 R        Majority of the indicators in the group show declines or are off-track.
NA        There is insufficient data or there are no trends for the indicators in the group.


For Tier I, color-coded traffic lights are not assigned since Tier I provides overall development context.
For Tier II, the Summary table presents overall ratings based on management assessment of progress of Bank-supported
activities. Ratings are not assigned to individual indicators in the detailed table since these are driven by country demand.


                                                                        7
The World Bank                                                                                                                                                                                                                               Annual Report 2012


Tier I: Development Context
                                                                                                                                                                                                            Tier I: The latest data on poverty shows that for
                                                                                                         BASELINE              CURRENT             LINKAGES
                                        INDICATORS                                                                                                                   MDG TARGETS 1990–2015                  the first time, in every region of the developing
                                                                                                   Value        Year     Value       Year     PCD        MDG
                                                                                                                                                                                                            world, the number of poor declined, and
GROWTH, JOBS, AND POVERTY                                                                                                                                                                                   despite recent crises, global poverty overall
Population below US$ 1.25 (PPP) a day+                                                      (%)    31.1         2002     22.7        2008      1         MDG1   Halve from the baseline of 42.3%, 1990      continued to fall. A preliminary World Bank
                 +                                                                                                                                                                                          survey-based estimate for 2010 on a much
GDP per capita                                                            (constant 2000 US$)      1,657        2006     2,080       2011     1,2
                                                                                                                                                                                                            smaller sample indicates that the global
Domestic credit to private sector                                                   (% of GDP)     55.2         2005     74.7        2011     1,2
                                                                                                                                                                                                            poverty rate at $1.25 a day fell to less than half
Employment to population ratio (15+)                                                        (%)    62.1         2005     61.2        2010     1,2        MDG1                                               its 1990 value indicating the first Millennium
Ratio of female-to-male labor force participation+                                          (%)    68.4         2006     67.5        2010     1,2        MDG3                                               Development Goal (MDG) target of cutting
                                                                                                                                                                                                            the extreme poverty rate to half its 1990 level
INSTITUTIONS AND GOVERNANCE
                                                                                                                                                                                                            was already achieved before 2015. Developing
State Institutions with adequately established/differentiated power structure     (scale: 1–10)     6.2         2006      6.3        2012      4
                                                                                                                                                                                                            countries hit numerous other strides. Average
Effective and accountable government                                                (scale: 0–7)   2.89        2006/07   3.20        2010      4                                                            annual GDP per capita in developing countries
Public access to information                                                     (scale: 0–100)    50.01        2007     56.94      2010/11    4                                                            increased. Gender parity in primary and
Level of statistical capacity                                                    (scale: 0–100)     66          2005      67         2011      4                                                            secondary schools improved in 2010. By 2010,
                                                                                                                                                                                                            nearly 86 percent of the world’s population had
HUMAN DEVELOPMENT AND GENDER                                                                                                                                                                                access to improved drinking water.
                                                                                                                                                                Reduce by two-thirds from the baseline           These global trends mask significant
Under 5 mortality rate+                                                  (per 1,000 live births)    70          2006      63         2010     1,5        MDG4
                                                                                                                                                                of 100, 1990                                variations between and within countries. The
Prevalence of HIV, female                                                       (% ages 15–24)      0.8         2009      0.8        2009     1,5        MDG6   Halt by 2015 and begun to reverse           poorest population groups remain vulnerable,
                                                                                                                                                                Reduce by three-fourths from the baseline   and only limited progress has been made in
Maternal mortality ratio+                                            (per 100,000 live births)      290         2005      230        2010     1,5        MDG5
                                                                                                                                                                of 440, 1990                                employment, governance, and biodiversity, as
Prevalence of underweight children +                                 (% children under 5yrs)       20.1         2005     17.7        2010     1,5        MDG1                                               well as other priority areas. Maternal mortality
Primary school completion rate      +
                                                                   (% of relevant age group)       85.1         2005     89.2        2010     1,2        MDG2   100% (baseline of 69%, 1991)                and child mortality are falling significantly
                                                                                                                                                                                                            short of their MDG targets. The food, fuel, and
Secondary school enrollment rate                                                     (%, gross)    60.7         2005     66.7        2010     1,2
                                                                                                                                                                                                            financial crises over the past four years at times
Gender parity index in primary and secondary education+                                     (%)    94.4         2005     96.9        2010     1,2        MDG3   100% (baseline of 84% 1991)
                                                                                                                                                                                                            caused sharp negative impacts on vulnerable
SUSTAINABLE DEVELOPMENT                                                                                                                                                                                     populations and slowed the rate of poverty
Infrastructure                                                                                                                                                                                              reduction in some countries.
Paved roads                                                                  (% of total roads)    31.6       1999–03    50.6       2005–09   1,2
                                                                                                                                                                Halve proportion of people without access
Access to an improved water source+                                          (% of population)     83.4         2005     86.4        2010     1,2        MDG7
                                                                                                                                                                (baseline of 28%, 1990)                         Legend
                                                                                                                                                                Halve proportion of people without access
Access to an improved sanitation facility+                                   (% of population)     53.2         2005     56.4        2010     1,2        MDG7                                                   LINKAGES
                                                                                                                                                                (baseline of 57%, 1990)
Household electrification rate  +
                                                                            (% of households)      [56.3]       2004     [61.3]      2008     1,2                                                               PCD 1–5
                                                                                                                                                                                                                Linkages to Post-Crisis Directions:
Mobile cellular telephone subscriptions+                                      (per 100 people)      33          2006      73         2010     1,2        MDG8                                                   1. Target the Poor and Vulnerable
                                                                                                                                                                                                                2. Create Opportunities for Growth
Agriculture Productivity and Food Security                                                                                                                                                                      3. Promote Global Collective Action
Cereal yield                                                                    (kg per hectare)   2,894        2006     3,110       2010     1,2,5                                                             4. Strengthen Governance
                                                                                                                                                                                                                5. Manage Risk and Prepare for Crisis
Agriculture value added per worker                                        (constant 2000 US$)       685         2006      761        2010     1,2,5

Climate Change and Environment                                                                                                                                                                                  MDG
               +
                                                                                                                                                                                                                Linkage to the Millennium Development Goals.
CO2 emissions                                                       (kg per 2005 US$ of GDP)       0.65         2005     0.60        2008      3         MDG7
Protected terrestrial areas                                          (% of total surface area)     12.0         2006     12.1        2010     1,3        MDG7                                                   DATA
Average annual deforestation                                                                (%)     0.3       1990–00     0.2       2000–10   1,3        MDG7                                                   [ ] IDA only
                                                                                                                                                                                                                + Indicators used in proposed IDA16 Results
FINANCE, PRIVATE SECTOR DEVELOPMENT, AND TRADE                                                                                                                                                                      Measurement System
Male–female gap in the population with an
                                                                      (% of population 15+)         9.7         2011      9.7        2011     1,2
account at a formal financial institution
                                                                                                                                                                                                                Note: For Tier I, color-coded traffic lights are
Trade logistics performance index: Overall+                        (scale: 1 = low, 5 = high)       2.5         2007      2.6        2012     1,2,3      MDG8                                                   not assigned because Tier I provides the overall
                                                                                                                                                                                                                development context in IBRD/IDA eligible countries.
Trade diversification                                                                                                                         1,2,3      MDG8
 • Product export diversification                                                  (index: 0–1)    0.24         2005     0.21        2009
 • Market diversification                                                          (index: 0–1)    0.23         2005     0.21        2009
Time required for business start-up+                                                     (days)     50          2007      36         2011      2

                                                                     8                                                                                                                                      9
The World Bank                                                                                                                                                                                                                        Annual Report 2012


Tier II: Country Results Supported by the Bank
                                                                                                                                                                                                     Tier II: The Bank provides financial resources,
                                                                                                                                                BASELINE                    CURRENT        PCD
                                                             INDICATORS                                                          TYPE                                                                shares knowledge and analysis, supports
                                                                                                                                          Value        Year          Value        Year   LINKAGE
                                                                                                                                                                                                     institutions and country capacity, and facilitates
SUPPORT TO INSTITUTIONS AND GOVERNANCE                                                                                                                                                               partnerships and knowledge exchanges among
                                                                                                                                                                                                     developing countries to help them address
Countries with strengthened national statistical systems                                                           (number)     Outcome     6          FY07            13         FY12     2,4
                                                                                                                                                                                                     development challenges. The Bank supports
Countries with Bank-supported programs on asset, liability, and risk management                                    (number)     Output      64         FY10            85         FY12    2,4,5      countries’ national development priorities,
                                                                                                                                                                                                     which evolve as country circumstances change.
Countries with strengthened Public Management Systems in:
                                                                                                                                                                                                          As a contributor and partner to country
   • Civil service and public administration                                                                       (number)     Outcome     28         FY12            28         FY12     2,4       development programs, the Bank, with
                                                                                                                                                                                                     offices in more than 120 countries, often
  • Tax policy and administration                                                                                  (number)     Outcome     27         FY12            27         FY12     2,4
                                                                                                                                                                                                     plays a coordinating and convening role
  • Public financial management                                                                                    (number)     Outcome     57         FY12            57         FY12     2,4       for development partners. Tier II includes
                                                                                                                                                                                                     aggregate data collected through the
  • Procurement                                                                                                    (number)     Outcome     11         FY12            11         FY12     2,4
                                                                                                                                                                                                     standardized sector indicators. The data show
  • Transparency and access to information                                                                         (number)     Output      61         FY11            72         FY12     2,4       country results supported by Bank operations.
                                                                                                                                                                                                     Results pertaining to human development,
SUPPORT TO HUMAN DEVELOPMENT AND GENDER
                                                                                                                                                                                                     infrastructure, and access to services for the
Teachers recruited and/or trained+                                                                                 (millions)   Outcome    0.95        FY11            1.1        FY12     1,2       poor and the vulnerable, as well as for creating
                                                                                                                                                                                                     opportunities for growth, are included. Bank
Countries with Bank-supported learning assessments                                                                 (number)     Output      25         FY10            29         FY11     1,2
                                                                                                                                                                                                     support has contributed to significant results
People with access to a basic package of health services+                                                          (millions)   Outcome    18.2        FY11           19.5        FY12     1,5       achieved by its clients in education and health,
                                                                                                                                                                                                     especially those related to women and girls; in
Children immunized+                                                                                                (millions)   Outcome     78         FY11           128         FY12     1,5
                                                                                                                                                                                                     the sustainable development of infrastructure,
Beneficiaries covered by social safety net programs                                                                (millions)   Outcome    114.6       FY09          114.1        FY11     1,5       agriculture, and an environment for growth
                                                                                                                                                                                                     and access; and in finance and private sector
Gender
                                                                                                                                                                                                     development.
Pregnant women receiving antenatal care+                                                                           (millions)   Outcome     17         FY11            50         FY12     1,5

Women and girls benefiting from social protection programs and other targeted schemes                              (millions)   Outcome     78         FY12            78         FY12     1,2           Legend
SUPPORT TO SUSTAINABLE DEVELOPMENT
                                                                                                                                                                                                         LINKAGES
Infrastructure
                                                                                                                                                                                                         PCD 1–5
Roads constructed or rehabilitated +                                                                            (kilometers)    Output    56,504       FY11          57,252       FY12     1,2           Linkages to Post-Crisis Directions:
                                                                                                                                                                                                         1. Target the Poor and Vulnerable
People provided with access to improved water sources+                                                             (millions)   Outcome    39.6        FY12           39.6        FY12    1,2,5          2. Create Opportunities for Growth
                                                                                                                                                                                                         3. Promote Global Collective Action
People provided with access to improved sanitation+                                                                (millions)   Outcome     3.1        FY12            3.1        FY12    1,2,5          4. Strengthen Governance
                                                                                                                                                                                                         5. Manage Risk and Prepare for Crisis
Transmission and distribution lines constructed or rehabilitated                                                (kilometers)    Output    10,740       FY11          36,354       FY12      2

Generation capacity of conventional and renewable energy                                                       (megawatts)      Output     3,719       FY11          5,040        FY12      2
                                                                                                                                                                                                         TYPE
                                                                                                                                                                                                         Output indicators will be replaced by outcome
 People provided with access to electricity                                                                        (millions)   Outcome             Data to be reported in 2013            1,2           indicators as country-level data become available.

Agriculture Productivity and Food Security                                                                                                                                                               DATA
Area provided with irrigation services                                                                   (hectares, millions)   Output      0.7        FY11            1.1        FY12    1,2,5          Year
                                                                                                                                                                                                         Represents the fiscal or calendar year when most
Farmers adopting improved agricultural technology                                                                  (number)     Outcome   531,868      FY12         531,868       FY12    1,2,5          recent data were available.
                                                                                                                                                                                                         + Indicators used in proposed IDA16 Results
Climate Change and Environment                                                                                                                                                                               Measurement System

Emission reduction with support of special climate finance instruments                  (annual, million tons CO2 equivalent)   Outcome    315         FY12           315         FY12     3,5
                                                                                                                                                                                                         Note: For Tier II, color-coded traffic lights are not
Countries supported on natural disaster management                                                                 (number)     Output      76         FY10            74         FY12    1,2,3,5        assigned for individual indicators because they
                                                                                                                                                                                                         represent country results achieved with Bank support
                                                                                                                                                                                                         and are demand-driven.
SUPPORT TO FINANCE, PRIVATE SECTOR DEVELOPMENT, AND TRADE
                                                                                                                                                                                                         The Bank first started data aggregation using Core
Active number of microfinance loan accounts                                                                        (millions)   Outcome     31         FY12            31         FY12    1,2,5          Sector Indicators in IDA projects in FY10, and in FY11,
                                                                                                                                                                                                         it also included IBRD; therefore, the baseline and
Countries that have applied trade-related diagnostic tools                                                         (number)     Outcome     15         FY12            15         FY12    1,2,3          current values of some indicators are revised and have
                                                                                                                                                                                                         the same values.


                                                                   10                                                                                                                               11
The World Bank                                                                                                                                                                                           Annual Report 2012


Tier III: Development Outcomes and
Operational Effectiveness
                                                                                                    BASELINE            CURRENT         PCD     PERFORMANCE            Tier III: The Bank’s policies, systems, and
                                        INDICATORS                                                                                                            STATUS   processes reinforce its emphasis on results.
                                                                                              Value        Year   Value       Year   LINKAGES     STANDARD
                                                                                                                                                                       They include quality assurance; real-time
III-A: DEVELOPMENT OUTCOME RATINGS                                                                                                                                     monitoring of results and performance; and
                                                                                                                                                                       systematic self-evaluation, complemented by ex
Satisfactory CAS/CPS completion+                                           (% IEG rating)      59.0        FY10    63.0       FY12                   70         R
                                                                                                                                                                       post independent evaluation of strategies and
Satisfactory (IBRD/IDA) operations outcomes at completion+                 (% IEG rating)      76.8        FY08    70.5       FY10                Monitored     Y      activities by the Independent Evaluation Group
                                                                                                                                                                       (IEG). This tier shows the overall success of Bank
   • IBRD countries                                                        (% IEG rating)      76.5        FY08    70.5       FY10                   80         R
                                                                                                                                                                       activities in achieving their development goals,
                                                                                                                                                                       as well as the Bank’s operations effectiveness,
   • IDA countries                                                         (% IEG rating)      77.0        FY08    70.0       FY10                   75         Y
                                                                                                                                                                       including the quality and results orientation
   • Fragile situations (IBRD/IDA)*                                        (% IEG rating)      82.6        FY08    71.4       FY10                   70         G      of its operations and knowledge activities,
                                                                                                                                                                       the performance of its lending portfolio, the
Analytic and advisory activities objectives accomplished+                             (%)      72.0        FY08    71.0       FY11                   80         Y
                                                                                                                                                                       mainstreaming of gender in its operational work,
                                                                                                                                                                       client feedback, and its use of country systems.
Clients’ impression of Bank effectiveness                                   (scale: 0–10)      6.9         FY08    6.7        FY11                   7          Y


III-B: OPERATIONAL EFFECTIVENESS
LENDING OPERATIONS                                                                                                                                                          Legend
Ensuring Sound Quality and Portfolio Performance
Quality of design for investment operations+                                          (%)      76          FY09    83         FY11                   90         Y
                                                                                                                                                                            LINKAGES
                                                                                                                                                                            PCD 1–5
Quality of implementation support for investment operations                           (%)      83          FY09    78         FY11                   90         Y           Linkages to Post-Crisis Directions:
                                                                                                                                                                            1. Target the Poor and Vulnerable
Satisfactory implementation of active operations                                      (%)      88          FY08    85.5       FY12                Monitored     G           2. Create Opportunities for Growth
                                                                                                                                                                            3. Promote Global Collective Action
Gross disbursements                                                         (US$ billions)     19.6        FY08    30.8       FY12                Monitored     G           4. Strengthen Governance
                                                                                                                                                                            5. Manage Risk and Prepare for Crisis
Disbursement ratio+                                                                   (%)      21.3        FY08    20.0       FY12                   20         G


Average time from approval to first disbursement                                (months)       12          FY08    7.51       FY11                Monitored     G
                                                                                                                                                                            DATA
                                                                                                                                                                            * List of countries designated as “fragile” changes
Recipient executed trust fund disbursements                                 (US$ billions)     2.9         FY08    3.6        FY12                Monitored     G             every year
                                                                                                                                                                            + Indicator used in proposed IDA16 Results
Managing Operations for Results, Monitoring, and Evaluation                                                                                                                   Measurement System
                                                                                                                                                                            Year
Projects with indicators capturing all aspects of development objective+              (%)      83          FY09    91         FY12                  100         Y
                                                                                                                                                                            Represents the fiscal or calendar year when data were
                                                                                                                                                                            reviewed.
Implementation Completion and Results Reports reporting key results+                  (%)      95          FY12    95         FY12                  100         G


Bank operations with beneficiary feedback                                             (%)      22          FY11    22         FY11                Monitored     NA          PERFORMANCE STANDARDS
                                                                                                                                                                            Performance standards/targets are provided
Gender Mainstreaming                                                                                                                                                        where available. Indicators are “monitored” where
                                                                                                                                                                            performance standard or target is not relevant. Blank
Projects with gender-informed design+                                                 (%)      60          FY10    80         FY12     1,2           55         Y
                                                                                                                                                                            cells show that some standards are not developed.
CAS/CPS that draw on and discuss gender assessment findings+                          (%)      60          FY08    100        FY12     1,2          100         G

                                                                                                                                                                            STATUS
KNOWLEDGE ACTIVITIES                                                                                                                                                        G    On-track. A meaningful increase from baseline,
                                                                                                                                                                                 or for indicators with performance standards,
Data freely accessed by global users                                       (million visits)    1.7         2008    6.8        2011                Monitored     G
                                                                                                                                                                                 achievement meets or exceeds performance
                                                                                                                                                                                 standard.
Publications including research cited in professional journals                  (number)      18,000       2010   18,000      2010                Monitored     G
                                                                                                                                                                             Y   Watch. No meaningful increase or decrease,
                                                                                                                                                                                 or for indicators with performance standards,
USE OF COUNTRY SYSTEMS                                                                                                                                                           achievement is close to performance standard but
                                                                                                                                                                                 does not meet performance standard.
Use of country systems for procurement (PD survey)+                                   (%)      40          2006    55         2011                   55         G
                                                                                                                                                                             R   Off-track. A meaningful decrease from baseline,
Use of country systems for financial management (PD survey)      +
                                                                                      (%)      42          2006    71         2011                   65         G                or for indicators with performance standards,
                                                                                                                                                                                 achievement is not close to performance standard.
Use of country monitoring and evaluation systems   +
                                                                                      (%)      72          FY09    77         FY12                Monitored     G           NA   Not applicable. There is insufficient data to
                                                                                                                                                                                 establish a trend, or there is no performance
Collaborative analytical and advisory activities (PD survey)+                         (%)      49          2006    59         2011                   66         Y                standard.

                                                                                                                                                                            Note: CAS=Country Assistance Strategy; CPS=Country
                                                                                                                                                                            Partnership Strategy; PD=Paris Declaration.


                                                                     12                                                                                                13
The World Bank                                                                                                                                                                                                            Annual Report 2012


Tier IV: Organizational Effectiveness and
Modernization
                                                                                                                                                                                        Tier IV: The Bank continues to work to improve
                                                                                                           BASELINE              CURRENT          PCD/M    PERFORMANCE
                                            INDICATORS                                                                                                                         STATUS   its organizational efficiency, to better align the
                                                                                                    Value        Year     Value        Year     LINKAGES     STANDARD
                                                                                                                                                                                        skills and capacity of its staff with its strategic
                                                                                                                                                                                        priorities, and to implement its modernization
IV-A. RESOURCES, SKILLS, AND BUSINESS MODERNIZATION                                                                                                                                     agenda in order to become more responsive
RESOURCES AND ALIGNMENT                                                                                                                                                                 and accountable to its stakeholders. The Bank
Client services as % of total cost                                                           (%)     62.6        FY08      63.2        FY12                    Monitored         G      has been steadily improving its organizational
                                                                                                                                                                                        effectiveness. With a real flat budget since fiscal
Client services in fragile and conflict-affected areas                          (% of total cost)     4.9        FY08       5.9        FY12                    Monitored         Y
                                                                                                                                                                                        2006, it has made continuous improvements in
Lending commitments (IBRD/IDA)                                                    (US$ billions)     24.7        FY08      35.3        FY12                    Monitored         G
                                                                                                                                                                                        the way it allocates and uses its resources.
Financial intermediary funds commitments                                          (US$ billions)     4.69        FY08      6.08        FY12                    Monitored         NA


Recipient executed trust fund commitments                                         (US$ billions)      2.9        FY08       3.9        FY12                    Monitored         G           Legend
Share of knowledge services funded by trust funds                                            (%)     31.6        FY08      45.1        FY12                    Monitored         Y
                                                                                                                                                                                             LINKAGES
Use of trust funds to support IBRD/IDA lending preparation                                                                                                                                   PCD 1–5
                                                                                             (%)     10.3        FY08      14.9        FY12                    Monitored         Y
and implementation support                                                                                                                                                                   Linkages to Post-Crisis Directions:
CAPACITY AND SKILLS                                                                                                                                                                          1. Target the Poor and Vulnerable
                                                                                                                                                                                             2. Create Opportunities for Growth
Staff diversity                                                                          (index)     0.85        FY08      0.89        FY12                      1.00            Y           3. Promote Global Collective Action
                                                                                                                                                                                             4. Strengthen Governance
Staff mobility                                                                               (%)     4.39        FY08      4.39        FY12                    Monitored         Y           5. Manage Risk and Prepare for Crisis
                                                                                                                                                                                             M = Business Modernization
Staff engagement                                                                             (%)      78         FY08       80         FY10                    Monitored         Y


BUSINESS MODERNIZATION                                                                                                                                                                       DATA
                                                                                                                                                                                             + Indicator used in proposed IDA16 Results
Products and Services for Results                                                                                                                                                              Measurement System
Lending for program results                                                           (number)        0         FY12-Q3     2         FY12-Q4      M           Monitored         NA
                                                                                                                                                                                             Year
                                                                                                                                                                                             Represents the fiscal or calendar year when data were
IBRD/IDA results stories and briefs                                           (number on web)        131         2008      646         FY12                    Monitored         G
                                                                                                                                                                                             reviewed.

Sectors/themes with core indicators for both IDA and IBRD                             (number)        0          FY09       24         FY12                       7              G
                                                                                                                                                                                             PERFORMANCE STANDARDS
Organization                                                                                                                                                                                 Performance standards and targets are provided
                                                                                                                                                                                             where available. Indicators are “monitored” where the
Openness: Access to Information requests with timely completion                              (%)      78         FY11       78         FY12        M           Monitored         G
                                                                                                                                                                                             performance standard or target is not relevant. Blank
                                                                                                                                                                                             cells show that some standards are not developed.
Sector Board Connectivity: Professional staff time spent on tasks
                                                                                             (%)      7.5        FY08       6.8        FY12        M              10             R
in other Bank units
                                                                                                                                                                                             PROJECTIONS
Decentralization: Services for clients managed by staff based in
                                                                                             (%)     40.6        FY08      44.4        FY12        M           Monitored         Y
                                                                                                                                                                                             Projections are based on the current estimation of
client countries+
                                                                                                                                                                                             future client demands.
Processes and Systems for Flexibility and Efficiency
Projects with new risk framework with fast processing                                        (%)      45         FY11       38         FY12        M           Monitored         Y
                                                                                                                                                                                             STATUS
                                                                                                                                                                                             G    On-track. A meaningful increase from baseline,
Speed of preparation from Concept Note to Approval+                                    (months)       17         FY08       14         FY12        M          12 months          Y                or for indicators with performance standards,
                                                                                                                                                                                                  achievement meets or exceeds performance
Average cost of preparing a lending project+                                     (average, US$)     359,000      FY08     357,000      FY12        M           Monitored         G
                                                                                                                                                                                                  standard.
                                                                                                                                                                                              Y   Watch. No meaningful increase or decrease,
Average annual cost supporting project implementation+                           (average, US$)     115,000      FY08     132,000      FY12        M           Monitored         G
                                                                                                                                                                                                  or for indicators with performance standards,
                                                                                                                                                                                                  achievement is close to performance standard but
Budget flexibility at the start of the fiscal year                                           (%)      3.2        FY08       3.1        FY13                       5              R
                                                                                                                                                                                                  does not meet performance standard.
                                                                                                                                                                                              R   Off-track. A meaningful decrease from baseline,
IV-B. SECTOR ACTIONS RELATED TO POST-CRISIS DIRECTIONS                                                                                                       PROJECTIONS
                                                                                                                                                                                                  or for indicators with performance standards,
Support to agriculture and related sectors                                                                                                                                                        achievement is not close to performance standard.
                                                                     (average, US$ billions/year)     2.9      FY06–08      4.3       FY10–12     1,2,5    4.5–6.4 (2010–12)     Y
                                                                                                                                                                                             NA   Not applicable. There is insufficient data to
(IBRD, IDA, SPF)
                                                                                                                                                                                                  establish a trend, or there is no performance
Support to sustainable infrastructure                                                                                                                                                             standard.
                                                                     (average, US$ billions/year)     8.2      FY04–07     19.5       FY09–12     1,2,3        Monitored         G
(IBRD, IDA, GEF, RETF, SPF)
Support to health, nutrition, and population
                                                                     (average, US$ billions/year)     1.5      FY04–07      2.4       FY11–12     1,4      2.0–3.0 (2011–12)     G
(IBRD, IDA)
 Support to education sector
                                                                     (average, US$ billions/year)     1.0      FY95–09      1.7       FY10–12     1,2        1.1 (2010–15)       G
(IDA)


                                                                    14                                                                                                                  15
The World Bank                                                                                                                                                       Annual Report 2012


The World Bank Group Affiliates                                                               themes receiving the highest share of commitments were Financial and Private Sector
                                                                                              Development (16 percent), followed by Public Sector Governance (13 percent) and
The institutions of the World Bank Group are the International Bank for Reconstruction
                                                                                              Human Development (13 percent).
and Development (IBRD) and the International Development Association (IDA), which
                                                                                                  IBRD also offers financial products that allow clients to efficiently fund their
together comprise the World Bank; the International Finance Corporation (IFC); the
                                                                                              development programs and manage risks related to currency, interest rates,
Multilateral Investment Guarantee Agency (MIGA); and the International Centre for
                                                                                              commodity prices, and natural disasters. In fiscal 2012, the Bank’s Treasury executed
Settlement of Investment Disputes (ICSID). These organizations work together and
                                                                                              U.S. dollar equivalent (USDeq) 2.5 billion in hedging transactions on behalf of member
complement each other’s activities to achieve their shared goal of reducing poverty
                                                                                              countries, including USDeq 2.3 billion in interest rate hedges and USDeq 149 million
and improving lives. Collaboration among the affiliates is increasing as the Bank works
                                                                                              in currency hedges (all local currency conversions). It also executed swap transactions
more closely with the private sector. Each institution discloses its fiscal year highlights
                                                                                              totaling USDeq 9.5 billion to manage the risks of its balance sheet. In addition,
in a separate annual report.
                                                                                              Treasury executed USDeq 269 million in swaps on behalf of the International Finance
                                                                                              Facility for Immunisation.
The Role of IBRD
This global development cooperative is owned by 188 countries. IBRD works
                                                                                              IBRD Resources
with its members to achieve equitable and sustainable economic growth in their
                                                                                              IBRD issues bonds in international capital markets and provides long-term loans to
national economies and to find solutions to pressing regional and global problems
                                                                                              middle-income countries. In fiscal 2012, IBRD raised USDeq 38.4 billion by issuing
in economic development and in other important areas, such as environmental
                                                                                              bonds in 23 currencies. Because of its standing in the capital markets and its
sustainability. It pursues its overriding goal—to overcome poverty and improve
                                                                                              financial strength, IBRD was able to borrow these large volumes on very favorable
standards of living—primarily by providing loans, risk management products, and
                                                                                              terms despite volatile market conditions. The Bank’s strength is based on IBRD’s
expertise on development-related disciplines and by coordinating responses to
                                                                                              prudent financial policies and practices, which help maintain its AAA credit rating.
regional and global challenges. (See http://www.worldbank.org/ibrd.)
                                                                                              IBRD’s equity primarily comprises paid-in capital and reserves. Under the terms of
                                                                                              the general and selective capital increase resolutions approved by the Board of
IBRD Financial Commitments and Services
                                                                                              Governors on March 16, 2011, subscribed capital is expected to increase by $86.2
New lending commitments by IBRD were $20.6 billion, including 93 operations, in
                                                                                              billion, of which $5.1 billion will be paid-in over a five-year period. As of June 30,
fiscal 2012—significantly higher than the historical average ($13.5 billion in fiscal
                                                                                              2012, the cumulative increase in subscribed capital and the related paid-in amounts
2005–08), but less than the record $44.2 billion in fiscal 2010 when the crisis peaked,
                                                                                              in connection with these capital increase resolutions totaled $15.3 billion and $0.9
and less than the $26.7 billion in fiscal 2011. Europe and Central Asia ($6.2 billion) and
                                                                                              billion, respectively.
Latin America and the Caribbean ($6.2 billion) received the largest shares of IBRD’s
                                                                                                   As a cooperative institution, IBRD seeks not to maximize profit but to earn enough
new lending, followed by East Asia and Pacific ($5.4 billion). Commitments to the
                                                                                              income to ensure its financial strength and sustain its development activities. Of fiscal
Middle East and North Africa ($1.4 billion), South Asia ($1.2 billion), and Africa ($147
                                                                                              2012 allocable net income, the Executive Directors approved the addition of $390
million) followed. Among sectors, Public Administration, Law, and Justice received the
                                                                                              million to the general reserve, and recommended to the Board of Governors the
largest commitment ($5.4 billion), followed by Transportation ($3.4 billion), Energy
                                                                                              transfer of $608 million to IDA.
and Mining ($2.8 billion), and Health and Other Social Services ($2.5 billion). The
                                                                                                   Consistent with IBRD’s development mandate, the principal risk it takes is the
                                                                                              country credit risk inherent in its portfolio of loans and guarantees. One summary
                                                                                              measure of the Bank’s risk profile is the ratio of equity to loans and long-term
FIGURE 1
                                                                                              investment assets, which is closely managed in line with the Bank’s financial and risk
IBRD RATIO OF EQUITY TO LOANS
AND LONG-TERM INVESTMENT ASSETS                                                               outlook. This ratio stood at 27.0 percent as of June 30, 2012.
AS OF JUNE 30, 2012


PERCENT
                                                                                              The Role of IDA
40            37.6                                                                            The World Bank’s fund for the poorest countries, IDA is the largest multilateral channel
                             34.3
                                                                                              of concessional financing to the world. Its funding supports countries’ efforts to boost
                                                 29.4           28.6
30                                                                              27.0          economic growth, reduce poverty, and improve the living conditions of the poor. In
                                                                                              fiscal 2012, 81 countries were eligible to receive IDA assistance.
20                                                                                            (See http://www.worldbank.org/ida.)

10                                                                                            IDA Financial Commitments
                                                                                              IDA commitments amounted to $14.8 billion in fiscal 2012, including $12.1 billion
 0
              FY08          FY09              FY10              FY11             FY12
                                                                                              in credits, $2.2 billion in grants, and $0.4 billion in guarantees. The largest share of
                                                                                              resources was committed to Africa, which received $7.4 billion. South Asia ($5.3

                                            16                                                                                             17
Annual report2012 en

More Related Content

Viewers also liked

China And The Global Publishing Market
China And The Global Publishing MarketChina And The Global Publishing Market
China And The Global Publishing MarketRam Krishna
 
The World Bank Office Of The Publisher
The World Bank  Office Of The PublisherThe World Bank  Office Of The Publisher
The World Bank Office Of The PublisherRam Krishna
 
Organizing Infoshop Libraries and Their Collections: Bringing the Community i...
Organizing Infoshop Libraries and Their Collections: Bringing the Community i...Organizing Infoshop Libraries and Their Collections: Bringing the Community i...
Organizing Infoshop Libraries and Their Collections: Bringing the Community i...Nicole Pagowsky
 

Viewers also liked (7)

China And The Global Publishing Market
China And The Global Publishing MarketChina And The Global Publishing Market
China And The Global Publishing Market
 
The European Experience on PCD: Lessons Learned and Challenges for the Future
The European Experience on PCD: Lessons Learned and Challenges for the FutureThe European Experience on PCD: Lessons Learned and Challenges for the Future
The European Experience on PCD: Lessons Learned and Challenges for the Future
 
Gdp ppp
Gdp pppGdp ppp
Gdp ppp
 
The World Bank Office Of The Publisher
The World Bank  Office Of The PublisherThe World Bank  Office Of The Publisher
The World Bank Office Of The Publisher
 
Organizing Infoshop Libraries and Their Collections: Bringing the Community i...
Organizing Infoshop Libraries and Their Collections: Bringing the Community i...Organizing Infoshop Libraries and Their Collections: Bringing the Community i...
Organizing Infoshop Libraries and Their Collections: Bringing the Community i...
 
Gdf 2012
Gdf 2012Gdf 2012
Gdf 2012
 
World bank group international trade
World bank group international tradeWorld bank group international trade
World bank group international trade
 

Similar to Annual report2012 en

Microfinance in Myanmar Sector Assessment
Microfinance in Myanmar Sector AssessmentMicrofinance in Myanmar Sector Assessment
Microfinance in Myanmar Sector AssessmentDr Lendy Spires
 
Microfinance in myanmar sector assessment
Microfinance in myanmar sector assessmentMicrofinance in myanmar sector assessment
Microfinance in myanmar sector assessmentDr Lendy Spires
 
Enabling Poor Rural People to Overcome Poverty
 Enabling Poor Rural People to Overcome Poverty  Enabling Poor Rural People to Overcome Poverty
Enabling Poor Rural People to Overcome Poverty Dr Lendy Spires
 
Evaluacion del fmi deficiencia de capital de la banca espanola
Evaluacion del fmi  deficiencia de capital de la banca espanolaEvaluacion del fmi  deficiencia de capital de la banca espanola
Evaluacion del fmi deficiencia de capital de la banca espanolaneiracar
 
Informe FMI sobre Sector financiero español
Informe FMI sobre Sector financiero españolInforme FMI sobre Sector financiero español
Informe FMI sobre Sector financiero españolManfredNolte
 
States of Fragility report
States of Fragility reportStates of Fragility report
States of Fragility reportAlison Burt
 
Some Evolving Trends at the World Bank
Some Evolving Trends at the World BankSome Evolving Trends at the World Bank
Some Evolving Trends at the World BankDr Lendy Spires
 
Some evolving-trends-at-the-world-bank
Some evolving-trends-at-the-world-bankSome evolving-trends-at-the-world-bank
Some evolving-trends-at-the-world-bankDr Lendy Spires
 
The Global Partnership for Development the Challenge We Face
The Global Partnership for Development the Challenge We FaceThe Global Partnership for Development the Challenge We Face
The Global Partnership for Development the Challenge We FaceDr Lendy Spires
 
Multilateral development banks part 2
Multilateral development banks part 2Multilateral development banks part 2
Multilateral development banks part 2Paul Rex
 
Microfinance in myanmar sector assessment (ifc-cgap) 2013 jan
Microfinance in myanmar   sector assessment (ifc-cgap)   2013 janMicrofinance in myanmar   sector assessment (ifc-cgap)   2013 jan
Microfinance in myanmar sector assessment (ifc-cgap) 2013 janKaungHtetZawSMU
 
Annual financial-report-2006
Annual financial-report-2006Annual financial-report-2006
Annual financial-report-2006ahli bank
 
The Global Sustainable Competitiveness Report 2020
The Global Sustainable Competitiveness Report 2020The Global Sustainable Competitiveness Report 2020
The Global Sustainable Competitiveness Report 2020SolAbility
 

Similar to Annual report2012 en (20)

Performance Evaluation, Criticism of the World Bank and Cost Benefit Analysis...
Performance Evaluation, Criticism of the World Bank and Cost Benefit Analysis...Performance Evaluation, Criticism of the World Bank and Cost Benefit Analysis...
Performance Evaluation, Criticism of the World Bank and Cost Benefit Analysis...
 
Microfinance in Myanmar Sector Assessment
Microfinance in Myanmar Sector AssessmentMicrofinance in Myanmar Sector Assessment
Microfinance in Myanmar Sector Assessment
 
Microfinance in myanmar sector assessment
Microfinance in myanmar sector assessmentMicrofinance in myanmar sector assessment
Microfinance in myanmar sector assessment
 
Enabling Poor Rural People to Overcome Poverty
 Enabling Poor Rural People to Overcome Poverty  Enabling Poor Rural People to Overcome Poverty
Enabling Poor Rural People to Overcome Poverty
 
Evaluacion del fmi deficiencia de capital de la banca espanola
Evaluacion del fmi  deficiencia de capital de la banca espanolaEvaluacion del fmi  deficiencia de capital de la banca espanola
Evaluacion del fmi deficiencia de capital de la banca espanola
 
Informe FMI sobre Sector financiero español
Informe FMI sobre Sector financiero españolInforme FMI sobre Sector financiero español
Informe FMI sobre Sector financiero español
 
States of Fragility report
States of Fragility reportStates of Fragility report
States of Fragility report
 
Some Evolving Trends at the World Bank
Some Evolving Trends at the World BankSome Evolving Trends at the World Bank
Some Evolving Trends at the World Bank
 
Some evolving-trends-at-the-world-bank
Some evolving-trends-at-the-world-bankSome evolving-trends-at-the-world-bank
Some evolving-trends-at-the-world-bank
 
The Global Partnership for Development: The Challenge We Face
The Global Partnership for Development: The Challenge We FaceThe Global Partnership for Development: The Challenge We Face
The Global Partnership for Development: The Challenge We Face
 
The Global Partnership for Development the Challenge We Face
The Global Partnership for Development the Challenge We FaceThe Global Partnership for Development the Challenge We Face
The Global Partnership for Development the Challenge We Face
 
Multilateral development banks part 2
Multilateral development banks part 2Multilateral development banks part 2
Multilateral development banks part 2
 
Web ar12
Web ar12Web ar12
Web ar12
 
Microfinance in myanmar sector assessment (ifc-cgap) 2013 jan
Microfinance in myanmar   sector assessment (ifc-cgap)   2013 janMicrofinance in myanmar   sector assessment (ifc-cgap)   2013 jan
Microfinance in myanmar sector assessment (ifc-cgap) 2013 jan
 
Annual financial-report-2006
Annual financial-report-2006Annual financial-report-2006
Annual financial-report-2006
 
Cr1336
Cr1336Cr1336
Cr1336
 
World bank
World bankWorld bank
World bank
 
Lenses Clocks Web
Lenses  Clocks WebLenses  Clocks Web
Lenses Clocks Web
 
World Bank
World BankWorld Bank
World Bank
 
The Global Sustainable Competitiveness Report 2020
The Global Sustainable Competitiveness Report 2020The Global Sustainable Competitiveness Report 2020
The Global Sustainable Competitiveness Report 2020
 

Annual report2012 en

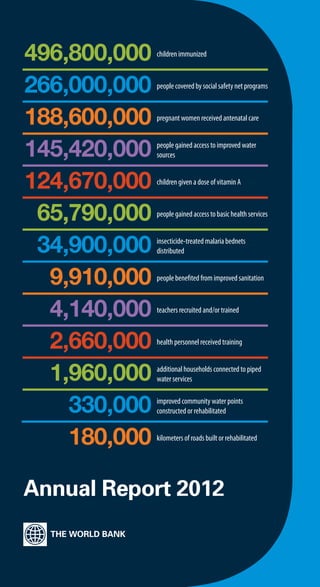
  • 1. 496,800,000 children immunized 266,000,000 people covered by social safety net programs 188,600,000 pregnant women received antenatal care 145,420,000 people gained access to improved water sources 124,670,000 children given a dose of vitamin A 65,790,000 people gained access to basic health services 34,900,000 insecticide-treated malaria bednets distributed 9,910,000 people benefited from improved sanitation 4,140,000 teachers recruited and/or trained 2,660,000 health personnel received training 1,960,000 additional households connected to piped water services 330,000 improved community water points constructed or rehabilitated 180,000 kilometers of roads built or rehabilitated Annual Report 2012 Annual Report 2012
  • 2. The World Bank is committed to achieving and communicating results. In its ongoing dedication to overcoming poverty and creating opportunity for people in developing countries, the Bank is making progress both internally and in the field, and it continues to improve the way it serves its client countries. This year the Annual Report showcases the World Bank Corporate Scorecard, which includes a snapshot of country results achieved by partner countries with support from the Bank. As we are fast approaching 2015, the target year for reaching the Millennium Development Goals (MDGs), the inclusion of results indicators this year is particularly relevant. On the cover of this report, you will see some results that our partner countries achieved through Bank-supported projects around the world. These results, accomplished mostly over the past decade, illustrate the efforts of the International Bank for Reconstruction and Development (IBRD) and the International Development Association (IDA), which together comprise the World Bank. We encourage you to read the chapters on the enclosed CD-ROM to learn more about the World Bank’s work; its activities and outcomes in the six regions; specific results throughout the developing world over time; comprehensive lending data and a World Bank lending presentation; and full financial statements. Multiple links are provided throughout the text to connect you with even more information. We invite you to visit the websites for the Annual Report, Corporate Scorecard—with full indicator definitions—and Results to broaden your understanding of how the World Bank works with its member countries: worldbank.org/annualreport/2012 corporatescorecard.worldbank.org worldbank.org/results
  • 3. Contents Message from Robert B. Zoellick .........................................................1 Message from Dr. Jim Yong Kim ..........................................................3 Message from the Board of Executive Directors ...................................4 The World Bank’s Commitment to Results: The Corporate Scorecard .....................................................................7 Tier I: Development Context..........................................................8 Tier II: Country Results Supported by the Bank ...........................10 Tier III: Development Outcomes and Operational Effectiveness ...............................................................................12 Tier IV: Organizational Effectiveness and Modernization .............14 The World Bank Group Affiliates ........................................................16 The Role of IBRD ................................................................................16 The Role of IDA ..................................................................................18 Operational Summary .......................................................................20 World Bank Lending by Theme and Sector ........................................22 This Annual Report, which covers the period from July 1, 2011, to June 30, 2012, has been prepared by the Executive Directors of both the International Bank for Reconstruction and Development (IBRD) and the International Development Association (IDA)—collectively known as the World Bank—in accordance with the respective bylaws of the two institutions. Dr. Jim Yong Kim, President of IBRD and IDA and Chairman of the Board of Executive Directors, has submitted this The World Bank Annual Report 2012 CD-ROM Contents report, together with the accompanying administrative budgets and audited financial statements, to the Board of Governors. The World Bank Annual Report 2012 (booklet), in 8 languages Responding with Global Knowledge and Experience, in 8 languages All dollar amounts used in this Annual Report are current U.S. dollars The Regions unless otherwise specified. As a result of rounding, numbers in tables may not add to totals, and percentages in figures may not add to World Bank for Results 2012 100. Throughout this report, the terms “World Bank” and “Bank” refer Financial Statements to IBRD and IDA. “World Bank Group” refers collectively to IBRD, IDA, Income by Region IFC, MIGA, and ICSID. Lending Data Annual Reports for the International Finance Corporation (IFC), New Operations Approved the Multilateral Investment Guarantee Agency (MIGA), and the Organizational Information International Centre for Settlement of Investment Disputes (ICSID) are published separately. World Bank Lending Presentation
  • 4. Annual Report 2012 Message from Robert B. Zoellick The past five years have been a time of testing for the World Bank Group and our ability to respond to the needs of our clients. Developing and developed countries have been challenged by the triple threat of the food, fuel, and financial crises. They’ve faced hunger, poverty, joblessness, and debt—an economic, social, and human crisis with political implications. Through these difficult times, the World Bank Group has stepped up to support our clients with flexibility, speed, innovation, and a focus on results. Out of challenge, we have looked for opportunity and hope. The World Bank Group’s shareholders have supported our priorities and performance with first-rate financial support. In 2007 and 2010, two record-breaking IDA replenishments raised more than $90 billion. In 2010, shareholders backed the IBRD’s first capital increase in more than 20 years. Today, we have a well-resourced Bank with an AAA rating. We have been modernizing multilateralism for a world economy with multiple poles of growth and democratizing development through greater openness and accountability, sharing knowledge and information. We are laying the foundations for expanding social accountability, fighting corruption, and building better governance. We have maintained our focus on the poor in all regions, especially Africa, emphasizing the need for fiscally responsible human safety nets to protect the most vulnerable. At the same time, we have customized new products for the middle-income countries that are increasingly important drivers of growth. Our agenda has included gender equality, food security, climate change and biodiversity, infrastructure investment, disaster prevention, financial innovation, and inclusion. The World Bank Group has paid special attention to the central role of the private sector in development. We are supporting the enabling environment for investment and private sector activity; extending financing to small and medium-sized businesses and microfinance; supporting trade finance; promoting greater attention to public-private partnerships; and encouraging investment in countries that need it the most, especially conflict-affected and fragile states. In fiscal 2012, the World Bank Group committed $52.6 billion in loans, grants, equity investments, and guarantees to its members and to private businesses. IBRD commitments totaled $20.6 billion, compared with $26.7 billion in 2011. IDA, the Bank’s fund for the poorest countries, made commitments of $14.8 billion, compared with $16.3 billion in 2011. This Annual Report incorporates the World Bank Corporate Scorecard, a focused snapshot of the Bank’s overall performance. Its purpose is to help Management and the Board of Executive Directors to evaluate progress and pinpoint programs and initiatives that require improvement. Results are at the core of the Scorecard. You can read about many of the Bank’s achievements in the “World Bank for Results 2012” chapter on the CD-ROM that accompanies the printed version of this Annual Report. This year, we have placed the 1
  • 5. The World Bank majority of our content—such as the Bank’s response to the global economic crisis and the six regional briefs—in electronic formats, to reflect readership preference, reduce paper, and lower costs. One important area of the Bank’s results is in “Gender Equality and Development”—the theme of World Development Report 2012. The lives of girls and women have changed dramatically over the past decades: today, more girls and women are literate, in school, in the labor force, and living longer than ever before. Yet women still fall behind in earning and productivity, pre- and post-natal care, and in the strength of their voices in society. The main message of the Report is that gender equality is both a core development objective in its own right as well as smart economics—enhancing productivity and improving prospects for the next generation. The report points to priority areas for policy going forward, including closing gender gaps in female mortality, education, access to economic opportunities, and voice and influence within society. The World Bank’s staff are tackling these and other challenges with new and innovative tools. They range from PforR (Program for Results), a lending instrument that specifically ties funding to results; to the OKR (Open Knowledge Repository), an open-access home for our research outputs and knowledge products; to SABER (Systems Approach for Better Education Results), a global information base that will help guide education system reform. This year’s Annual Report showcases how these and other programs have been central to helping us better support our clients’ needs over the past year. This marks my last message to you as President of the World Bank Group. I want to thank our Governors, Board of Executive Directors, and other partners for their guidance and support in advancing the work of this vital institution. Most of all, I want to thank the Bank Group’s leadership team and the committed, hard-working, and thoughtful staff. You are the ones who bring the work of development to life, in all quarters of the globe. It has been my privilege to serve with you. Robert B. Zoellick President of the World Bank Group and Chairman of the Board of Executive Directors 2007–2012 2
  • 6. Annual Report 2012 Message from Dr. Jim Yong Kim I am pleased to transmit the 2012 Annual Report of the World Bank. This report highlights the achievements and effectiveness of the institution, despite a challenging global economic environment. It also underscores the importance of collaboration across the World Bank Group and working with external partners to advance our shared goal of building prosperity and eradicating poverty. Today, the World Bank Group has a unique opportunity to accelerate inclusive and sustainable growth and social progress. We are continuing to support our clients as they respond to immediate pressures, especially through helping countries develop cost-effective social safety nets. But we are also well positioned to assist countries as they design and implement longer-term development strategies through our lending, knowledge, experience, and expertise. I look forward to working with the Board, our partners and clients, as well as the Bank Group’s dedicated staff in Washington, DC, and around the world. Our mission remains more important than ever—to help developing countries respond to immediate pressures, as well as look toward future opportunities. It is a privilege to undertake this great work. Dr. Jim Yong Kim President of the World Bank Group and Chairman of the Board of Executive Directors 3
  • 7. The World Bank Annual Report 2012 From left to right (standing) Rogerio Studart, Ingrid Hoven, Agapito Mendes Dias, Merza Hasan, Piero Cipollone, Jorg Frieden, Vadim Grishin, Marie-Lucie Morin, Shaolin Yang, Marta Garcia Jauregui, Hekinus Manao, Sid Ahmed Dib (Alternate), Ruud Treffers, Konstantin Huber, In-Kang Cho (Alternate), Hassan Ahmed Taha, Mukesh N. Prasad; (seated) Ian Solomon, Felix Alberto Camarasa, Ambroise Fayolle, Susanna Moorehead, Abdulrahman Almofadhi, Anna Brandt, Renosi Mokate, Nobumitsu Hayashi. Message from the Photo: Frank Vincent Board of Executive Directors The 25 resident Executive Directors are responsible for the conduct of the Bank’s The Independent Evaluation Group (IEG) reports directly to the Board of Executive general operations under delegated powers from the Board of Governors. As Directors, providing independent advice on the relevance, sustainability, and impact provided in the Articles of Agreement, five Executive Directors are appointed by of operations. The Board also monitors the compliance of projects with operational single countries having the largest number of shares, with the rest elected by other policies and procedures through the independent Inspection Panel, which also member countries to form constituencies in an election process every two years. reports to the Board. (See http://worldbank.org/ieg and http://worldbank.org/ The Board considers and decides on the International Bank for Reconstruction inspectionpanel.) and Development (IBRD) loan and guarantee proposals and the International Development Association (IDA) credit, grant, and guarantee proposals made by Board Achievements of 2012 the President. Executive Directors fulfill an important role in guiding the general Executive Directors continued to exercise their oversight of the institution amid a operations of the Bank and its strategic direction, representing the evolving challenging global economic outlook, emphasizing reforms to advance poverty perspectives of member countries on the global role of the Bank, as well as clients’ reduction and inclusive growth, as well as support for crisis resilience. The Board experience. They are also responsible for presenting to the Board of Governors an considered a number of documents key to these concerns. These documents audit of accounts, an administrative budget, and The World Bank Annual Report on included the World Development Report 2012: Gender Equality and Development, fiscal year results, operations, and policies of the Bank. and the report “Safety Nets Work: During Crisis and Prosperity,” which concentrates Executive Directors also serve on one or more standing committees: the on improving the design and efficiency of existing social safety net programs and Audit Committee, Budget Committee, Committee on Development Effectiveness, creating new ones where needed. Executive Directors also looked forward to the Committee on Governance and Administrative Matters, and Human Resources World Development Report 2013: Jobs. Committee. The Executive Directors’ Steering Committee, an informal advisory body, Directors discussed progress toward the Millennium Development Goals (MDGs) also meets regularly. in the Global Monitoring Report: Food Prices, Nutrition, and the MDGs. In addition, Directors periodically visit member countries to review Bank assistance in they discussed key reform efforts, such as the Open Data, Open Knowledge, progress. They meet a wide range of stakeholders, including government officials, Open Solutions Initiative described in the report “Update on the Bank’s Business beneficiaries, representatives of nongovernmental organizations, other development partners, and the business community, as well as Bank staff. In October 2011 and February and May of 2012, Directors visited countries in Europe and Central Asia, South Asia, and West Africa. 4 5
  • 8. The World Bank Modernization: Results, Openness, and Accountability.” The Board also gave its attention to the ongoing ministerial-level dialogue on sustainable development in support of the Rio+20 and G-20 processes, and welcomed the report “The World Bank Group Innovations in Leveraging the Private Sector for Development.” Executive Directors further supported drought and famine relief in the Horn of Africa with funds from the Crisis Response Window and affirmed their commitment to implementing the New Deal for Engagement in Fragile States, and to the MDGs, especially in lagging regions, fragile states, and for vulnerable and excluded populations. Executive Directors selected Dr. Jim Yong Kim as President for a five-year term beginning on July 1, 2012. Dr. Kim is President of the World Bank Group and Chairman of the Board of Executive Directors. The Board approved approximately $35.3 billion in financial assistance in fiscal 2012, comprising about $20.6 billion in IBRD lending and $14.8 billion in IDA support. Executive Directors also reviewed 49 country assistance strategy products, 41 of which were prepared jointly with the International Finance Corporation (IFC). The Board approved an administrative budget for the World Bank of just under $1.9 billion for fiscal 2013. (See http://worldbank.org/boards.) 6
  • 9. Annual Report 2012 The World Bank’s Commitment to Results: The Corporate Scorecard The Corporate Scorecard provides information on the Bank’s overall performance and results achieved by its clients. The Scorecard facilitates dialogue between Management and the Board on progress made and areas that need attention. Introduced two years ago, the four-tier Scorecard covers the full spectrum of IBRD and IDA activities. Tier I provides the Global Development Context—the indicators show the long-term development outcomes that countries are achieving, and provide the context and direction for the Bank’s work. These high-level outcomes cannot be attributed directly to the Bank, because countries and their development partners all contribute to these achievements over the long term through a combination of multisector interventions, actions, and policy decisions. These indicators are also affected by external factors such as global crises. Tier II is Country Results Supported by the Bank. This tier highlights development results that countries have achieved with Bank support. Tier III, Development Outcomes and Operational Effectiveness, provides information on the effectiveness of the Bank’s operations and services. Organizational Effectiveness and Modernization, Tier IV, assesses how well the Bank is functioning and adapting to better support countries in achieving results. In addition, the Bank operates a comprehensive web-based results reporting system. I Development Context What is the development progress in Bank client countries as a group? Growth, Jobs, and Poverty Institutions and Governance Human Development and Gender Sustainable Development RESULTS Finance, Private Sector Development, and Trade Country Results Supported by the Bank II How is the Bank supporting countries in achieving results? Institutions and Governance Y Human Development and Gender G Sustainable Development G Finance, Private Sector Development, and Trade G III Development Outcomes and Operational Effectiveness Is the Bank managing the performance of its activities effectively to achieve results? Development Outcomes Y Lending Operations Y PERFORMANCE Knowledge Activities G Use of Country Systems G IV Organizational Effectiveness and Modernization Is the Bank managing skills, capacity, resources, and processes efficiently? Is business modernization on track? Resources and Alignment G Capacity and Skills Y Business Modernization Y Sector Actions related to Post-Crisis Directions G LEGEND G Majority of the indicators in the group show improvement or are on-track. Y No clear trend; while some indicators show improvement, others show decline or no change. R Majority of the indicators in the group show declines or are off-track. NA There is insufficient data or there are no trends for the indicators in the group. For Tier I, color-coded traffic lights are not assigned since Tier I provides overall development context. For Tier II, the Summary table presents overall ratings based on management assessment of progress of Bank-supported activities. Ratings are not assigned to individual indicators in the detailed table since these are driven by country demand. 7
  • 10. The World Bank Annual Report 2012 Tier I: Development Context Tier I: The latest data on poverty shows that for BASELINE CURRENT LINKAGES INDICATORS MDG TARGETS 1990–2015 the first time, in every region of the developing Value Year Value Year PCD MDG world, the number of poor declined, and GROWTH, JOBS, AND POVERTY despite recent crises, global poverty overall Population below US$ 1.25 (PPP) a day+ (%) 31.1 2002 22.7 2008 1 MDG1 Halve from the baseline of 42.3%, 1990 continued to fall. A preliminary World Bank + survey-based estimate for 2010 on a much GDP per capita (constant 2000 US$) 1,657 2006 2,080 2011 1,2 smaller sample indicates that the global Domestic credit to private sector (% of GDP) 55.2 2005 74.7 2011 1,2 poverty rate at $1.25 a day fell to less than half Employment to population ratio (15+) (%) 62.1 2005 61.2 2010 1,2 MDG1 its 1990 value indicating the first Millennium Ratio of female-to-male labor force participation+ (%) 68.4 2006 67.5 2010 1,2 MDG3 Development Goal (MDG) target of cutting the extreme poverty rate to half its 1990 level INSTITUTIONS AND GOVERNANCE was already achieved before 2015. Developing State Institutions with adequately established/differentiated power structure (scale: 1–10) 6.2 2006 6.3 2012 4 countries hit numerous other strides. Average Effective and accountable government (scale: 0–7) 2.89 2006/07 3.20 2010 4 annual GDP per capita in developing countries Public access to information (scale: 0–100) 50.01 2007 56.94 2010/11 4 increased. Gender parity in primary and Level of statistical capacity (scale: 0–100) 66 2005 67 2011 4 secondary schools improved in 2010. By 2010, nearly 86 percent of the world’s population had HUMAN DEVELOPMENT AND GENDER access to improved drinking water. Reduce by two-thirds from the baseline These global trends mask significant Under 5 mortality rate+ (per 1,000 live births) 70 2006 63 2010 1,5 MDG4 of 100, 1990 variations between and within countries. The Prevalence of HIV, female (% ages 15–24) 0.8 2009 0.8 2009 1,5 MDG6 Halt by 2015 and begun to reverse poorest population groups remain vulnerable, Reduce by three-fourths from the baseline and only limited progress has been made in Maternal mortality ratio+ (per 100,000 live births) 290 2005 230 2010 1,5 MDG5 of 440, 1990 employment, governance, and biodiversity, as Prevalence of underweight children + (% children under 5yrs) 20.1 2005 17.7 2010 1,5 MDG1 well as other priority areas. Maternal mortality Primary school completion rate + (% of relevant age group) 85.1 2005 89.2 2010 1,2 MDG2 100% (baseline of 69%, 1991) and child mortality are falling significantly short of their MDG targets. The food, fuel, and Secondary school enrollment rate (%, gross) 60.7 2005 66.7 2010 1,2 financial crises over the past four years at times Gender parity index in primary and secondary education+ (%) 94.4 2005 96.9 2010 1,2 MDG3 100% (baseline of 84% 1991) caused sharp negative impacts on vulnerable SUSTAINABLE DEVELOPMENT populations and slowed the rate of poverty Infrastructure reduction in some countries. Paved roads (% of total roads) 31.6 1999–03 50.6 2005–09 1,2 Halve proportion of people without access Access to an improved water source+ (% of population) 83.4 2005 86.4 2010 1,2 MDG7 (baseline of 28%, 1990) Legend Halve proportion of people without access Access to an improved sanitation facility+ (% of population) 53.2 2005 56.4 2010 1,2 MDG7 LINKAGES (baseline of 57%, 1990) Household electrification rate + (% of households) [56.3] 2004 [61.3] 2008 1,2 PCD 1–5 Linkages to Post-Crisis Directions: Mobile cellular telephone subscriptions+ (per 100 people) 33 2006 73 2010 1,2 MDG8 1. Target the Poor and Vulnerable 2. Create Opportunities for Growth Agriculture Productivity and Food Security 3. Promote Global Collective Action Cereal yield (kg per hectare) 2,894 2006 3,110 2010 1,2,5 4. Strengthen Governance 5. Manage Risk and Prepare for Crisis Agriculture value added per worker (constant 2000 US$) 685 2006 761 2010 1,2,5 Climate Change and Environment MDG + Linkage to the Millennium Development Goals. CO2 emissions (kg per 2005 US$ of GDP) 0.65 2005 0.60 2008 3 MDG7 Protected terrestrial areas (% of total surface area) 12.0 2006 12.1 2010 1,3 MDG7 DATA Average annual deforestation (%) 0.3 1990–00 0.2 2000–10 1,3 MDG7 [ ] IDA only + Indicators used in proposed IDA16 Results FINANCE, PRIVATE SECTOR DEVELOPMENT, AND TRADE Measurement System Male–female gap in the population with an (% of population 15+) 9.7 2011 9.7 2011 1,2 account at a formal financial institution Note: For Tier I, color-coded traffic lights are Trade logistics performance index: Overall+ (scale: 1 = low, 5 = high) 2.5 2007 2.6 2012 1,2,3 MDG8 not assigned because Tier I provides the overall development context in IBRD/IDA eligible countries. Trade diversification 1,2,3 MDG8 • Product export diversification (index: 0–1) 0.24 2005 0.21 2009 • Market diversification (index: 0–1) 0.23 2005 0.21 2009 Time required for business start-up+ (days) 50 2007 36 2011 2 8 9
  • 11. The World Bank Annual Report 2012 Tier II: Country Results Supported by the Bank Tier II: The Bank provides financial resources, BASELINE CURRENT PCD INDICATORS TYPE shares knowledge and analysis, supports Value Year Value Year LINKAGE institutions and country capacity, and facilitates SUPPORT TO INSTITUTIONS AND GOVERNANCE partnerships and knowledge exchanges among developing countries to help them address Countries with strengthened national statistical systems (number) Outcome 6 FY07 13 FY12 2,4 development challenges. The Bank supports Countries with Bank-supported programs on asset, liability, and risk management (number) Output 64 FY10 85 FY12 2,4,5 countries’ national development priorities, which evolve as country circumstances change. Countries with strengthened Public Management Systems in: As a contributor and partner to country • Civil service and public administration (number) Outcome 28 FY12 28 FY12 2,4 development programs, the Bank, with offices in more than 120 countries, often • Tax policy and administration (number) Outcome 27 FY12 27 FY12 2,4 plays a coordinating and convening role • Public financial management (number) Outcome 57 FY12 57 FY12 2,4 for development partners. Tier II includes aggregate data collected through the • Procurement (number) Outcome 11 FY12 11 FY12 2,4 standardized sector indicators. The data show • Transparency and access to information (number) Output 61 FY11 72 FY12 2,4 country results supported by Bank operations. Results pertaining to human development, SUPPORT TO HUMAN DEVELOPMENT AND GENDER infrastructure, and access to services for the Teachers recruited and/or trained+ (millions) Outcome 0.95 FY11 1.1 FY12 1,2 poor and the vulnerable, as well as for creating opportunities for growth, are included. Bank Countries with Bank-supported learning assessments (number) Output 25 FY10 29 FY11 1,2 support has contributed to significant results People with access to a basic package of health services+ (millions) Outcome 18.2 FY11 19.5 FY12 1,5 achieved by its clients in education and health, especially those related to women and girls; in Children immunized+ (millions) Outcome 78 FY11 128 FY12 1,5 the sustainable development of infrastructure, Beneficiaries covered by social safety net programs (millions) Outcome 114.6 FY09 114.1 FY11 1,5 agriculture, and an environment for growth and access; and in finance and private sector Gender development. Pregnant women receiving antenatal care+ (millions) Outcome 17 FY11 50 FY12 1,5 Women and girls benefiting from social protection programs and other targeted schemes (millions) Outcome 78 FY12 78 FY12 1,2 Legend SUPPORT TO SUSTAINABLE DEVELOPMENT LINKAGES Infrastructure PCD 1–5 Roads constructed or rehabilitated + (kilometers) Output 56,504 FY11 57,252 FY12 1,2 Linkages to Post-Crisis Directions: 1. Target the Poor and Vulnerable People provided with access to improved water sources+ (millions) Outcome 39.6 FY12 39.6 FY12 1,2,5 2. Create Opportunities for Growth 3. Promote Global Collective Action People provided with access to improved sanitation+ (millions) Outcome 3.1 FY12 3.1 FY12 1,2,5 4. Strengthen Governance 5. Manage Risk and Prepare for Crisis Transmission and distribution lines constructed or rehabilitated (kilometers) Output 10,740 FY11 36,354 FY12 2 Generation capacity of conventional and renewable energy (megawatts) Output 3,719 FY11 5,040 FY12 2 TYPE Output indicators will be replaced by outcome People provided with access to electricity (millions) Outcome Data to be reported in 2013 1,2 indicators as country-level data become available. Agriculture Productivity and Food Security DATA Area provided with irrigation services (hectares, millions) Output 0.7 FY11 1.1 FY12 1,2,5 Year Represents the fiscal or calendar year when most Farmers adopting improved agricultural technology (number) Outcome 531,868 FY12 531,868 FY12 1,2,5 recent data were available. + Indicators used in proposed IDA16 Results Climate Change and Environment Measurement System Emission reduction with support of special climate finance instruments (annual, million tons CO2 equivalent) Outcome 315 FY12 315 FY12 3,5 Note: For Tier II, color-coded traffic lights are not Countries supported on natural disaster management (number) Output 76 FY10 74 FY12 1,2,3,5 assigned for individual indicators because they represent country results achieved with Bank support and are demand-driven. SUPPORT TO FINANCE, PRIVATE SECTOR DEVELOPMENT, AND TRADE The Bank first started data aggregation using Core Active number of microfinance loan accounts (millions) Outcome 31 FY12 31 FY12 1,2,5 Sector Indicators in IDA projects in FY10, and in FY11, it also included IBRD; therefore, the baseline and Countries that have applied trade-related diagnostic tools (number) Outcome 15 FY12 15 FY12 1,2,3 current values of some indicators are revised and have the same values. 10 11
  • 12. The World Bank Annual Report 2012 Tier III: Development Outcomes and Operational Effectiveness BASELINE CURRENT PCD PERFORMANCE Tier III: The Bank’s policies, systems, and INDICATORS STATUS processes reinforce its emphasis on results. Value Year Value Year LINKAGES STANDARD They include quality assurance; real-time III-A: DEVELOPMENT OUTCOME RATINGS monitoring of results and performance; and systematic self-evaluation, complemented by ex Satisfactory CAS/CPS completion+ (% IEG rating) 59.0 FY10 63.0 FY12 70 R post independent evaluation of strategies and Satisfactory (IBRD/IDA) operations outcomes at completion+ (% IEG rating) 76.8 FY08 70.5 FY10 Monitored Y activities by the Independent Evaluation Group (IEG). This tier shows the overall success of Bank • IBRD countries (% IEG rating) 76.5 FY08 70.5 FY10 80 R activities in achieving their development goals, as well as the Bank’s operations effectiveness, • IDA countries (% IEG rating) 77.0 FY08 70.0 FY10 75 Y including the quality and results orientation • Fragile situations (IBRD/IDA)* (% IEG rating) 82.6 FY08 71.4 FY10 70 G of its operations and knowledge activities, the performance of its lending portfolio, the Analytic and advisory activities objectives accomplished+ (%) 72.0 FY08 71.0 FY11 80 Y mainstreaming of gender in its operational work, client feedback, and its use of country systems. Clients’ impression of Bank effectiveness (scale: 0–10) 6.9 FY08 6.7 FY11 7 Y III-B: OPERATIONAL EFFECTIVENESS LENDING OPERATIONS Legend Ensuring Sound Quality and Portfolio Performance Quality of design for investment operations+ (%) 76 FY09 83 FY11 90 Y LINKAGES PCD 1–5 Quality of implementation support for investment operations (%) 83 FY09 78 FY11 90 Y Linkages to Post-Crisis Directions: 1. Target the Poor and Vulnerable Satisfactory implementation of active operations (%) 88 FY08 85.5 FY12 Monitored G 2. Create Opportunities for Growth 3. Promote Global Collective Action Gross disbursements (US$ billions) 19.6 FY08 30.8 FY12 Monitored G 4. Strengthen Governance 5. Manage Risk and Prepare for Crisis Disbursement ratio+ (%) 21.3 FY08 20.0 FY12 20 G Average time from approval to first disbursement (months) 12 FY08 7.51 FY11 Monitored G DATA * List of countries designated as “fragile” changes Recipient executed trust fund disbursements (US$ billions) 2.9 FY08 3.6 FY12 Monitored G every year + Indicator used in proposed IDA16 Results Managing Operations for Results, Monitoring, and Evaluation Measurement System Year Projects with indicators capturing all aspects of development objective+ (%) 83 FY09 91 FY12 100 Y Represents the fiscal or calendar year when data were reviewed. Implementation Completion and Results Reports reporting key results+ (%) 95 FY12 95 FY12 100 G Bank operations with beneficiary feedback (%) 22 FY11 22 FY11 Monitored NA PERFORMANCE STANDARDS Performance standards/targets are provided Gender Mainstreaming where available. Indicators are “monitored” where performance standard or target is not relevant. Blank Projects with gender-informed design+ (%) 60 FY10 80 FY12 1,2 55 Y cells show that some standards are not developed. CAS/CPS that draw on and discuss gender assessment findings+ (%) 60 FY08 100 FY12 1,2 100 G STATUS KNOWLEDGE ACTIVITIES G On-track. A meaningful increase from baseline, or for indicators with performance standards, Data freely accessed by global users (million visits) 1.7 2008 6.8 2011 Monitored G achievement meets or exceeds performance standard. Publications including research cited in professional journals (number) 18,000 2010 18,000 2010 Monitored G Y Watch. No meaningful increase or decrease, or for indicators with performance standards, USE OF COUNTRY SYSTEMS achievement is close to performance standard but does not meet performance standard. Use of country systems for procurement (PD survey)+ (%) 40 2006 55 2011 55 G R Off-track. A meaningful decrease from baseline, Use of country systems for financial management (PD survey) + (%) 42 2006 71 2011 65 G or for indicators with performance standards, achievement is not close to performance standard. Use of country monitoring and evaluation systems + (%) 72 FY09 77 FY12 Monitored G NA Not applicable. There is insufficient data to establish a trend, or there is no performance Collaborative analytical and advisory activities (PD survey)+ (%) 49 2006 59 2011 66 Y standard. Note: CAS=Country Assistance Strategy; CPS=Country Partnership Strategy; PD=Paris Declaration. 12 13
  • 13. The World Bank Annual Report 2012 Tier IV: Organizational Effectiveness and Modernization Tier IV: The Bank continues to work to improve BASELINE CURRENT PCD/M PERFORMANCE INDICATORS STATUS its organizational efficiency, to better align the Value Year Value Year LINKAGES STANDARD skills and capacity of its staff with its strategic priorities, and to implement its modernization IV-A. RESOURCES, SKILLS, AND BUSINESS MODERNIZATION agenda in order to become more responsive RESOURCES AND ALIGNMENT and accountable to its stakeholders. The Bank Client services as % of total cost (%) 62.6 FY08 63.2 FY12 Monitored G has been steadily improving its organizational effectiveness. With a real flat budget since fiscal Client services in fragile and conflict-affected areas (% of total cost) 4.9 FY08 5.9 FY12 Monitored Y 2006, it has made continuous improvements in Lending commitments (IBRD/IDA) (US$ billions) 24.7 FY08 35.3 FY12 Monitored G the way it allocates and uses its resources. Financial intermediary funds commitments (US$ billions) 4.69 FY08 6.08 FY12 Monitored NA Recipient executed trust fund commitments (US$ billions) 2.9 FY08 3.9 FY12 Monitored G Legend Share of knowledge services funded by trust funds (%) 31.6 FY08 45.1 FY12 Monitored Y LINKAGES Use of trust funds to support IBRD/IDA lending preparation PCD 1–5 (%) 10.3 FY08 14.9 FY12 Monitored Y and implementation support Linkages to Post-Crisis Directions: CAPACITY AND SKILLS 1. Target the Poor and Vulnerable 2. Create Opportunities for Growth Staff diversity (index) 0.85 FY08 0.89 FY12 1.00 Y 3. Promote Global Collective Action 4. Strengthen Governance Staff mobility (%) 4.39 FY08 4.39 FY12 Monitored Y 5. Manage Risk and Prepare for Crisis M = Business Modernization Staff engagement (%) 78 FY08 80 FY10 Monitored Y BUSINESS MODERNIZATION DATA + Indicator used in proposed IDA16 Results Products and Services for Results Measurement System Lending for program results (number) 0 FY12-Q3 2 FY12-Q4 M Monitored NA Year Represents the fiscal or calendar year when data were IBRD/IDA results stories and briefs (number on web) 131 2008 646 FY12 Monitored G reviewed. Sectors/themes with core indicators for both IDA and IBRD (number) 0 FY09 24 FY12 7 G PERFORMANCE STANDARDS Organization Performance standards and targets are provided where available. Indicators are “monitored” where the Openness: Access to Information requests with timely completion (%) 78 FY11 78 FY12 M Monitored G performance standard or target is not relevant. Blank cells show that some standards are not developed. Sector Board Connectivity: Professional staff time spent on tasks (%) 7.5 FY08 6.8 FY12 M 10 R in other Bank units PROJECTIONS Decentralization: Services for clients managed by staff based in (%) 40.6 FY08 44.4 FY12 M Monitored Y Projections are based on the current estimation of client countries+ future client demands. Processes and Systems for Flexibility and Efficiency Projects with new risk framework with fast processing (%) 45 FY11 38 FY12 M Monitored Y STATUS G On-track. A meaningful increase from baseline, Speed of preparation from Concept Note to Approval+ (months) 17 FY08 14 FY12 M 12 months Y or for indicators with performance standards, achievement meets or exceeds performance Average cost of preparing a lending project+ (average, US$) 359,000 FY08 357,000 FY12 M Monitored G standard. Y Watch. No meaningful increase or decrease, Average annual cost supporting project implementation+ (average, US$) 115,000 FY08 132,000 FY12 M Monitored G or for indicators with performance standards, achievement is close to performance standard but Budget flexibility at the start of the fiscal year (%) 3.2 FY08 3.1 FY13 5 R does not meet performance standard. R Off-track. A meaningful decrease from baseline, IV-B. SECTOR ACTIONS RELATED TO POST-CRISIS DIRECTIONS PROJECTIONS or for indicators with performance standards, Support to agriculture and related sectors achievement is not close to performance standard. (average, US$ billions/year) 2.9 FY06–08 4.3 FY10–12 1,2,5 4.5–6.4 (2010–12) Y NA Not applicable. There is insufficient data to (IBRD, IDA, SPF) establish a trend, or there is no performance Support to sustainable infrastructure standard. (average, US$ billions/year) 8.2 FY04–07 19.5 FY09–12 1,2,3 Monitored G (IBRD, IDA, GEF, RETF, SPF) Support to health, nutrition, and population (average, US$ billions/year) 1.5 FY04–07 2.4 FY11–12 1,4 2.0–3.0 (2011–12) G (IBRD, IDA) Support to education sector (average, US$ billions/year) 1.0 FY95–09 1.7 FY10–12 1,2 1.1 (2010–15) G (IDA) 14 15
  • 14. The World Bank Annual Report 2012 The World Bank Group Affiliates themes receiving the highest share of commitments were Financial and Private Sector Development (16 percent), followed by Public Sector Governance (13 percent) and The institutions of the World Bank Group are the International Bank for Reconstruction Human Development (13 percent). and Development (IBRD) and the International Development Association (IDA), which IBRD also offers financial products that allow clients to efficiently fund their together comprise the World Bank; the International Finance Corporation (IFC); the development programs and manage risks related to currency, interest rates, Multilateral Investment Guarantee Agency (MIGA); and the International Centre for commodity prices, and natural disasters. In fiscal 2012, the Bank’s Treasury executed Settlement of Investment Disputes (ICSID). These organizations work together and U.S. dollar equivalent (USDeq) 2.5 billion in hedging transactions on behalf of member complement each other’s activities to achieve their shared goal of reducing poverty countries, including USDeq 2.3 billion in interest rate hedges and USDeq 149 million and improving lives. Collaboration among the affiliates is increasing as the Bank works in currency hedges (all local currency conversions). It also executed swap transactions more closely with the private sector. Each institution discloses its fiscal year highlights totaling USDeq 9.5 billion to manage the risks of its balance sheet. In addition, in a separate annual report. Treasury executed USDeq 269 million in swaps on behalf of the International Finance Facility for Immunisation. The Role of IBRD This global development cooperative is owned by 188 countries. IBRD works IBRD Resources with its members to achieve equitable and sustainable economic growth in their IBRD issues bonds in international capital markets and provides long-term loans to national economies and to find solutions to pressing regional and global problems middle-income countries. In fiscal 2012, IBRD raised USDeq 38.4 billion by issuing in economic development and in other important areas, such as environmental bonds in 23 currencies. Because of its standing in the capital markets and its sustainability. It pursues its overriding goal—to overcome poverty and improve financial strength, IBRD was able to borrow these large volumes on very favorable standards of living—primarily by providing loans, risk management products, and terms despite volatile market conditions. The Bank’s strength is based on IBRD’s expertise on development-related disciplines and by coordinating responses to prudent financial policies and practices, which help maintain its AAA credit rating. regional and global challenges. (See http://www.worldbank.org/ibrd.) IBRD’s equity primarily comprises paid-in capital and reserves. Under the terms of the general and selective capital increase resolutions approved by the Board of IBRD Financial Commitments and Services Governors on March 16, 2011, subscribed capital is expected to increase by $86.2 New lending commitments by IBRD were $20.6 billion, including 93 operations, in billion, of which $5.1 billion will be paid-in over a five-year period. As of June 30, fiscal 2012—significantly higher than the historical average ($13.5 billion in fiscal 2012, the cumulative increase in subscribed capital and the related paid-in amounts 2005–08), but less than the record $44.2 billion in fiscal 2010 when the crisis peaked, in connection with these capital increase resolutions totaled $15.3 billion and $0.9 and less than the $26.7 billion in fiscal 2011. Europe and Central Asia ($6.2 billion) and billion, respectively. Latin America and the Caribbean ($6.2 billion) received the largest shares of IBRD’s As a cooperative institution, IBRD seeks not to maximize profit but to earn enough new lending, followed by East Asia and Pacific ($5.4 billion). Commitments to the income to ensure its financial strength and sustain its development activities. Of fiscal Middle East and North Africa ($1.4 billion), South Asia ($1.2 billion), and Africa ($147 2012 allocable net income, the Executive Directors approved the addition of $390 million) followed. Among sectors, Public Administration, Law, and Justice received the million to the general reserve, and recommended to the Board of Governors the largest commitment ($5.4 billion), followed by Transportation ($3.4 billion), Energy transfer of $608 million to IDA. and Mining ($2.8 billion), and Health and Other Social Services ($2.5 billion). The Consistent with IBRD’s development mandate, the principal risk it takes is the country credit risk inherent in its portfolio of loans and guarantees. One summary measure of the Bank’s risk profile is the ratio of equity to loans and long-term FIGURE 1 investment assets, which is closely managed in line with the Bank’s financial and risk IBRD RATIO OF EQUITY TO LOANS AND LONG-TERM INVESTMENT ASSETS outlook. This ratio stood at 27.0 percent as of June 30, 2012. AS OF JUNE 30, 2012 PERCENT The Role of IDA 40 37.6 The World Bank’s fund for the poorest countries, IDA is the largest multilateral channel 34.3 of concessional financing to the world. Its funding supports countries’ efforts to boost 29.4 28.6 30 27.0 economic growth, reduce poverty, and improve the living conditions of the poor. In fiscal 2012, 81 countries were eligible to receive IDA assistance. 20 (See http://www.worldbank.org/ida.) 10 IDA Financial Commitments IDA commitments amounted to $14.8 billion in fiscal 2012, including $12.1 billion 0 FY08 FY09 FY10 FY11 FY12 in credits, $2.2 billion in grants, and $0.4 billion in guarantees. The largest share of resources was committed to Africa, which received $7.4 billion. South Asia ($5.3 16 17