
Recomendados
Más contenido relacionado
La actualidad más candente
La actualidad más candente (12)
Destacado
Destacado (7)
Similar a Gdp ppp
Similar a Gdp ppp (20)
Gdp ppp
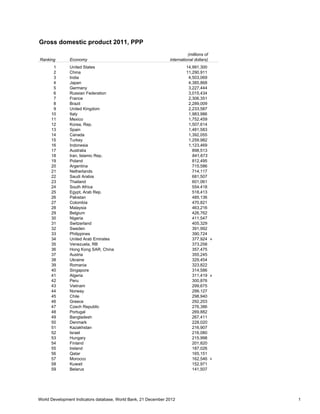
- 1. Gross domestic product 2011, PPP (millions of Ranking Economy international dollars) 1 United States 14,991,300 2 China 11,290,911 3 India 4,503,069 4 Japan 4,385,868 5 Germany 3,227,444 6 Russian Federation 3,015,434 7 France 2,306,351 8 Brazil 2,289,009 9 United Kingdom 2,233,587 10 Italy 1,983,986 11 Mexico 1,752,459 12 Korea, Rep. 1,507,614 13 Spain 1,481,583 14 Canada 1,392,055 15 Turkey 1,259,982 16 Indonesia 1,123,469 17 Australia 898,513 18 Iran, Islamic Rep. 841,673 19 Poland 812,495 20 Argentina 715,586 21 Netherlands 714,117 22 Saudi Arabia 681,507 23 Thailand 601,061 24 South Africa 554,418 25 Egypt, Arab Rep. 518,413 26 Pakistan 485,136 27 Colombia 470,821 28 Malaysia 463,216 29 Belgium 426,762 30 Nigeria 411,547 31 Switzerland 405,329 32 Sweden 391,992 33 Philippines 390,724 34 United Arab Emirates 377,924 a 35 Venezuela, RB 373,258 36 Hong Kong SAR, China 357,475 37 Austria 355,245 38 Ukraine 329,454 39 Romania 323,822 40 Singapore 314,586 41 Algeria 311,419 a 42 Peru 300,876 43 Vietnam 299,675 44 Norway 299,127 45 Chile 298,940 46 Greece 292,203 47 Czech Republic 276,386 48 Portugal 269,882 49 Bangladesh 267,411 50 Denmark 228,020 51 Kazakhstan 216,907 52 Israel 216,080 53 Hungary 215,998 54 Finland 201,820 55 Ireland 187,026 56 Qatar 165,151 57 Morocco 162,546 b 58 Kuwait 152,971 59 Belarus 141,507 World Development Indicators database, World Bank, 21 December 2012 1
- 2. Gross domestic product 2011, PPP (millions of Ranking Economy international dollars) 60 New Zealand 132,408 61 Slovak Republic 130,073 62 Iraq 127,365 63 Ecuador 127,136 64 Sri Lanka 116,484 65 Angola 116,133 66 Bulgaria 110,832 67 Syrian Arab Republic 107,378 68 Libya 105,819 a 69 Sudan 103,786 c 70 Tunisia 99,813 71 Dominican Republic 98,512 a 72 Uzbekistan 96,455 a 73 Ethiopia 93,960 74 Azerbaijan 92,295 75 Serbia 86,283 76 Croatia 85,800 77 Oman 81,639 78 Guatemala 72,718 a 79 Kenya 71,132 80 Tanzania 67,834 d 81 Lithuania 65,088 82 Lebanon 62,224 83 Yemen, Rep. 57,861 84 Costa Rica 57,459 a 85 Panama 55,670 a 86 Slovenia 55,310 87 Bolivia 51,440 88 Uruguay 50,792 89 Turkmenistan 48,093 a 90 Cameroon 47,247 91 Ghana 46,715 92 Uganda 46,412 93 Luxembourg 46,019 94 Macao SAR, China 42,835 95 El Salvador 42,538 a 96 Afghanistan 40,228 a 97 Latvia 39,004 98 Nepal 38,172 99 Jordan 36,876 100 Paraguay 36,131 101 Côte d'Ivoire 36,061 102 Bosnia and Herzegovina 34,057 103 Trinidad and Tobago 33,758 a 104 Cambodia 33,738 105 Honduras 31,382 a 106 Botswana 29,945 107 Bahrain 29,836 108 Estonia 29,474 109 Albania 28,514 110 Equatorial Guinea 26,073 111 Cyprus 25,965 e 112 Congo, Dem. Rep. 25,267 113 Senegal 25,115 114 Georgia 24,516 f 115 Gabon 24,320 116 Mozambique 23,339 117 Macedonia, FYR 23,235 118 Nicaragua 22,374 a World Development Indicators database, World Bank, 21 December 2012 2
- 3. Gross domestic product 2011, PPP (millions of Ranking Economy international dollars) 119 Burkina Faso 22,068 120 Zambia 21,838 121 Brunei Darussalam 21,011 122 Madagascar 20,584 123 Papua New Guinea 18,771 a 124 Mauritius 18,544 125 Congo, Rep. 18,049 126 Armenia 17,948 127 Lao PDR 17,544 128 Chad 17,525 129 Mali 17,283 130 Tajikistan 16,216 131 Namibia 15,755 132 Benin 14,712 133 Rwanda 14,030 134 Malawi 13,740 135 Mongolia 13,277 136 Kyrgyz Republic 13,212 137 Moldova 11,991 g 138 Haiti 11,859 a 139 Niger 11,683 140 Iceland 11,639 141 Guinea 11,492 142 Malta 11,432 143 Bahamas, The 11,102 a 144 Mauritania 9,044 145 Montenegro 8,492 146 Swaziland 6,468 147 Togo 6,458 148 Barbados 5,270 a 149 Sierra Leone 5,224 150 Burundi 5,179 151 Bhutan 4,316 152 Suriname 4,140 a 153 Fiji 4,131 154 Lesotho 3,736 155 Central African Republic 3,633 156 Gambia, The 3,213 157 Eritrea 3,167 a 158 Maldives 2,840 159 Guyana 2,594 a 160 Liberia 2,416 161 Belize 2,379 a 162 Seychelles 2,257 a 163 Cape Verde 2,050 164 St. Lucia 2,041 a 165 Djibouti 2,002 166 Guinea-Bissau 1,923 167 Timor-Leste 1,855 a 168 Antigua and Barbuda 1,657 a 169 Solomon Islands 1,614 a 170 St. Vincent and the Grenadines 1,172 a 171 Grenada 1,137 a 172 Vanuatu 1,093 a 173 St. Kitts and Nevis 914 a 174 Dominica 899 a 175 Comoros 837 176 Samoa 823 a 177 Tonga 511 a World Development Indicators database, World Bank, 21 December 2012 3
- 4. Gross domestic product 2011, PPP (millions of Ranking Economy international dollars) 178 Micronesia, Fed. Sts. 381 a 179 São Tomé and Principe 350 180 Palau 284 a 181 Kiribati 236 a American Samoa .. Andorra .. Aruba .. Bermuda .. Cayman Islands .. Channel Islands .. Cuba .. Curaçao .. Faeroe Islands .. French Polynesia .. Greenland .. Guam .. Isle of Man .. Jamaica .. Korea, Dem. Rep. .. Kosovo .. Liechtenstein .. Marshall Islands .. Monaco .. Myanmar .. New Caledonia .. Northern Mariana Islands .. Puerto Rico .. San Marino .. Sint Maarten (Dutch part) .. Somalia .. South Sudan .. St. Martin (French part) .. Turks and Caicos Islands .. Tuvalu .. Virgin Islands (U.S.) .. West Bank and Gaza .. Zimbabwe .. World 80,855,211 Low income 1,093,245 Middle income 36,463,627 Lower middle income 9,476,825 Upper middle income 26,981,255 Low & middle income 37,562,086 East Asia & Pacific 14,441,954 Europe & Central Asia 6,003,338 Latin America & Caribbean 6,964,792 Middle East & North Africa 2,321,022 South Asia 5,457,270 Sub-Saharan Africa 2,040,904 High income 43,518,850 Euro area 11,744,692 .. Not available. PPP is purchasing power parity; an international dollar has the same purchasing power over GDP as a U.S. dollar has in the United States. Note: Rankings include only those economies with confirmed PPP GDP estimates. Figures in italics are for 2010 or 2009. a. Based on regression; other PPP figures are extrapolated from the 2005 International Comparison Program benchmark estimates. b. Includes Former Spanish Sahara. c. Includes South Sudan. d. Covers mainland Tanzania only. e. Data are for the area controlled by the government of the Republic of Cyprus. f. Excludes Abkhazia and South Ossetia. g. Excludes Transnistria. World Development Indicators database, World Bank, 21 December 2012 4