Week 1. Basics of multimodal imaging and image processing. Functional magnetic resonance imaging.
1. 2012.10.30.
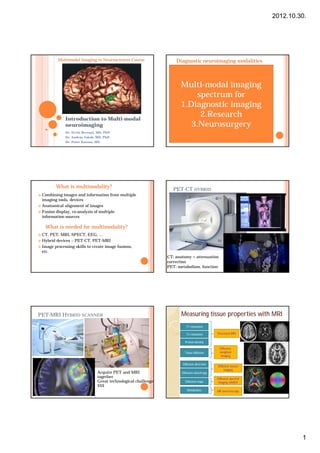
Multimodal Imaging in Neurosciences Course Diagnostic neuroimaging modalities
CT – Computed Tomography Structural MRI
Brain anatomy Fine brain anatomy
Stereotactic reference frame Vascular structure
Multi-modal imaging
Intra-operative imaging Diffusion, perfusion MRI
field
spectrum for
modalities, open MRI, low- Fine pathological
information
1.Diagnostic imaging
Positron Emission
MR Spectroscopy
Introduction to Multi-modal
2.Research
Tomography PET
Brain metabolism
Brain function
Brain metabolism
Biochemical mapping
neuroimaging 3.Neurosurgery
Electro encephalography,
Dr. Ervin Berenyi, MD, PhD Functional MR imaging fMRI
LORETTA,
Brain function
Dr. András Jakab, MD, PhD Magnetoencephalography
Dr. Peter Katona, MD
What is multimodality?
PET-CT HYBRID
Combining images and information from multiple
imaging tools, devices
Anatomical alignment of images
Fusion display, co-analysis of multiple
information sources
What is needed for multimodality?
CT, PET, MRI, SPECT, EEG, …
Hybrid devices – PET-CT, PET-MRI
Image processing skills to create image fusions,
etc.
CT: anatomy + attenuation
correction
PET: metabolism, function
PET-MRI HYBRID SCANNER Measuring tissue properties with MRI
T1 relaxation
T2 relaxation Structural MRI
Proton density
Diffusion-
Tissue diff i
Ti diffusion weighted
imaging
Diffusion direction
Diffusion tensor
imaging
Acquire PET and MRI Diffusion anisotropy
together Diffusion spectral
Great technological challenge Diffusion maps imaging, HARDI
$$$
Metabolites MR spectroscopy
1
2. 2012.10.30.
removed temporal lobe parts
OPTIC RADIATION
CORTICOSPINAL TRACT
VISUALIZATION OF STRUCTURE
Recidive tumor, 2 foci, purple and magenta
Markers on the skin
VISUALIZATION OF FIBERS
Part I.
Basics of fMRI and functional
pp g
mapping
Multimodal Imaging in Neurosciences Course
Functional MR Imaging
Dr. Ervin Berenyi, MD, PhD
Dr. András Jakab, MD, PhD
Dr. Peter Katona, MD
Brain functions – how to interpret COGNITIVE PROCESSING IN THE BRAIN
The synchronous activity of neuronal groups Primary sensory areas (somato-, auditory, etc.)
Cerebral cortex Secondary, tertiary, etc. sensory areas (i.e. visual: 5-9
Examples of brain functions levels) + Parallel processing (not
Visual processing Association areas purely hierarchical!)
Auditory processing
Memory functions, recall
„Association areas for higher cognitive functions”
Wernicke area Motor response behavior
response,
Broca area
Movement of limbs Somatosensory cortex (SI)
Emotional response:
e.g. human face Somatosensory cortex (SII)
Parietal association area
„not processing anything” -
default mode networks and „DLPFC – higher cognitive processing”
resting state networks
Drive, behavioral processing etc.
Speech motor center
2
3. 2012.10.30.
The brain never rests!
Default network Mapping neuronal function
Default mode network
Default state network
Task-negative network Electric activity of neurons
Electro encephalography EEG
Action potential, propagation of signal
Magnetoencephalography MEG
„Wandering and Wondering” Electric current – magnetic field variations
Posterior cingulate cortex
Precuneus Metabolic activity of neurons emission tomography
Positron
Prefrontal cortex Glucose metabolism (18F-FDG) PET
Daydreaming Blood supply of neurons
Synchronised areas fMRI
Vasodilatation, perfusion change
Age dependency
Diseases affecting it Rapid changes of cell compartments
Not dreaming! Cell swelling? fDTI
Fair DA, Cohen AL, Power JD et al. (2009). "Functional brain
networks develop from a 'local to distributed' organization". PLoS
Comput Biol 5 (5): e1000381
History
“[In Mosso’s experiments] the subject to be observed lay on a
delicately balanced table which could tip downward either at the head
or at the foot if the weight of either end were increased. The moment
emotional or intellectual activity began in the subject, down went the
balance at the head-end, in consequence of the redistribution of blood
in his system.”
-- William James, Principles of Psychology (1890)
Angelo Mosso
(1846-1910)
(1846 1910)
E = mc2 Zago et al. (2009) The Mosso
??? method for recording brain
pulsation: The forerunner of
functional neuroimaging.
Neuroimage
History
The first evidence for the coupling between energy
metabolism and brain blood perfusion (animals)
The blood volumen elevated during brain activity
Sir C. S. Sherrington, 1890
Seymour Kety & Carl Schmidt, 1948
Increased oxigen take-up
Sir Charles
Dilatation of blood vessels
Scott Sherrington
Near infrared spectroscopy
ea a e spec oscopy (1857 1952)
(1857-1952)
PET
fMRI (90’s): Seji Ogawa, Ken Wong
Cerebral Cortex. 12:225-233; 2002.
3
4. 2012.10.30.
Activity Increases Flow
Blood pressure
• sensory stimulation leads to
increased blood flow
• sciatic nerve, electronic
stimulation (0,2 V 5-10 Hz),
rats, automated video
dimension analyzer
Arteriole diameter Blood velocity
Data Source: Ngai et al., 1988, Am J Physiol
Figure Source, Huettel, Song & McCarthy, Functional Magnetic Resonance
I i
Summary of in vivo imaging methods
Structural imaging fMRI
CT
MRI
T1 – 3DT1 – „anatomical”
T2
FLAIR, DWI, etc.
Functional imaging
PET
fMRI
…..
Structural MRI Functional MRI
OK. Now show
me the trick.
Good spatial resolution = 0.6 – 1 mm Bad spatial resolution = 2 – 4 mm
Short scan time (a few minutes) Long scan time (10-30 minutes)
One time point is imaged Multiple time points, multiple scans
Good tissue contrast Bad tissue contrast
No image post-processing is required Post-processing is required
The result is robust The result depends on the patient, the
protocol and paradigm
4
5. 2012.10.30.
The hemoglobine
-Four globin chains
-Each chain contains a haem molecule
-Each haem has an iron atom in the center
(Fe)
-Each haem can absorb one oxygen
molecule (O2)
-oxy-Hgb (four O2) has DIAMAGNETIC
effect →it does not affect the magnetic
field ΔB
-deoxy-Hgb is PARAMAGNETIC → if
[deoxy-Hgb] ↓ → then local ΔB ↓
25
Source: http://wsrv.clas.virginia.edu/~rjh9u/hemoglob.html, Jorge Jovici
& Huettel, Song, McCarthy, Functional Magnetic Resonance Imaging
Measuring deoxy-hemoglobine
Diamagnetism and paramagnetism • During fMRI acquisitions, we get information of the brain’s deoxy-
hemoglobine content
Diamagnetism(oxy- & carbonmonoxyhemoglobine)
• The relative oxygenation changes with the deoxygenated hemoglobine
No magnetic momentum content
Has paired electrons
Paramagnetism (deoxyhemoglobine)
Magnetic momentum – atoms behave as small magnets
Has unpaired electrons
Seiji Ogawa
How does this work? The BOLD effect! HEMODYNAMIC RESPONSE
Blood Oxygen Level Dependent
The funcitonal activity is coded in the BOLD effect.
OxyHb and DeoxyHb- their MR
relaxation properties are different!
deoxyHb: paramagnetic!!!
Mxy
Signal
Mo sinθ
T2* task
T2* control
Stask
Scontrol ΔS
TEoptimum time
Source:, Huettel, Song & McCarthy, 2004,
Functional Magnetic Resonance Imaging Source: Jorge Jovicich
5
6. 2012.10.30.
Part II.
How to perform an fMRI?
p
End of Part I. – any questions?
The MRI recipe 1. Patient (water + fat = lot of spins) MRI sequences
2. Excite (Shout at the patient with a Image coded as waves, Fourier transformation is used to „decode” the raw
Repeat this! This is called SEQUENCE radiofrequency coil) signal and get an image
3. Wait until the excited spins „relax”
4. During relaxation, the spins (water + You can „excite” the spin system in numerous ways to have image signals,
fat =patient) shout back at you, they i.e. SPIN ECHO or GRADIENT ECHO sequences.
send an ECHO
5. You listen to the echo and record it GRADIENT ECHO SEQUENCES ARE SENSITIVE FOR
(this is the k-space acquisition) DEOXYHEMOGLOBINE CHANGES!
,
Human, made of
6. Decode the i l t image!
6 D d th signal, get i !
excitable spins (H
ECHO
proton spins)
How does echo planar imaging works?
Echo-planar imaging (SE-EPI, GRE-EPI)
T2 contrast
After one excitation, an entire slice is read out.
It is a fast MR imaging sequence
Has many artifacts, i.e. susceptibility
IMAOIS – www.imaios.com
6
7. 2012.10.30.
fMRI and all the tools
How to perform an fMRI scan? Checklist!
Can our MRI device perform fast EPI, what is the
field strength? 1.5T vs. 3T?
What are we interested in?
fMRI experiments are task-specific
It is necessary to construct a PARADIGM which „observes”
one specific brain function
Do
D we h have i
image processing skills?
i kill ?
$$$
Patient cooperative?
IQ, attention?
Do we have enough time?
Sedation, drugs, etc.
The first step: imaging the anatomy
Anatomical acquisition
T1 weighted anatomical images as references
• High resolution images (1x1x2.5 mm)
• 3D acquisition
VOXEL
• pl. 64 anatomical images ~ 5 perc (Volumetric Pixel)
Slice Thickness
e.g., 6 mm In-plane resolution
e.g., 192 mm / 64
= 3 mm
3
mm 6
SAGITTAL SLICE IN-PLANE
IN PLANE SLICE mm
3
mm
Number of Slices
e.g., 10
Matrix Size
e.g., 64 x 64
Field of View (FOV)
e.g., 19.2 cm
Paradigm and block design
Second step: the actual fMRI acquisition Functional images
T2*-weighted images fMRI ROI
• Image contrast relates to neuronal activity ~2 sec signal Time
• Low spatial resolution (3x3x5 mm) Course
• One volume of the brain is acquired in 2 seconds! (% change
• We acquire many volumes in time (4D), ie. 150
• Repeated scanning
Time Tasks
Statistical
… activation map
on T1 image
first volume
(2 sec to acquire) Time
Region of interest ~ 5 minutes
kijelölés (ROI)
7
8. 2012.10.30.
Interpreting fMRI results: TALAIRACH ATLAS
- 1988
LOCALIZATION - 1 SZEMÉLY
Variability of sulci - problematic Fathers of Localization (brain atlases)
Jean Talairach Gabor Szikla
(January 15, 1911, Perpignan
– March 15, 2007, Paris)
Source: Szikla et al., 1977 in Tamraz & Comair, 2000
Anatomical localization of activity: gyri and sulci How to display fMRI results?
gray matter
(dendrites & synapses)
white matter
(axons)
ANK
BA
Brain extraction Inflation
FISSURE
FUNDUS
Source: Ludwig & Klingler, 1956 in Tamraz & Comair, 2000
Creating 3D visualizations of the individual brain: Skull-stripping,
inflating the cortex
8
9. 2012.10.30.
Standardization of fMRI images to brain
Segmentation, filtering, masking atlases
Fuzzy thresholding Anisotropic filtering Only brain
Displaying fMRI fMRI display
Part III.
Examples and research applications
p pp
End of Part II. – any questions?
9
10. 2012.10.30.
What functions can we image using The logic of a „simple” fMRI experiment
fMRI?
Rest = empty screen
Paradigm-dependent!
Vision („vibrating checkboard”)
Audition (variable frequency stimuli)
Limb movement – active
Passive limb movement - infants Task1 Time Task 2
Memory (hometown walking test)
Speech
… and many others (but not everything!) The subject views an object, i.e.
apple „Scrambled” – image
Results: object recognition First images of visual activity
Flickering Checkerboard
OFF (60 s) - ON (60 s) -OFF (60 s) - ON (60 s) - OFF (60 s)
Source: Kwong et al., 1992
Kalanit Grill-Spector et al.
Motor paradigm of the left hand
CO-ACTIVATION OF V1 -> V2.. AFTER
VISUAL STIMULUS
10
11. 2012.10.30.
Lesion in the left precentral gyrus (malformation) – RED
Finger tapping test of the Hand movement activation: Yellow, CS tract: yellow
right hand
Source: Katona P., DEOEC Jakab, Katona et al.
HOMUNCULUS Left hand
Source: Berenyi, Emri, Jakab et al
Left foot Auditory activation
Task:
Listening
to
orders
Forrás: Berényi E,
Emri M. DEOEC Forrás: Berényi E, Emri M. DEOEC
11
12. 2012.10.30.
Late speech development – pathological
FREQUENCY PROGRESSION OF
localization of speech centers?
HUMAN AUDITORY CORTEX
J Neurophysiol. 91:1282-1296, 2004. Radiology. 2003;229:651-658.
Speech paradigm: say a word beginning Localizing swallowing movement
with a,b,c, etc.
Jakab A, Katona P et al. AJNR. 20:1520-0526. 1999.
12
14. 2012.10.30.
Patient history
A case of drug resistant epilepsy
8 yrs old right handed boy
Born on term from uneventful pregnancy
Szentágothai TK -
Semmelweis Egyetem
MR Kutatóközpont
fMRI in a Case of Childhood Epilepsy First seizures at 3.5 yrs
About the time of falling asleep starting with left hand twithcing then
generalizing
Later atypical absence seizures
EEG results
Normal EEG on the onset
Lajos R Kozak Later slow spike and wave activity developed with clinical abscence
MR Research Center, Semmelweis University, Budapest, Hungary Finally, electric status epilepticus during sleep (ESES), irregular high
amplitude spike and wave activity, during the whole night
Physical examination
Paresis on the left limbs
Patient history
Imaging
Smaller right hemisphere
On T1 weighted images (A-B)
widespread irregularities of the
cortical surface suggestive of
multiple small folds with abnormally
thick cortex,
irregular appearance of the gray
matter-white matter junction
tt hit tt j ti
suggestive of
polymicrogyria
On FLAIR images (C)
numerous high intensity foci
predominantly in the subcortical
white matter
Question: is the malformed
cortex functional?
Kozák et al., Clin Neurosci
2009;62(3–4):130–135.
fMRI #1
#1 fMRI #1
no result The reason for unsuccesful fMRI?
Imaging at 3T
Philips Achieva scanner Bad acquisition ?
TR=3000ms, TE=30ms, 500-700μV
FA=75°, 3x3x3mm2 voxels
(80x80 matrix, 240x240
Bad stimulation ?
FOV), axial slices, no gap, Overanesthetized ?
SENSE factor of 2
Block design paradigm,
WHAT WAS THE
24s movement, 24s rest PROBLEM WITH THE
• flexion/extension of fingers
~0.5-1Hz fMRI? Electric status
• left and right limb moved in
separate blocks epilepticus during
sleep (ESES) ?
movement
rest
Clonazepam was
the solution
Kozák et al., Clin Neurosci
2009;62(3–4):130–135.
14
15. 2012.10.30.
fMRI #2
#2 fMRI #2
#2
right hand movement pre- and postoperatively left hand movement pre- and postoperatively
Preop. Preop.
Postop Postop
Functional reorganization to the healthy hemisphere
Conclusions
Passive range-of-movement paradigms are
range-of-
considered useful for the mapping of sensory-
motor cortex in pediatric epilepsy patients
patients.
If fMRI fails in this patient population we have to
check if there is ongoing epileptic activity
during anesthesia
These paradigms are able to describe cortical
reorganization thus they have clear
reorganization,
prognostic value in a pre-operative setting
pre- setting.
Research with fMRI
Summary of facts so far
fMRI is based on the BOLD = Blood
Oxygen Level Dependent contrast
Neurovascular coupling
"...the single most critical piece of equipment
A stringent paradigm is required is still the researcher's own brain. All the
equipment in the world will not help us if we
(protocol)
( l) do not know how to use it properly, which
requires more than just knowing how to
Mapping brain activity can be operate it. Aristotle would not necessarily
have been more profound had he owned a
achieved in living humans laptop and known how to program. What is
badly needed now, with all these scanners
Many factors can influence the whirring away, is an understanding of exactly
what we are observing, and seeing, and
results measuring, and wondering about."
fMRI = localization -- Endel Tulving, interview in Cognitive
Neuroscience (2002, Gazzaniga , Ivry &
Mangun, Eds., NY: Norton, p. 323)
15
16. 2012.10.30.
A new localizationism? Example for a BAD fMRI experiment
The accepted application
~2 sec
Surgical planning
For cognitive neuroscience, localization
itself has INFERIOR significance
Popularity, factoid literature
Task 2: Subject observes a
3:
1:
noise + a screen
car on(control)
CAR Elmo Muppet
Time
The brain before the fMRI era
BAD INTERPRETATION OF FMRI RESULTS CAN
STILL MAKE A JOURNAL PUBLICATION?
- =
CAR against noise Elmo + CAR Elmo (negative
elmo)
Visual areas for „car Visual areas for „car + elmo Elmo Brain Area ??? Polyak, in Savoy, 2001, Acta Psychologica
observation” observation”
THE BRAIN AFTER FMRI (INCOMPLETE) Basic types of fMRI research
reaching and
pointing
Testing models, theories
Localize the activations after stimuli
motor
control
touch
retinotopic visual maps
eye
Activating networks after stimuli
movements
executive
grasping
Spatial encoding of the brain:
control motion
near head Retinotopy, somatotopy, frequency
memory orientation selectivity
coding
motion perception
Behavior and cognition
Diseases, i.e. psychiatry
scenes
moving bodies static
social cognition bodies
faces objects Inter-species comparisons
16
17. 2012.10.30.
ULTRA-LOW-FIELD IMAGING
The future of functional brain imaging
Earth magnetic field
SQUID MAGNETOMETRY
3T, 4T, 7T, … ? Los Alamos, USA
Ultra-low-field imaging
Arterial spin labeling
Functional diffusion tensor
imaging (Le Bihan)
The small electric currents of
neuronal activity induce changes
in the magnetic field, which
interferes with the Earth’s and
imaging can be performed
Arterial Spin Labeling - ASL Arterial Spin Labeling - ASL
z (=B0) inversion
slab
excitation blood
y
x inversion
imaging
i i
plane
• Perfusion: delivery of metabolites (via local blood
flow) (BOLD - hemoglobin) • Represents an interesting physiological parameter
• Arterial Spin Labeling (ASL): invert of in-flowing • Quantitative: fit kinetic curve for perfusion in
blood ml/100g/min
• IMAGEperfusion = IMAGEuninverted - IMAGEinverted 99 • Lower SNR than BOLD 100
• Limited coverage (~5 slices)
Arterial Spin Labeling - ASL Arterial Spin Labeling - ASL
Magn Reson Med, 48:242-254 (2002) Magn Reson Med, 48:242-254 (2002)
17
18. 2012.10.30.
Stroke. 2000;31:680-687.
Part IV.
The functional brain connectome
End of Part III. – any questions?
Resting state fMRI Spontaneous synchronity in the brain =
low frequency oscillations
<0.1 Hz neuronal activity is present during „rest”
Background for continuous sensory processing?
Don’t do anything. What regions are „synced” ?
18
19. 2012.10.30.
THE SHORT HISTORY OF
Correlated time courses = networks
CONNECTOMICS
1. Regional slow neuronal activity
Theodor Meynert
Jules Dejerine
Tracing studies
„In vivo methods”:
3. Their correlation (temporal) Diffusion tensor imaging
Functional MR imaging
Functional Connectivity
2. Regional slow neuronal activity
Hypothesis: if two neuronal time courses are This is called FUNCTIONAL CONNECTIVITY
correlated, the regions are interconnected.
19
20. 2012.10.30.
Modeling the brain’s connections Modeling the brain’s connections
Brain regions: network nodes Brain regions: network nodes
Structural OR functional brain connection strength: network edges Structural OR functional brain connection strength: network edges
Graph-theoretical analysis, a purely mathematical approach Graph-theoretical analysis, a purely mathematical approach
Node (region)
Edge
(connection)
Short path-length, Low degree Long path-length, Low degree
How can information be exchanged among brain regions? How can information be exchanged among brain regions?
Modeling the brain’s connections Modeling the brain’s connections
Brain regions: network nodes Brain regions: network nodes
Structural OR functional brain connection strength: network edges Structural OR functional brain connection strength: network edges
Graph-theoretical analysis, a purely mathematical approach Graph-theoretical analysis, a purely mathematical approach
Hub
Short path-length, High degree Example of a highly
(low efficiency) efficient network
How can information be exchanged among brain regions? How can information be exchanged among brain regions?
20
21. 2012.10.30.
Modeling the brain’s connections What is the cortico-cortical brain network like?
cortico- like?
Brain regions: network nodes CORTEX The internet Facebook
Structural OR functional brain connection strength: network edges
Graph-theoretical analysis, a purely mathematical approach
Source: Paul Weinstein’s blog
Example of an inefficient
network (almost random)
Modha & Singh. Network architecture of the
long-distance pathways in the macaque
How can information be exchanged among brain regions? brain. PNAS, 2010 Small World Networks
Network properties of the brain:
brain: Network properties of the brain:
brain:
normal development normal and pathological
Network cost Network efficiency
cost=sum(wij)
Gong et al. Age- and Gender-Related Differences in the Cortical Anatomical Network. The Journal of Gong et al. Age- and Gender-Related Differences in the Cortical Anatomical Network. The Journal of
Neuroscience 2009; 29: 15684-15693. Neuroscience 2009; 29: 15684-15693.
Network properties of the brain:
brain: Network properties of the brain:
brain:
gender differences correlation with intelligence
Network cost Network efficiency
Path length negatively correlates
with IQ, especially in the left
frontal medial cortex
cost=sum(wij)
Gong et al. Age- and Gender-Related Differences in the Cortical Anatomical Network. The Journal of Van Heuvel et al. Efficiency of Functional Brain Networks and Intellectual Performance
Neuroscience 2009; 29: 15684-15693. The Journal of Neuroscience, 2009, 29(23): 7619-7624.
21
22. 2012.10.30.
Network properties of the brain:
brain:
Detecting areas with similar connectivity profiles
schizophrenia
-Exekutív
skill
+Exekutív LOSS OF HIERARCHICAL
skill ORGANIZATION IN FRONTAL
REGIONS
Jakab A et al. Mapping changes of in vivo connectivity patterns in the human mediodorsal Bassett, D. S. et al. 2008
thalamus: correlations with higher cognitive and executive functions. Brain Imaging and Van Heuvel. et al. 2010
Behavior 2012; DOI: 10.1007/s11682-012-9172-5
Network properties of the brain:
brain:
high functioning autistic adults
Thank you for your attention!
n=9 (HLFA) Presentation credits:
vs. n=40 (controls)
Suggests the impairment
of long-range
Dr. András Jakab, M.D. Ph.D.
association fibers, Dr. Ervin Berényi, M.D. Ph.D.
especially in the
left fronto-temporo- Dr. Péter Katona, M.D.
ocipital connectivities
Dr. Miklós Emri, Ph.D.
Tamás Spisák, M.sc.
Jakab A, Spisak T, Szeman-Nagy A, Beres M, Molnar P, Emri M, Berenyi E. Pathological patterns of
functional connectivity and white matter anisotropy in high functioning autistic adults. Under review @
PLoS One
22