SlideShare una empresa de Scribd logo
1 de 20
Descargar para leer sin conexión
ANEC-R&T-2007-CHILD-002
Maschinen-, Hebe- und Fördertechnik
Fachbereich Spiel-, Sport-, Freizeitgeräte
Akkreditierte Prüf-, Überwachungs- und Zertifizierungsstelle
Notified Body 0408
Report about a Round Robin Test
EN 1177:1997 Impact Absorbing Playground Surfacing
Test methods for determination of the Critical Fall Height
Within the framework of ANEC (European Association for the
Coordination of Consumer Representation in Standardisation)
Dipl.-Ing. Adolf Russold
TÜV Austria
Page 1 to 18 Signature
Vienna, March 2007
1
Content of the Report:
1. Task of the Round Robin Test
1.1 Background
1.2 Purpose
1.3 Scope
2. Test conditions
3. Methodology and Performance
3.1 Testing procedure
3.2 Evaluation of measurements
3.3 Test equipment and measurements
4. Results and further investigations
4.1 Consequences of results (Table 1)
4.2 Acceptability of final results in a test report
5. Summary
1. Task of the Round Robin Test
1.1 Background:
In children´s playgrounds most of the injuries are caused by falls. It is considered
that the most severe injuries are injuries to the head. The impact attenuating
properties of surfacing are therefore of major importance to reduce the severity of
those injuries.
That is why CEN/TC136/SC1 developed EN 1177, a standard that sets the test
method by which the impact attenuation properties of a surface can be
determined.
This method is considered to be the best model available to predict the likelihood
of head injury resulting from falls. It gives a “critical fall height” for surfacing,
which means the maximum acceptable fall height associated with different types of
impact attenuating surfacing (IAS) materials in order to reduce the risk of head
injuries.
The standard EN 1177 was published in 1997 and at that time, the test method was
based on the results of the few test equipment available on the market (3 models).
In the meantime also other models of test equipment have been developed and they
are used not only by test houses but also by a variety of organisations and
individuals with different backgrounds and level of experience. This has led to a
2
situation where serious disparities between test results were found which created
uncertainty about the current safety level of the IAS that are used on playgrounds.
EN 1177 is under revision now and a working group of experts within SC1 has
identified the need to analyse the factors influencing these differences. Probable
reasons have been found like inaccuracy of measuring equipment (calibration) and
of the measurement equipment for evaluation and calculation. To be able to
improve requirements in order to give more certainty on the safety level of
surfacing, TC 136/SC1 decided that a round robin test is carried out. Test houses
were ready to carry out the tests at their own costs, but funding for the supervision
by an independent body was needed and offered from ANEC.
ANEC outlined a tender to a R&T project for a round robin test for impact
measurement on playground surfacing materials and the offer of TÜV Austria was
chosen to prepare, organise and supervise this test, including the evaluation of the
test results and possible improvements for the revision of EN 1177. The tests were
carried out under the responsibility of Mr. Adolf Russold from TÜV Austria, who
is also Convenor of the SC1- Working Group (WG 1) dealing with the revision of
EN 1777. Project Advisor at ANEC is Mrs. Helena Menezes from APSI
(Portuguese Association for Child Safety Promotion) .
1.2 Purpose:
The purpose of this R&T project was to carry out a round-robin test, involving test
laboratories from different European countries, to investigate all relevant
possibilities of uncertainties and define maximum tolerances to avoid major
deviations in test results, leading to unsafe situations on playgrounds. According to
the findings, additional requirements or specifications will be added to the
standard EN 1177 during its revision, in order to improve the reliability of the test
equipment. This will set up a quality standard for test equipment used by test
houses as well as by other operators which, in turn, will ensure the safety level for
IAS required by the playground standard.
1.3 Scope
At the moment the nominal value for the critical fall height shall be expressed
according to EN 1177:1997 in metres to one decimal place without rounding.
This can lead to situations that in case of a difference of at least 110mm (0,11m) in
the test results of different test-labs the nominal value confirmed in the test reports
could differ in maximum by 200mm (0,2m), e.g. if one result is 1,79m and the other
result is 1,90m (gives nominal critical fall heights of 1,7m in the one case and 1,9m
3
in the other case). The same nominal result in this situation would also be given
with a much higher difference of 0,28m in the test results, e.g. 1,71m and 1,99m.
The task of the round robin test was to reduce the deviations in the results for the
nominal critical fall heights (e.g. to maximal 0,1m, i.e. less tan 0,11m) and to
improve the safety for users and operators of playgrounds by reliable test reports.
To reach this goal it was to investigate which improvements of the requirements on
test equipment as given in EN 1177:1997 are necessary and possible, considering
also the deviations given independently from the equipment by the inhomogeneity
of the materials to be tested (synthetic tiles, compound material, loose fill material,
etc.) to find the practical acceptable tolerance.
2. Test conditions
The tests have been carried out according to EN 1177:1997 on three different types
of samples of synthetic tiles with different thicknesses, which are used as impact
attenuating surfaces on playgrounds. From each type, two tiles of the same
production (PI and PII) were tested to compare also uncertainties in the
production:
Type 50mm : Sample PI and Sample PII- 50mm thickness
Type 75mm : Sample PI and Sample PII- 75mm thickness
Type 100mm: Sample PI and Sample PII- 100mm thickness
Tests on Samples PI: 4 specified drop heights on each of 3 points (P1, P2, P3),
which have been marked on the sample
Tests on Samples PII: 1 specified drop height on each of 3 points (P1, P2, P3 –
marked at the same positions as on sample P1)
On Samples PI the drop tests were carried out according to EN 1177:1997 from
the lowest to the highest drop height
.
On Sample PII only one of the drop heights used in the test of Sample PI was
chosen to identify deviations caused by production and/or inhomogeneity of the
products as well as by an influence of the sequence of the drop tests.
Measurements of the Head Injury Criterion HIC, the maximum acceleration at
each impact amax [g] and the time interval for the calculation of the
time/acceleration curve ΔtHIC [msec], as defined in EN 1177:1997, were
tabled in a prepared format (see page 8).
3. Methodology and performance:
11 test houses from 8 European countries with 12 test apparatus took part on this
round robin test (listed in alphabetic order – see table).
4
Name Adress Country Contact
AIJU Technology
Center
Avenida de la Industria,
23 , 03440 Ibi (Alicante)
Spain María Cruz
Arenas
CST - Centre for
Sports Technology
Ltd
Unit 3: Greenwhich
Centre Business Park, 53
Norman Road, London SE
10 9QF
United Kingdom Greame Tipp
DTI Danish
Technological
Institute
Teknologiparken,
Kongsvang Allé 29, DK-
8000 Aarhus C, Denmark
Danemark Kent
Lemming
IBV - Instituto de
Biomecanica de
Valencia,
Universidad
Politéchnica de
Valencia
Edificio 9 C, Camino de
Vera s/n, E-46022
Valencia, Espania
Spain Juan V.
Durà
ISA Sport Papendallaan 31, 6816 VD
Arnhem, Netherlands
Netherlands Gert-Jan
de Kieft
ITC - Institute For
Testing and
Certification a.s.
Tř. T. Bati 299, CZ-764 21
Zlin
Czech. Rep. Ludmilla
Antosova
Laboratories
Pourquery
Laboratoires Pourquery
93 boulevard du Parc
d'Artillerie
69354 LYON cedex 07
France Clément
Charmasson
Labosport France LABOSPORT
TECHNOPARC
72100 LE MANS
France Arnaud
Louveau
TÜV Österreich 1015 Wien, Krugerstraße
16
Austria Adolf
Russold
TÜV Rheinland
Product Safety
VWA – Voedsel
en Waren
(2 test equipment)
51105 Köln
Am Grauen Stein
Westelijke parallelweg 4
3331 EW, Zwijndrecht
Netherlands
Germany
Netherlands
Berthold
Tempel
Dico van
den Ouden
Requirement for the participating test houses was compliance with ISO/IEC 17025.
From most of laboratories the certificates about accreditation are still missing.
3.1 Testing procedure
5
The test probes (in sum 3x2 tiles) have been sent in a container (fabricated with the
dimensions of the tiles) from one test house to the next, so that all laboratories made
the test on the same probes.
The first test was carried out by TÜV Austria to define the most representative drop
heights for determination of the critical fall height at a HIC-value of 1000 as defined
in EN 1177:1997.
The last test after tested by all participants was again made by TÜV Austria to
compare the properties of the test probes with the condition at the first test with the
same apparatus.
The results of the measurements of each laboratory were sent after each test to the
supervisor for evaluation. The completed formats with all measurements as described
above are included in Annex 1.
3.2 Evaluation of measurements
The evaluation of all measurements was carried out by the supervisor in accordance
with EN 1177:1997.
For all tiles type PI the curves (HIC/ drop height) were drawn for each point tested
(P1, P2 anP3), as shown in figure C.2 of the standard. In deviation to this figure the
drop heights for this test have been chosen in advance (first test at TÜV Austria) in
such a way, that two of the HIC values were expected above HIC 1000 and two values
below HIC 1000. This gives more accuracy for measuring the critical fall height at
HIC 1000 and will be an improvement of the standard which is already proposed
(Draft prEN 1177:January 2006 clause 4.4.4).
Because the task of this round robin test was to investigate the accuracy of the
apparatus, only 3 defined points on each tile were tested and the critical fall height for
each of the 3 points on a tile was evaluated separately. These 3 critical fall heights are
listed in the table of results for each tile (see page 9 of this report) and the differences
between the results demonstrated.
Remark:For definition of the critical fall height of a whole surface consisting of single tiles
the standard requires instead of this testing procedure that nine points on four tiles have to
be measured. Only the curve giving the lowest drop height from all nine measurements
defines the critical fall height. Because the curves in different points of a surface differ
from each other (see the difference in critical fall heights in the table), the comparison of
the final critical fall heights (the lowest for all points) would not allow to analyse
deviations in single measurements any more.
The values for the critical fall height in each point tested were found graphically by
measuring the height out of each (HIC/drop height) curve-diagram. The curves in the
diagram were traced by a geometrical function connecting the measured HIC-values
which give a nearly linear figure.
6
3.3 Test equipment and measurements
A format for the description of the test equipment was sent to each laboratory (see
below).
Draft Formate HIC-Round Robin
1. Testing Laboratory:
Name and address:
Legal status:
(accreditation certificate, ...)
Supervisor for the test:
2. Test Equipment acc. EN 1177
Headform: mass and shape mass in grams:
- drawing with measurements position of accelerometer
- guided headform
- free fall headform
- radius at impact area r in mm
Accelerometer:
Number (1 axial, 3 axial)
- Type
- Position
- Sensitivity (pC/g, mV/g)
- uncertainty / protocol for calibration
Measuring equipment:
Amplifyer:
- type
- sampling rate (frequency)
- filter …
- uncertainty complete
Height measurement
- equipment/type
- uncertainty
Speed measurement (if applicable)
- equipment/types
- uncertainty
Validation of HIC calculations
- method
- uncertainty
7
TEST PROTOCOL Round Robin Test for HIC 2006
INSTITUTE:
Name:
Address:
Date of receipt:
Date of test:
Date of sending : to: ……………
Test equipment (Id.No.)
Name of responsible tester:
Tempterature at the test:
rel. humidity at the test:
RESULTS:
TYPE 50mm
HIC amax [g] ΔtHIC [msec] HIC amax [g] ΔtHIC [msec] HIC amax [g] ΔtHIC [msec]
Tile P I
Drop height H1= 1200mm
Drop height H2= 1400mm
Drop height H3= 1600mm
Drop height H4= 1800mm
Drop height H5= 1200mm
Tile P II
Drop height H= 1400mm
TYPE 75mm
HIC amax [g] ΔtHIC [msec] HIC amax [g] ΔtHIC [msec] HIC amax [g] ΔtHIC [msec]
Tile P I
Drop height H1= 1800mm
Drop height H2= 2000mm
Drop height H3= 2200mm
Drop height H4= 2400mm
Drop height H5= 1800mm
Tile P II
Test points
P1 P2 P3
Test points
P1 P2 P3
Drop height H= 2000mm
TYPE 100mm
HIC amax [g] ΔtHIC [msec] HIC amax [g] ΔtHIC [msec] HIC amax [g] ΔtHIC [msec]
Tile P I
Drop height H1= 2500mm
Drop height H2= 2700mm
Drop height H3= 2900mm
Drop height H4= 3100mm
Drop height H5= 2500mm
Tile P II
Drop height H= 2700mm
Remarks:
ΔtHIC [msec] ... t2-t1 for HIC-calculation
Each drop test for tiles I shall start at each test point with the lowest drop height and shall be continued
immediately with the next drop height. The last
drop height shall be the same as the first drop height. The time difference between each drop test shall be lower
than 2 min.
All time/acceleration curves to be recorded.
Test points
P1 P2 P3
3-HIC-round_robin_test_protocoll_engl(1) 31.01.2007
Test protocols with results and HIC/ time curves see Annex 1 and Annex2.
8
4. Results and further investigations
Table 1: Single critical fall heights for each point
Critical fall
heights [m]
Type
50
mm
Type
75
mm
Type
100
mm
50-P1 50-P2 50-P3 75-P1 75-P2 75-P3
100-
P1
100-
P2
100-
P3
Lab. No. 1 1,41 1,41 1,41 1,98 1,96 1,98 2,76 2,76 2,67
Lab. No. 2 1,42 1,45 1,45 2,05 2,05 2,05 2,80 2,85 2,85
Lab. No. 3 1,55 1,58 1,58 2,28 2,30 2,30 3,40 3,40 3,40
Lab. No. 4 1,43 1,45 1,46 2,04 2,08 2,08 2,82 2,83 2,87
Lab. No. 5 1,46 1,46 1,46 2,08 2,05 2,08 2,83 2,83 2,83
Lab. No. 6 1,47 1,47 1,48 2,12 2,11 2,15 2,92 3,00 3,02
Lab. No. 7 1,42 1,47 1,46 2,08 2,13 2,09 2,87 2,93 2,88
Lab. No. 8 1,43 1,45 1,44 2,13 2,02 2,08 2,88 2,92 2,89
Lab. No. 9 1,48 1,50 1,50 2,15 2,14 2,13 3,15 3,11
Lab. No. 10 1,50 1,52 1,48 2,15 2,15 2,08 2,85 2,90 2,87
Lab. No. 11 1,52 1,50 1,51 2,17 2,10 2,08 2,88 2,85 2,83
Lab. No. 12
max. difference
[m] O,10 0,07 0,07 0,13 0,13 0,10 0.08 0,10 0,06
max. deviation in
% 7,0% 4,8% 4,9% 6,4% 6,4% 4,8% 2,9% 3,5% 2,1%
max. difference
[m] 0,14 0,17 0,17 0,30 0,34 0,32 0,64 0,64 0,64
max. deviation in
% 9,9% 12,1% 12,1% 15,2% 17,3% 16,1% 23,2% 23,2% 23,2%
The table shows the results for the critical fall heights in the measured points (P1,P2
and P3) for the 3 types of tiles PI evaluated in Annex 2.
The measured values on tile PII are listed in the test protocols in Annex 1. They are in
the same range as the values on PI and are not considered in Table 1.
This table needs to be commented as follows:
A. Red markings:
- Lab. No. 1 had the lowest critical fall heights (highest HIC-values)
- Lab. No. 3 had the highest critical fall heights (lowest HIC-values) and
had on tile type 100mm no HIC-value above HIC 1000
(the curves were extrapolated to find the value for the critical fall height)
- Lab. No. 6 had on type 100mm only one point with HIC above 1000
- Lab. No. 9 had on type 100mm no HIC-value above HIC 1000
(extrapolation of P1-curve not possible)
- Lab. No. 12 made wrong measurements and was not included in evaluation
These results show bigger differences in the fall heights than the intended task
( i.e.max. 0,34m>>0,11m) and therefore further investigations for improvement of
the measuring system have been carried out.
B. Green markings:
Majority of results, based on formally correct measurements. The max. deviation
9
is here 0,13m which is closer to the task of 0,11m, but nevertheless possible
improvements on the accuracy were investigated for all results.
4.1 Consequences from Table 1:
Although the test points P1, P2 and P3 have been marked on the tiles before the test,
the repeatability and characteristics of the values measured show deviations within
the same apparatus (see evaluation in Test Protocols Annex 1). Reasons and degrees of
variations have been investigated as follows:
4.1.1 Behaviour of surfacing material:
Anticipating that the measuring process remains unchanged for a given
apparatus, deviations in the results can occur as well from inhomogeneities in
the tested material as from a certain compression effect caused from the former
test impacts. Hitting not exactly the same point of the marked test position at
each drop test, which is in practice always given, can in addition lead to some
deviations in the results, which depend on the structure of the surfacing
material.
Test results within each apparatus (dispersions of measurements Annex 1):
For these comparisons no extra table was created.
1. Compression effect from former impacts:
The differences between 2 repeated HIC-values, measured from drop height
H1 on tile PI, varies in a range between –7% lower value and +20% higher
value at the second impact on the same point. Apart from these single
extremes there are generally slightly increased HIC values ( +0% to +5%)
with single higher measurements as well in + as in –direction, but without a
reasonable systematic in the sequence, which could be a consequence of
compression.
2. Inhomogeneity of material:
The dispersions of HIC-values, measured over the surface Tile PI ( in the
points P1, P2, P3), expressed by HICmax/ HICmin in %, vary in a range
between 0% and max. 16%. Most of these dispersions are below 10%. The
sequence of dispersions cannot be explained by inhomogeneities alone.
3. Final comparison test (Lab. No. 4-2):
The final test after the round robin showed deviations of HIC to the initial test
( Lab. No. 4-1) between max. +4/ -5%. Compared with the dispersions within
one test procedure (see pt. 2) this result confirms that no change of the test tile
during the test procedures of the round robin has occurred.
Note: A negative value (lower HIC-value) in the repeated test is not probable
because it would mean a softening of material instead of a compression.
10
4. Comparison tests on tiles PII:
The tests for one drop height H2 in the points P1, P2, P3 of each tile PII are
differing from the comparable values on tile PI in a range between max.
--14% and +16%, with a tendency of about - 5% lower HIC-values than on
tile PI. This result shows the difference in the production of the tiles and
can be neglected, when compared with the dispersions within the tiles PI.
.
Conclusion:
1. The compression effect on the same point in a series of drops can be
considered as negligible, because the dispersions of HIC-values measured
are within the range of the uncertainties of all the other measurements over
the surface and the tendency of +5% is therefore no clear indication for a
relevant compression effect.
2. The inhomogeneity of the material does not show a relevant influence on the
variable +-dispersion of the results in the different points of the surface
tested and can be neglected too for the further investigations.
3. The final comparison test after the whole round robin test procedure does
not show a relevant change of properties on the tested material.
4. The tests on the second tiles PII of the same production do not show relevant
differences to the tiles PI.
4.1.2 Uncertainties of the measurement system
As the dispersions of measurements shown in 4.1.1 are not caused mainly by the
material, this leads to the conclusion that they have to be considered as
uncertainties in measurements of the apparatus.
Reasons for possible dispersions in the results, caused by the test apparatus
itself as defined now in EN 1177:1997 , were identified at the meeting of the
participants of the round robin test on 22 January 2007. Improvements by
giving more precise definitions for the measurement system of the apparatus
have been found and partly confirmed by further investigations. They will be
proposed for the revision of the standard (see pt. 4.1.4 measuring equipment).
Unfortunately it was not possible to receive more detailed information about
the measurement systems and about accuracies of instruments used from the
majority of participants. For this reason it was not possible to calculate an
uncertainty budget and to find a more precise estimation for the results of
improvements which have been proposed for the revision of the standard
EN1177.
11
4.2 Acceptability of the final result in a Test Report:
The dispersions in the single measurements for the HIC values are not fully relevant
for the final determination of the critical fall height, which is the end result of a
complete impact test for the impact attenuation of a surface.
EN 1177:1997 requires to draw the relevant HIC/ drop height- curve created only
from all highest HIC- values in 9 drop tests to evaluate the critical fall height at HIC
1000. This method eliminates the measured lower HIC-values, so that the relevant
result for the critical fall height is the lowest value from all measurements. This
provides more safety for the user on the playground. As an additional safety this
lowest value shall be rounded down to the lower decimal of a meter (e.g. 1,59m is
reported as 1,5m).
In this round robin test only 3 defined points have been measured (instead of 9 points
as required in EN 1177:1997, including also joints of tiles), to have precise conditions
for the main task of this test, which was to compare the accuracy of apparatus.
Following the standard also for this special case and taking the lowest values from
these drop tests, Table 1 would lead to final results for the critical fall height as given
in Table 2. Following the task of this test, these values have not been rounded down to
the lower decimal to show the real differences.
Note: It should be considered that when carrying out the complete test according the
standard (testing more points and also the joints between the tiles) the final results could
be lower than found for these 3 points!
Table 2: Critical Fall Height acc .EN 1177
Critical fall height
in {m] Type 50mm Type 75 mm Type 100 mm
( acc. EN 1177:1997) 50-P1 75-P1 100-P1
Lab. No. 1 1,41 1,96 2,67
Lab. No. 2 1,42 2,05 2,80
Lab. No. 3 1,55 2,28 3,40
Lab. No. 4 1,43 2,04 2,82
Lab. No. 5 1,46 2,05 2,83
Lab. No. 6 1,47 2,12 2,92
Lab. No. 7 1,42 2,08 2,87
Lab. No. 8 1,43 2,02 2,88
Lab. No. 9 1,48 2,13
Lab. No. 10 1,48 2,08 2,85
Lab. No. 11 1,50 2,08 2,83
Lab. No. 12
0,08 0,11 0,08
Max. difference in
[m] 0,14 0,32 0,73
5,6% 5,4% 2,9%
Max. deviation in % 9,9% 16,3% 27,3%
lowest
incorrect
incorrect
highest
12
These results show that although the dispersions in the HIC- measurements within one
test apparatus will be compensated to the safe direction, it remains the situation that
the differences between the different apparatus lead to end results with higher
differences than intended.
4.2.1 CONSEQUENCES OF THE ROUND ROBIN TEST FOR IMPROVEMENTS
The first step was to look for the measurement systems in the different apparatus and
for the sources of differences in measurements. Table 3 shows the min. and max. a-
values as well as HIC-values measured from all drop heights on each test tile and gives
below the maximal dispersions from all apparatus in %, marking the Labs in the same
way as above.
Table 3: HIC and acceleration [a]- measurements
Type 50 mm Type 75 mm Type 100 mm
HICmin amin HICmax amax HICmin amin HICmax amax HICmin amin HICmax amax
Lab. No. 1 677 134 1703 226 807 130 1450 178 856 121 1261 148
Lab. No. 2 705 137 1611 223 774 129 1327 172 803 117 1148 142
Lab. No. 3 588 131 1388 215 613 118 1085 161 584 102 866 127
Lab. No. 4 637 134 1589 228 729 127 1351 177 768 116 1158 146
Lab. No. 5 682 142 1530 223 764 132 1320 175 806 120 1153 146
Lab. No. 6 657 140 1504 222 735 130 1253 171 743 117 1071 140
Lab. No. 7 656 139 1616 233 719 130 1303 176 742 117 1125 145
Lab. No. 8 678 139 1280 208 747 130 1340 176(184) 782 118 1147 143
Lab. No. 9 600 132 1508 225 632 122 1248 174 711 113 994 136
Lab. No.10 657 141 1524 221 694 127 1223 168 737 118 1188 145
Lab. No.11 642 133 1472 205 703 125 1282 171 791 117 1153 144
Lab. No.12
Dispersion % 14 7 33 14 28 8 19 6 9 3 6 3
Dispersion % 16 8 33 14 32 12 34 11 47 19 46 17
This comparison shows that the max. HIC-values, which are relevant for the
determination of the critical fall height, vary between 6% and 33% even in the green
area, but between 33% and 46% in the red area (for the min. HIC- values this goes up
to 47%).
On the other hand the dispersion of the acceleration-values [a] is much lower. The
amax-values vary between 3% and 14% in the green area and between 11% and 17%
in the red area (for amin-values up to 19%).
Conclusion:
The differences in the HIC- values are caused by a minor dispersion of acceleration [a]
measurements and a much bigger part of dispersions in the acceleration/ time curve
13
[g]/ [t] respectively in the evaluation of this curve acc. the formula for HIC, as defined
in EN 1177.
Figure 1 shows a correct acceleration/time curve as given in the standard EN 1177 and
the formula for calculation of HIC by evaluating this curve. The dimensions for
accelerations are given in [g= gravity 9,81m/s2
] and for time t in [ms].
Figure 1: Impact acceleration / time curve
( ) maxHIC 12
5,2
12
2
1
⎥
⎥
⎥
⎥
⎥
⎦
⎤
⎢
⎢
⎢
⎢
⎢
⎣
⎡
−×
⎟
⎟
⎟
⎟
⎠
⎞
⎜
⎜
⎜
⎜
⎝
⎛
−
×
=
∫
tt
tt
dt
t
t
a
4.2.2 IMPROVEMENTS FOR HIC-MEASUREMENTS:
The following improvements for the impact measuring equipment have been identified
following the results of this round robin test. As explained in pt. 4.1.2, it is not possible
at the moment to give exact values for the final result from these improvements, which
are therefore restricted to single estimations.
1. The accelerometer measurement system must be able to measure all relevant
frequencies for tracing the exact [g]/ [t]- curve. It is necessary to define also the
lower limiting frequency to get sufficient lower response and to reduce the
amplitude error by overshooting the baseline after the impact and
underestimating the g-max.and HIC- score, as shown in Figure 6.8. This error
is bigger in particular for longer pulse durations. An accelerometer with a time
constant of 2s or greater and appropriate signal conditioning will generally
meet this requirement. The example for such overshooting is out of a data sheet
from a manufacturer of such measuring instruments and shows such incorrect
curves (full lined), which will lead to wrong HIC- values.
14
Also the amplitude accuracy at higher frequencies and requirements for the
filter need to be defined to avoid wrong incorrect curves caused by the
“ringing”-effect (right curve).
More details about such requirements are in ISO 6487, to which a reference
will be made in the revised EN 1177.
Source: Brüel & Kjaer, Denmark
Additional tests made by C.S.T. after the round robin test have confirmed these
overshooting measurements to minus g-values (in the Fig. named F(t)), which are
not existing in reality and which therefore are amplitude errors caused from
insufficient low frequency response of the measurement system.
The lower limit for the frequency measurement is therefore proposed for the
revision of the standard with 0,3 Hz to keep this error below 5% for pulse
durations up to about 30ms.
Note: This limitation was made for practical reasons to allow the mostly used piezo
electric gauges, which reach at 0,3Hz the limit of accuracy. Very soft impact
materials (e.g. loose fill material) can have longer pulse durations up to 50ms
which can cause amplitude errors up to 10%.
2. Calibration of measuring equipment:
Only calibrated measuring instruments shall be used for the measurement of
the drop height (in case of free fall head forms) respectively of the velocity
before the impact (in case of guided head forms) and for the measurement of
the acceleration (accelerometers).
The usual measurement uncertainties for such instruments are proposed for the
revision of the standard EN 1177 and periodical calibration will be required.
For accelerometers a guide on acceptable calibration levels will have to be
elaborated in future, taking ISO 6487 into consideration.
15
3. Release system for the headform:
The release system shall not create any significant rotation of the headform
which can affect the vertical acceleration values measured at the impact point.
A comparison test at the beginning of each test series to identify such effects is
proposed for the revision of the standard.
4. HIC – calculation:
An independent check for the computer algorithm by imposing a half sinus curve
and comparing the result with the result of the computer is proposed for the
revision of the standard.
4.2.3 CONSEQUENCES ON THE FINAL RESULTS FOR THE CRITICAL FALL
HEIGHT:
The improvements proposed are expected to lead to lower dispersions in the HIC-
values than found in the round robin test. This means in practice dispersions of ca.
5% for short pulse durations and up to 10% for longer pulse durations up to 50ms in
case of soft impact attenuating material.
The consequences of such dispersions in the HIC- values on the critical fall height
depend on the inclination of the HIC/drop-height curve and lead to different
deviations in the final result.
This influence is demonstrated in Figure 2 on the simple example for an anticipated
deviation of 10% in HIC-values (shown in this figure for HIC 1000 and HIC 1100)
within one and the same curves of Lab. No. 4-1. This simplification is possible because
the “curves” are nearly linear and would have the same effect for another “curve”
with 10% higher HIC-values.
We can see that in such a case the difference in the fall height would be ca. 6cm for the
steep curve (“harder” tile Type 50mm), but ca. 17cm for the flat curve (“softer” tile
Type 100mm). The red arrows show the difference in the result.
It shows also that these differences in the critical fall heights are always based on the
same dispersion of HIC (in this case 10%) and in both cases would have the same
acceptable safety tolerance.
Note: These differences become bigger on flatter curves, e.g. in case of loose fill
surfacing material, which was not subject of this test.
16
Figure 2: Critical fall height for HIC 1000 and HIC 1100
0
200
400
600
800
1000
1200
1400
1600
1800
0,0 0,5 1,0 1,5 2,0 2,5 3,0 3,5
Drop height [m]
HIC
50-P1
50-P2
50-P3
75-P1
75-P2
75-P3
100-P1
100-P2
100-P3
This result shows that the improvement of reducing the dispersions in the HIC- values
cannot solve the formal problem that the final result for the critical fall height can
differ more than 0,1m in case of soft material, as it was the original task of this
project. It is to say that this task was also a wish from the market to avoid different
classifications in test reports of playground surfacing.
Nevertheless these differences in the critical fall height will not affect the safety of the
surfacing. Provided that all improvements on the measuring system are made as
proposed, in any case of such differences the values for HIC would not differ more
than 10%, which seems to be an acceptable tolerance for the safety of the user. In
particular for soft materials (e.g. loose fill surfacing) a bigger tolerance than 0,1m in
the critical fall height results will be expected and can be accepted therefore.
It is to state that under such complex conditions no uncertainty budget could be
calculated. The practical results of the proposed improvements will have to be
investigated in a further round robin test.
17
5. SUMMARY
Tasks of the round robin test:
Task 1 of this round robin test was to improve safety of surfacing on playgrounds by
improving the accuracy of the test method described in EN 1177:1997 in its revision.
It was intended to reach a difference of not more than one decimetre (100mm) in the
final results of the critical fall height.
Task 2 was to determine the measurement uncertainty of the measuring equipment by
calculation of the uncertainty budget as a basis for task 1.
Task 3 was to improve the standard EN 1177:1997 using all the results and their
consequences by concrete amendments for the revision of this standard.
Results:
TASK 1 was considered for accredited test laboratories as well as for other operators.
Subject of this round robin test was to compare test laboratories only.
11 European test houses with 12 partly different types of test equipment were
participating in this test, which was running from May 2006 to January 2007.
All tests have been carried out on the same samples in a defined test procedure, laid
down by the independent supervisor of the test. The samples were tested before and
after the round robin test to identify any changes from transport or testing. The
results were evaluated by the supervisor and analysed with the participants in a
separate meeting with a follow up meeting of CEN/TC136/SC1/WG1 and the advisor
of ANEC.
This task could be reached for the test equipments by identifying the reasons for
major deviations in the test results received, leading to necessary improvements in the
measurement requirements which will be proposed for the revision of the standard.
Nevertheless the originally intended tolerance of one decimetre (100mm) in the final
result for the critical fall height needed to be replaced by the real safety criteria,
which is the tolerance in the measured HIC-values. This tolerance is proposed for the
revision of EN 1177 with 5%, but must be expected up to 10% for long pulse durations
(soft materials) when improving the existing apparatus according the given proposals.
This is an acceptable tolerance for the safety of users and the resulting differences in
the critical fall height given in the test report, even if more than 0,1m,
will always be in compliance with this HIC-tolerance.
Remark: Deviations caused by inhomogeneities in the material cannot be prevented by an
improvement of the test method.
TASK 2 was not possible to fulfil for the reason of the complex system of the
measuring chain and the unknown uncertainties in this system, for which the
18
improvements have been elaborated. The effects of these improvements need to be
further investigated in connection with further additional tests. Although this was not
within the scope of this round robin test, one of these additional tests could be carried
out to define the frequency range of the measurement equipment more detailed.
However further investigation will remain necessary.
TASK 3 could be fulfilled as far as at this stage possible, using the findings of this
round robin test for the revision of standard EN 1177:…as proposed in par. 4.2.2 of
this report.
The proposed revision is attached as Annex 3.
Anyway this project was an important approach for clarification and improvements of
the measuring equipment in apparatus for testing impact attenuating surfaces, to
reach the task for more reliable test reports and increase the safety of the playground
user.
The supervisor thanks ANEC for supporting this project.
TÜV AUSTRIA Vienna, 30 March 2007
Dipl.- Ing. Adolf Russold
19
20

Más contenido relacionado

Destacado

Sudah amankah makanan yang kita santap ?
Sudah amankah makanan yang kita santap ?Sudah amankah makanan yang kita santap ?
Sudah amankah makanan yang kita santap ?Lee Kelvin
 
tugas pemrograman berbasis web
tugas pemrograman berbasis webtugas pemrograman berbasis web
tugas pemrograman berbasis websaid79
 
Khotbah rohani tentang nabinuh hanya 8 orang condensed
Khotbah rohani tentang nabinuh hanya 8 orang condensedKhotbah rohani tentang nabinuh hanya 8 orang condensed
Khotbah rohani tentang nabinuh hanya 8 orang condensedLee Kelvin
 
Seminar rohani mengapa begitu banyak penderitaan
Seminar rohani   mengapa begitu banyak penderitaanSeminar rohani   mengapa begitu banyak penderitaan
Seminar rohani mengapa begitu banyak penderitaanLee Kelvin
 
Seminar tentang dinosaurus dan alkitab
Seminar tentang dinosaurus dan alkitabSeminar tentang dinosaurus dan alkitab
Seminar tentang dinosaurus dan alkitabLee Kelvin
 
Seminar haiwan, haram dan halal
Seminar haiwan, haram dan halal Seminar haiwan, haram dan halal
Seminar haiwan, haram dan halal Lee Kelvin
 
Seminar sejarah gereja advent revised
Seminar sejarah gereja advent revisedSeminar sejarah gereja advent revised
Seminar sejarah gereja advent revisedLee Kelvin
 
Seminar rohani - mengapa begitu banyak penderitaan
Seminar rohani - mengapa begitu banyak penderitaanSeminar rohani - mengapa begitu banyak penderitaan
Seminar rohani - mengapa begitu banyak penderitaanLee Kelvin
 
Seminar "Fashion"
Seminar "Fashion"Seminar "Fashion"
Seminar "Fashion"Lee Kelvin
 
Pelajaran sekolah sabat ke 13 2014
Pelajaran sekolah sabat ke 13 2014Pelajaran sekolah sabat ke 13 2014
Pelajaran sekolah sabat ke 13 2014Lee Kelvin
 

Destacado (13)

Sudah amankah makanan yang kita santap ?
Sudah amankah makanan yang kita santap ?Sudah amankah makanan yang kita santap ?
Sudah amankah makanan yang kita santap ?
 
tugas pemrograman berbasis web
tugas pemrograman berbasis webtugas pemrograman berbasis web
tugas pemrograman berbasis web
 
Khotbah rohani tentang nabinuh hanya 8 orang condensed
Khotbah rohani tentang nabinuh hanya 8 orang condensedKhotbah rohani tentang nabinuh hanya 8 orang condensed
Khotbah rohani tentang nabinuh hanya 8 orang condensed
 
Seminar rohani mengapa begitu banyak penderitaan
Seminar rohani   mengapa begitu banyak penderitaanSeminar rohani   mengapa begitu banyak penderitaan
Seminar rohani mengapa begitu banyak penderitaan
 
Seminar tentang dinosaurus dan alkitab
Seminar tentang dinosaurus dan alkitabSeminar tentang dinosaurus dan alkitab
Seminar tentang dinosaurus dan alkitab
 
baocao2
baocao2baocao2
baocao2
 
Seminar haiwan, haram dan halal
Seminar haiwan, haram dan halal Seminar haiwan, haram dan halal
Seminar haiwan, haram dan halal
 
Seminar sejarah gereja advent revised
Seminar sejarah gereja advent revisedSeminar sejarah gereja advent revised
Seminar sejarah gereja advent revised
 
Seminar rohani - mengapa begitu banyak penderitaan
Seminar rohani - mengapa begitu banyak penderitaanSeminar rohani - mengapa begitu banyak penderitaan
Seminar rohani - mengapa begitu banyak penderitaan
 
Seminar "Fashion"
Seminar "Fashion"Seminar "Fashion"
Seminar "Fashion"
 
Baocao1
Baocao1Baocao1
Baocao1
 
Pelajaran sekolah sabat ke 13 2014
Pelajaran sekolah sabat ke 13 2014Pelajaran sekolah sabat ke 13 2014
Pelajaran sekolah sabat ke 13 2014
 
MOHAN RESUME
MOHAN RESUMEMOHAN RESUME
MOHAN RESUME
 

Similar a Tvu+1177

Design and Analysis of Pressure Vessel Using Finite Element Method
Design and Analysis of Pressure Vessel Using Finite Element MethodDesign and Analysis of Pressure Vessel Using Finite Element Method
Design and Analysis of Pressure Vessel Using Finite Element MethodIJLT EMAS
 
Testo thermal imagers applications
Testo thermal imagers applicationsTesto thermal imagers applications
Testo thermal imagers applicationsTesto Viet Nam
 
AeroNDI presentation_ 09-2016_pluswpos
AeroNDI presentation_ 09-2016_pluswposAeroNDI presentation_ 09-2016_pluswpos
AeroNDI presentation_ 09-2016_pluswposmassimo capriolo
 
Un sensore a fibra ottica per misure di temperatura in situ in prove tribolog...
Un sensore a fibra ottica per misure di temperatura in situ in prove tribolog...Un sensore a fibra ottica per misure di temperatura in situ in prove tribolog...
Un sensore a fibra ottica per misure di temperatura in situ in prove tribolog...TogetherToSolve
 
TENSILE TEST REPORT
TENSILE TEST REPORTTENSILE TEST REPORT
TENSILE TEST REPORTmusadoto
 
12_Mahmoud_Rev6 (1)
12_Mahmoud_Rev6 (1)12_Mahmoud_Rev6 (1)
12_Mahmoud_Rev6 (1)Amr Hussien
 
Assignment of weights method for the optimization of ti n coated carbide reaming
Assignment of weights method for the optimization of ti n coated carbide reamingAssignment of weights method for the optimization of ti n coated carbide reaming
Assignment of weights method for the optimization of ti n coated carbide reamingIAEME Publication
 
Tofd tanker inspection development
Tofd tanker inspection developmentTofd tanker inspection development
Tofd tanker inspection developmentIrvine Gilbert
 
Paper id 252014117
Paper id 252014117Paper id 252014117
Paper id 252014117IJRAT
 
1F-Luigi-Pisu
1F-Luigi-Pisu1F-Luigi-Pisu
1F-Luigi-Pisulpisu
 
Optimization of Process Parameters of Wire Electrical Discharge Machining of ...
Optimization of Process Parameters of Wire Electrical Discharge Machining of ...Optimization of Process Parameters of Wire Electrical Discharge Machining of ...
Optimization of Process Parameters of Wire Electrical Discharge Machining of ...IRJET Journal
 

Similar a Tvu+1177 (20)

ML051640380.pdf
ML051640380.pdfML051640380.pdf
ML051640380.pdf
 
AMIF2014 – [Aerospazio] Silvio Pappadà, Componenti per elicottero, in materia...
AMIF2014 – [Aerospazio] Silvio Pappadà, Componenti per elicottero, in materia...AMIF2014 – [Aerospazio] Silvio Pappadà, Componenti per elicottero, in materia...
AMIF2014 – [Aerospazio] Silvio Pappadà, Componenti per elicottero, in materia...
 
A012450103
A012450103A012450103
A012450103
 
Design and Analysis of Pressure Vessel Using Finite Element Method
Design and Analysis of Pressure Vessel Using Finite Element MethodDesign and Analysis of Pressure Vessel Using Finite Element Method
Design and Analysis of Pressure Vessel Using Finite Element Method
 
UM docs2016
UM docs2016UM docs2016
UM docs2016
 
Testo thermal imagers applications
Testo thermal imagers applicationsTesto thermal imagers applications
Testo thermal imagers applications
 
Environmental Monitoring 2019
Environmental Monitoring 2019Environmental Monitoring 2019
Environmental Monitoring 2019
 
AeroNDI presentation_ 09-2016_pluswpos
AeroNDI presentation_ 09-2016_pluswposAeroNDI presentation_ 09-2016_pluswpos
AeroNDI presentation_ 09-2016_pluswpos
 
Un sensore a fibra ottica per misure di temperatura in situ in prove tribolog...
Un sensore a fibra ottica per misure di temperatura in situ in prove tribolog...Un sensore a fibra ottica per misure di temperatura in situ in prove tribolog...
Un sensore a fibra ottica per misure di temperatura in situ in prove tribolog...
 
Thesis
ThesisThesis
Thesis
 
EN 14904 English CE marking sport parquet
EN 14904 English CE marking sport parquetEN 14904 English CE marking sport parquet
EN 14904 English CE marking sport parquet
 
TENSILE TEST REPORT
TENSILE TEST REPORTTENSILE TEST REPORT
TENSILE TEST REPORT
 
20120140503011 2-3-4
20120140503011 2-3-420120140503011 2-3-4
20120140503011 2-3-4
 
12_Mahmoud_Rev6 (1)
12_Mahmoud_Rev6 (1)12_Mahmoud_Rev6 (1)
12_Mahmoud_Rev6 (1)
 
Assignment of weights method for the optimization of ti n coated carbide reaming
Assignment of weights method for the optimization of ti n coated carbide reamingAssignment of weights method for the optimization of ti n coated carbide reaming
Assignment of weights method for the optimization of ti n coated carbide reaming
 
Tofd tanker inspection development
Tofd tanker inspection developmentTofd tanker inspection development
Tofd tanker inspection development
 
Paper id 252014117
Paper id 252014117Paper id 252014117
Paper id 252014117
 
1F-Luigi-Pisu
1F-Luigi-Pisu1F-Luigi-Pisu
1F-Luigi-Pisu
 
G04454759
G04454759G04454759
G04454759
 
Optimization of Process Parameters of Wire Electrical Discharge Machining of ...
Optimization of Process Parameters of Wire Electrical Discharge Machining of ...Optimization of Process Parameters of Wire Electrical Discharge Machining of ...
Optimization of Process Parameters of Wire Electrical Discharge Machining of ...
 

Último

Traction part 2 - EOS Model JAX Bridges.
Traction part 2 - EOS Model JAX Bridges.Traction part 2 - EOS Model JAX Bridges.
Traction part 2 - EOS Model JAX Bridges.Anamaria Contreras
 
Innovation Conference 5th March 2024.pdf
Innovation Conference 5th March 2024.pdfInnovation Conference 5th March 2024.pdf
Innovation Conference 5th March 2024.pdfrichard876048
 
FULL ENJOY Call girls in Paharganj Delhi | 8377087607
FULL ENJOY Call girls in Paharganj Delhi | 8377087607FULL ENJOY Call girls in Paharganj Delhi | 8377087607
FULL ENJOY Call girls in Paharganj Delhi | 8377087607dollysharma2066
 
8447779800, Low rate Call girls in Kotla Mubarakpur Delhi NCR
8447779800, Low rate Call girls in Kotla Mubarakpur Delhi NCR8447779800, Low rate Call girls in Kotla Mubarakpur Delhi NCR
8447779800, Low rate Call girls in Kotla Mubarakpur Delhi NCRashishs7044
 
Memorándum de Entendimiento (MoU) entre Codelco y SQM
Memorándum de Entendimiento (MoU) entre Codelco y SQMMemorándum de Entendimiento (MoU) entre Codelco y SQM
Memorándum de Entendimiento (MoU) entre Codelco y SQMVoces Mineras
 
Call Girls in DELHI Cantt, ( Call Me )-8377877756-Female Escort- In Delhi / Ncr
Call Girls in DELHI Cantt, ( Call Me )-8377877756-Female Escort- In Delhi / NcrCall Girls in DELHI Cantt, ( Call Me )-8377877756-Female Escort- In Delhi / Ncr
Call Girls in DELHI Cantt, ( Call Me )-8377877756-Female Escort- In Delhi / Ncrdollysharma2066
 
PSCC - Capability Statement Presentation
PSCC - Capability Statement PresentationPSCC - Capability Statement Presentation
PSCC - Capability Statement PresentationAnamaria Contreras
 
8447779800, Low rate Call girls in Rohini Delhi NCR
8447779800, Low rate Call girls in Rohini Delhi NCR8447779800, Low rate Call girls in Rohini Delhi NCR
8447779800, Low rate Call girls in Rohini Delhi NCRashishs7044
 
2024 Numerator Consumer Study of Cannabis Usage
2024 Numerator Consumer Study of Cannabis Usage2024 Numerator Consumer Study of Cannabis Usage
2024 Numerator Consumer Study of Cannabis UsageNeil Kimberley
 
NewBase 19 April 2024 Energy News issue - 1717 by Khaled Al Awadi.pdf
NewBase  19 April  2024  Energy News issue - 1717 by Khaled Al Awadi.pdfNewBase  19 April  2024  Energy News issue - 1717 by Khaled Al Awadi.pdf
NewBase 19 April 2024 Energy News issue - 1717 by Khaled Al Awadi.pdfKhaled Al Awadi
 
IoT Insurance Observatory: summary 2024
IoT Insurance Observatory:  summary 2024IoT Insurance Observatory:  summary 2024
IoT Insurance Observatory: summary 2024Matteo Carbone
 
Flow Your Strategy at Flight Levels Day 2024
Flow Your Strategy at Flight Levels Day 2024Flow Your Strategy at Flight Levels Day 2024
Flow Your Strategy at Flight Levels Day 2024Kirill Klimov
 
8447779800, Low rate Call girls in Uttam Nagar Delhi NCR
8447779800, Low rate Call girls in Uttam Nagar Delhi NCR8447779800, Low rate Call girls in Uttam Nagar Delhi NCR
8447779800, Low rate Call girls in Uttam Nagar Delhi NCRashishs7044
 
International Business Environments and Operations 16th Global Edition test b...
International Business Environments and Operations 16th Global Edition test b...International Business Environments and Operations 16th Global Edition test b...
International Business Environments and Operations 16th Global Edition test b...ssuserf63bd7
 
Contemporary Economic Issues Facing the Filipino Entrepreneur (1).pptx
Contemporary Economic Issues Facing the Filipino Entrepreneur (1).pptxContemporary Economic Issues Facing the Filipino Entrepreneur (1).pptx
Contemporary Economic Issues Facing the Filipino Entrepreneur (1).pptxMarkAnthonyAurellano
 
Global Scenario On Sustainable and Resilient Coconut Industry by Dr. Jelfina...
Global Scenario On Sustainable  and Resilient Coconut Industry by Dr. Jelfina...Global Scenario On Sustainable  and Resilient Coconut Industry by Dr. Jelfina...
Global Scenario On Sustainable and Resilient Coconut Industry by Dr. Jelfina...ictsugar
 
Kenya’s Coconut Value Chain by Gatsby Africa
Kenya’s Coconut Value Chain by Gatsby AfricaKenya’s Coconut Value Chain by Gatsby Africa
Kenya’s Coconut Value Chain by Gatsby Africaictsugar
 
Case study on tata clothing brand zudio in detail
Case study on tata clothing brand zudio in detailCase study on tata clothing brand zudio in detail
Case study on tata clothing brand zudio in detailAriel592675
 

Último (20)

Traction part 2 - EOS Model JAX Bridges.
Traction part 2 - EOS Model JAX Bridges.Traction part 2 - EOS Model JAX Bridges.
Traction part 2 - EOS Model JAX Bridges.
 
Japan IT Week 2024 Brochure by 47Billion (English)
Japan IT Week 2024 Brochure by 47Billion (English)Japan IT Week 2024 Brochure by 47Billion (English)
Japan IT Week 2024 Brochure by 47Billion (English)
 
Innovation Conference 5th March 2024.pdf
Innovation Conference 5th March 2024.pdfInnovation Conference 5th March 2024.pdf
Innovation Conference 5th March 2024.pdf
 
FULL ENJOY Call girls in Paharganj Delhi | 8377087607
FULL ENJOY Call girls in Paharganj Delhi | 8377087607FULL ENJOY Call girls in Paharganj Delhi | 8377087607
FULL ENJOY Call girls in Paharganj Delhi | 8377087607
 
8447779800, Low rate Call girls in Kotla Mubarakpur Delhi NCR
8447779800, Low rate Call girls in Kotla Mubarakpur Delhi NCR8447779800, Low rate Call girls in Kotla Mubarakpur Delhi NCR
8447779800, Low rate Call girls in Kotla Mubarakpur Delhi NCR
 
Memorándum de Entendimiento (MoU) entre Codelco y SQM
Memorándum de Entendimiento (MoU) entre Codelco y SQMMemorándum de Entendimiento (MoU) entre Codelco y SQM
Memorándum de Entendimiento (MoU) entre Codelco y SQM
 
Call Girls in DELHI Cantt, ( Call Me )-8377877756-Female Escort- In Delhi / Ncr
Call Girls in DELHI Cantt, ( Call Me )-8377877756-Female Escort- In Delhi / NcrCall Girls in DELHI Cantt, ( Call Me )-8377877756-Female Escort- In Delhi / Ncr
Call Girls in DELHI Cantt, ( Call Me )-8377877756-Female Escort- In Delhi / Ncr
 
PSCC - Capability Statement Presentation
PSCC - Capability Statement PresentationPSCC - Capability Statement Presentation
PSCC - Capability Statement Presentation
 
8447779800, Low rate Call girls in Rohini Delhi NCR
8447779800, Low rate Call girls in Rohini Delhi NCR8447779800, Low rate Call girls in Rohini Delhi NCR
8447779800, Low rate Call girls in Rohini Delhi NCR
 
2024 Numerator Consumer Study of Cannabis Usage
2024 Numerator Consumer Study of Cannabis Usage2024 Numerator Consumer Study of Cannabis Usage
2024 Numerator Consumer Study of Cannabis Usage
 
NewBase 19 April 2024 Energy News issue - 1717 by Khaled Al Awadi.pdf
NewBase  19 April  2024  Energy News issue - 1717 by Khaled Al Awadi.pdfNewBase  19 April  2024  Energy News issue - 1717 by Khaled Al Awadi.pdf
NewBase 19 April 2024 Energy News issue - 1717 by Khaled Al Awadi.pdf
 
IoT Insurance Observatory: summary 2024
IoT Insurance Observatory:  summary 2024IoT Insurance Observatory:  summary 2024
IoT Insurance Observatory: summary 2024
 
Flow Your Strategy at Flight Levels Day 2024
Flow Your Strategy at Flight Levels Day 2024Flow Your Strategy at Flight Levels Day 2024
Flow Your Strategy at Flight Levels Day 2024
 
8447779800, Low rate Call girls in Uttam Nagar Delhi NCR
8447779800, Low rate Call girls in Uttam Nagar Delhi NCR8447779800, Low rate Call girls in Uttam Nagar Delhi NCR
8447779800, Low rate Call girls in Uttam Nagar Delhi NCR
 
International Business Environments and Operations 16th Global Edition test b...
International Business Environments and Operations 16th Global Edition test b...International Business Environments and Operations 16th Global Edition test b...
International Business Environments and Operations 16th Global Edition test b...
 
Contemporary Economic Issues Facing the Filipino Entrepreneur (1).pptx
Contemporary Economic Issues Facing the Filipino Entrepreneur (1).pptxContemporary Economic Issues Facing the Filipino Entrepreneur (1).pptx
Contemporary Economic Issues Facing the Filipino Entrepreneur (1).pptx
 
Corporate Profile 47Billion Information Technology
Corporate Profile 47Billion Information TechnologyCorporate Profile 47Billion Information Technology
Corporate Profile 47Billion Information Technology
 
Global Scenario On Sustainable and Resilient Coconut Industry by Dr. Jelfina...
Global Scenario On Sustainable  and Resilient Coconut Industry by Dr. Jelfina...Global Scenario On Sustainable  and Resilient Coconut Industry by Dr. Jelfina...
Global Scenario On Sustainable and Resilient Coconut Industry by Dr. Jelfina...
 
Kenya’s Coconut Value Chain by Gatsby Africa
Kenya’s Coconut Value Chain by Gatsby AfricaKenya’s Coconut Value Chain by Gatsby Africa
Kenya’s Coconut Value Chain by Gatsby Africa
 
Case study on tata clothing brand zudio in detail
Case study on tata clothing brand zudio in detailCase study on tata clothing brand zudio in detail
Case study on tata clothing brand zudio in detail
 

Tvu+1177

  • 1. ANEC-R&T-2007-CHILD-002 Maschinen-, Hebe- und Fördertechnik Fachbereich Spiel-, Sport-, Freizeitgeräte Akkreditierte Prüf-, Überwachungs- und Zertifizierungsstelle Notified Body 0408 Report about a Round Robin Test EN 1177:1997 Impact Absorbing Playground Surfacing Test methods for determination of the Critical Fall Height Within the framework of ANEC (European Association for the Coordination of Consumer Representation in Standardisation) Dipl.-Ing. Adolf Russold TÜV Austria Page 1 to 18 Signature Vienna, March 2007 1
  • 2. Content of the Report: 1. Task of the Round Robin Test 1.1 Background 1.2 Purpose 1.3 Scope 2. Test conditions 3. Methodology and Performance 3.1 Testing procedure 3.2 Evaluation of measurements 3.3 Test equipment and measurements 4. Results and further investigations 4.1 Consequences of results (Table 1) 4.2 Acceptability of final results in a test report 5. Summary 1. Task of the Round Robin Test 1.1 Background: In children´s playgrounds most of the injuries are caused by falls. It is considered that the most severe injuries are injuries to the head. The impact attenuating properties of surfacing are therefore of major importance to reduce the severity of those injuries. That is why CEN/TC136/SC1 developed EN 1177, a standard that sets the test method by which the impact attenuation properties of a surface can be determined. This method is considered to be the best model available to predict the likelihood of head injury resulting from falls. It gives a “critical fall height” for surfacing, which means the maximum acceptable fall height associated with different types of impact attenuating surfacing (IAS) materials in order to reduce the risk of head injuries. The standard EN 1177 was published in 1997 and at that time, the test method was based on the results of the few test equipment available on the market (3 models). In the meantime also other models of test equipment have been developed and they are used not only by test houses but also by a variety of organisations and individuals with different backgrounds and level of experience. This has led to a 2
  • 3. situation where serious disparities between test results were found which created uncertainty about the current safety level of the IAS that are used on playgrounds. EN 1177 is under revision now and a working group of experts within SC1 has identified the need to analyse the factors influencing these differences. Probable reasons have been found like inaccuracy of measuring equipment (calibration) and of the measurement equipment for evaluation and calculation. To be able to improve requirements in order to give more certainty on the safety level of surfacing, TC 136/SC1 decided that a round robin test is carried out. Test houses were ready to carry out the tests at their own costs, but funding for the supervision by an independent body was needed and offered from ANEC. ANEC outlined a tender to a R&T project for a round robin test for impact measurement on playground surfacing materials and the offer of TÜV Austria was chosen to prepare, organise and supervise this test, including the evaluation of the test results and possible improvements for the revision of EN 1177. The tests were carried out under the responsibility of Mr. Adolf Russold from TÜV Austria, who is also Convenor of the SC1- Working Group (WG 1) dealing with the revision of EN 1777. Project Advisor at ANEC is Mrs. Helena Menezes from APSI (Portuguese Association for Child Safety Promotion) . 1.2 Purpose: The purpose of this R&T project was to carry out a round-robin test, involving test laboratories from different European countries, to investigate all relevant possibilities of uncertainties and define maximum tolerances to avoid major deviations in test results, leading to unsafe situations on playgrounds. According to the findings, additional requirements or specifications will be added to the standard EN 1177 during its revision, in order to improve the reliability of the test equipment. This will set up a quality standard for test equipment used by test houses as well as by other operators which, in turn, will ensure the safety level for IAS required by the playground standard. 1.3 Scope At the moment the nominal value for the critical fall height shall be expressed according to EN 1177:1997 in metres to one decimal place without rounding. This can lead to situations that in case of a difference of at least 110mm (0,11m) in the test results of different test-labs the nominal value confirmed in the test reports could differ in maximum by 200mm (0,2m), e.g. if one result is 1,79m and the other result is 1,90m (gives nominal critical fall heights of 1,7m in the one case and 1,9m 3
  • 4. in the other case). The same nominal result in this situation would also be given with a much higher difference of 0,28m in the test results, e.g. 1,71m and 1,99m. The task of the round robin test was to reduce the deviations in the results for the nominal critical fall heights (e.g. to maximal 0,1m, i.e. less tan 0,11m) and to improve the safety for users and operators of playgrounds by reliable test reports. To reach this goal it was to investigate which improvements of the requirements on test equipment as given in EN 1177:1997 are necessary and possible, considering also the deviations given independently from the equipment by the inhomogeneity of the materials to be tested (synthetic tiles, compound material, loose fill material, etc.) to find the practical acceptable tolerance. 2. Test conditions The tests have been carried out according to EN 1177:1997 on three different types of samples of synthetic tiles with different thicknesses, which are used as impact attenuating surfaces on playgrounds. From each type, two tiles of the same production (PI and PII) were tested to compare also uncertainties in the production: Type 50mm : Sample PI and Sample PII- 50mm thickness Type 75mm : Sample PI and Sample PII- 75mm thickness Type 100mm: Sample PI and Sample PII- 100mm thickness Tests on Samples PI: 4 specified drop heights on each of 3 points (P1, P2, P3), which have been marked on the sample Tests on Samples PII: 1 specified drop height on each of 3 points (P1, P2, P3 – marked at the same positions as on sample P1) On Samples PI the drop tests were carried out according to EN 1177:1997 from the lowest to the highest drop height . On Sample PII only one of the drop heights used in the test of Sample PI was chosen to identify deviations caused by production and/or inhomogeneity of the products as well as by an influence of the sequence of the drop tests. Measurements of the Head Injury Criterion HIC, the maximum acceleration at each impact amax [g] and the time interval for the calculation of the time/acceleration curve ΔtHIC [msec], as defined in EN 1177:1997, were tabled in a prepared format (see page 8). 3. Methodology and performance: 11 test houses from 8 European countries with 12 test apparatus took part on this round robin test (listed in alphabetic order – see table). 4
  • 5. Name Adress Country Contact AIJU Technology Center Avenida de la Industria, 23 , 03440 Ibi (Alicante) Spain María Cruz Arenas CST - Centre for Sports Technology Ltd Unit 3: Greenwhich Centre Business Park, 53 Norman Road, London SE 10 9QF United Kingdom Greame Tipp DTI Danish Technological Institute Teknologiparken, Kongsvang Allé 29, DK- 8000 Aarhus C, Denmark Danemark Kent Lemming IBV - Instituto de Biomecanica de Valencia, Universidad Politéchnica de Valencia Edificio 9 C, Camino de Vera s/n, E-46022 Valencia, Espania Spain Juan V. Durà ISA Sport Papendallaan 31, 6816 VD Arnhem, Netherlands Netherlands Gert-Jan de Kieft ITC - Institute For Testing and Certification a.s. Tř. T. Bati 299, CZ-764 21 Zlin Czech. Rep. Ludmilla Antosova Laboratories Pourquery Laboratoires Pourquery 93 boulevard du Parc d'Artillerie 69354 LYON cedex 07 France Clément Charmasson Labosport France LABOSPORT TECHNOPARC 72100 LE MANS France Arnaud Louveau TÜV Österreich 1015 Wien, Krugerstraße 16 Austria Adolf Russold TÜV Rheinland Product Safety VWA – Voedsel en Waren (2 test equipment) 51105 Köln Am Grauen Stein Westelijke parallelweg 4 3331 EW, Zwijndrecht Netherlands Germany Netherlands Berthold Tempel Dico van den Ouden Requirement for the participating test houses was compliance with ISO/IEC 17025. From most of laboratories the certificates about accreditation are still missing. 3.1 Testing procedure 5
  • 6. The test probes (in sum 3x2 tiles) have been sent in a container (fabricated with the dimensions of the tiles) from one test house to the next, so that all laboratories made the test on the same probes. The first test was carried out by TÜV Austria to define the most representative drop heights for determination of the critical fall height at a HIC-value of 1000 as defined in EN 1177:1997. The last test after tested by all participants was again made by TÜV Austria to compare the properties of the test probes with the condition at the first test with the same apparatus. The results of the measurements of each laboratory were sent after each test to the supervisor for evaluation. The completed formats with all measurements as described above are included in Annex 1. 3.2 Evaluation of measurements The evaluation of all measurements was carried out by the supervisor in accordance with EN 1177:1997. For all tiles type PI the curves (HIC/ drop height) were drawn for each point tested (P1, P2 anP3), as shown in figure C.2 of the standard. In deviation to this figure the drop heights for this test have been chosen in advance (first test at TÜV Austria) in such a way, that two of the HIC values were expected above HIC 1000 and two values below HIC 1000. This gives more accuracy for measuring the critical fall height at HIC 1000 and will be an improvement of the standard which is already proposed (Draft prEN 1177:January 2006 clause 4.4.4). Because the task of this round robin test was to investigate the accuracy of the apparatus, only 3 defined points on each tile were tested and the critical fall height for each of the 3 points on a tile was evaluated separately. These 3 critical fall heights are listed in the table of results for each tile (see page 9 of this report) and the differences between the results demonstrated. Remark:For definition of the critical fall height of a whole surface consisting of single tiles the standard requires instead of this testing procedure that nine points on four tiles have to be measured. Only the curve giving the lowest drop height from all nine measurements defines the critical fall height. Because the curves in different points of a surface differ from each other (see the difference in critical fall heights in the table), the comparison of the final critical fall heights (the lowest for all points) would not allow to analyse deviations in single measurements any more. The values for the critical fall height in each point tested were found graphically by measuring the height out of each (HIC/drop height) curve-diagram. The curves in the diagram were traced by a geometrical function connecting the measured HIC-values which give a nearly linear figure. 6
  • 7. 3.3 Test equipment and measurements A format for the description of the test equipment was sent to each laboratory (see below). Draft Formate HIC-Round Robin 1. Testing Laboratory: Name and address: Legal status: (accreditation certificate, ...) Supervisor for the test: 2. Test Equipment acc. EN 1177 Headform: mass and shape mass in grams: - drawing with measurements position of accelerometer - guided headform - free fall headform - radius at impact area r in mm Accelerometer: Number (1 axial, 3 axial) - Type - Position - Sensitivity (pC/g, mV/g) - uncertainty / protocol for calibration Measuring equipment: Amplifyer: - type - sampling rate (frequency) - filter … - uncertainty complete Height measurement - equipment/type - uncertainty Speed measurement (if applicable) - equipment/types - uncertainty Validation of HIC calculations - method - uncertainty 7
  • 8. TEST PROTOCOL Round Robin Test for HIC 2006 INSTITUTE: Name: Address: Date of receipt: Date of test: Date of sending : to: …………… Test equipment (Id.No.) Name of responsible tester: Tempterature at the test: rel. humidity at the test: RESULTS: TYPE 50mm HIC amax [g] ΔtHIC [msec] HIC amax [g] ΔtHIC [msec] HIC amax [g] ΔtHIC [msec] Tile P I Drop height H1= 1200mm Drop height H2= 1400mm Drop height H3= 1600mm Drop height H4= 1800mm Drop height H5= 1200mm Tile P II Drop height H= 1400mm TYPE 75mm HIC amax [g] ΔtHIC [msec] HIC amax [g] ΔtHIC [msec] HIC amax [g] ΔtHIC [msec] Tile P I Drop height H1= 1800mm Drop height H2= 2000mm Drop height H3= 2200mm Drop height H4= 2400mm Drop height H5= 1800mm Tile P II Test points P1 P2 P3 Test points P1 P2 P3 Drop height H= 2000mm TYPE 100mm HIC amax [g] ΔtHIC [msec] HIC amax [g] ΔtHIC [msec] HIC amax [g] ΔtHIC [msec] Tile P I Drop height H1= 2500mm Drop height H2= 2700mm Drop height H3= 2900mm Drop height H4= 3100mm Drop height H5= 2500mm Tile P II Drop height H= 2700mm Remarks: ΔtHIC [msec] ... t2-t1 for HIC-calculation Each drop test for tiles I shall start at each test point with the lowest drop height and shall be continued immediately with the next drop height. The last drop height shall be the same as the first drop height. The time difference between each drop test shall be lower than 2 min. All time/acceleration curves to be recorded. Test points P1 P2 P3 3-HIC-round_robin_test_protocoll_engl(1) 31.01.2007 Test protocols with results and HIC/ time curves see Annex 1 and Annex2. 8
  • 9. 4. Results and further investigations Table 1: Single critical fall heights for each point Critical fall heights [m] Type 50 mm Type 75 mm Type 100 mm 50-P1 50-P2 50-P3 75-P1 75-P2 75-P3 100- P1 100- P2 100- P3 Lab. No. 1 1,41 1,41 1,41 1,98 1,96 1,98 2,76 2,76 2,67 Lab. No. 2 1,42 1,45 1,45 2,05 2,05 2,05 2,80 2,85 2,85 Lab. No. 3 1,55 1,58 1,58 2,28 2,30 2,30 3,40 3,40 3,40 Lab. No. 4 1,43 1,45 1,46 2,04 2,08 2,08 2,82 2,83 2,87 Lab. No. 5 1,46 1,46 1,46 2,08 2,05 2,08 2,83 2,83 2,83 Lab. No. 6 1,47 1,47 1,48 2,12 2,11 2,15 2,92 3,00 3,02 Lab. No. 7 1,42 1,47 1,46 2,08 2,13 2,09 2,87 2,93 2,88 Lab. No. 8 1,43 1,45 1,44 2,13 2,02 2,08 2,88 2,92 2,89 Lab. No. 9 1,48 1,50 1,50 2,15 2,14 2,13 3,15 3,11 Lab. No. 10 1,50 1,52 1,48 2,15 2,15 2,08 2,85 2,90 2,87 Lab. No. 11 1,52 1,50 1,51 2,17 2,10 2,08 2,88 2,85 2,83 Lab. No. 12 max. difference [m] O,10 0,07 0,07 0,13 0,13 0,10 0.08 0,10 0,06 max. deviation in % 7,0% 4,8% 4,9% 6,4% 6,4% 4,8% 2,9% 3,5% 2,1% max. difference [m] 0,14 0,17 0,17 0,30 0,34 0,32 0,64 0,64 0,64 max. deviation in % 9,9% 12,1% 12,1% 15,2% 17,3% 16,1% 23,2% 23,2% 23,2% The table shows the results for the critical fall heights in the measured points (P1,P2 and P3) for the 3 types of tiles PI evaluated in Annex 2. The measured values on tile PII are listed in the test protocols in Annex 1. They are in the same range as the values on PI and are not considered in Table 1. This table needs to be commented as follows: A. Red markings: - Lab. No. 1 had the lowest critical fall heights (highest HIC-values) - Lab. No. 3 had the highest critical fall heights (lowest HIC-values) and had on tile type 100mm no HIC-value above HIC 1000 (the curves were extrapolated to find the value for the critical fall height) - Lab. No. 6 had on type 100mm only one point with HIC above 1000 - Lab. No. 9 had on type 100mm no HIC-value above HIC 1000 (extrapolation of P1-curve not possible) - Lab. No. 12 made wrong measurements and was not included in evaluation These results show bigger differences in the fall heights than the intended task ( i.e.max. 0,34m>>0,11m) and therefore further investigations for improvement of the measuring system have been carried out. B. Green markings: Majority of results, based on formally correct measurements. The max. deviation 9
  • 10. is here 0,13m which is closer to the task of 0,11m, but nevertheless possible improvements on the accuracy were investigated for all results. 4.1 Consequences from Table 1: Although the test points P1, P2 and P3 have been marked on the tiles before the test, the repeatability and characteristics of the values measured show deviations within the same apparatus (see evaluation in Test Protocols Annex 1). Reasons and degrees of variations have been investigated as follows: 4.1.1 Behaviour of surfacing material: Anticipating that the measuring process remains unchanged for a given apparatus, deviations in the results can occur as well from inhomogeneities in the tested material as from a certain compression effect caused from the former test impacts. Hitting not exactly the same point of the marked test position at each drop test, which is in practice always given, can in addition lead to some deviations in the results, which depend on the structure of the surfacing material. Test results within each apparatus (dispersions of measurements Annex 1): For these comparisons no extra table was created. 1. Compression effect from former impacts: The differences between 2 repeated HIC-values, measured from drop height H1 on tile PI, varies in a range between –7% lower value and +20% higher value at the second impact on the same point. Apart from these single extremes there are generally slightly increased HIC values ( +0% to +5%) with single higher measurements as well in + as in –direction, but without a reasonable systematic in the sequence, which could be a consequence of compression. 2. Inhomogeneity of material: The dispersions of HIC-values, measured over the surface Tile PI ( in the points P1, P2, P3), expressed by HICmax/ HICmin in %, vary in a range between 0% and max. 16%. Most of these dispersions are below 10%. The sequence of dispersions cannot be explained by inhomogeneities alone. 3. Final comparison test (Lab. No. 4-2): The final test after the round robin showed deviations of HIC to the initial test ( Lab. No. 4-1) between max. +4/ -5%. Compared with the dispersions within one test procedure (see pt. 2) this result confirms that no change of the test tile during the test procedures of the round robin has occurred. Note: A negative value (lower HIC-value) in the repeated test is not probable because it would mean a softening of material instead of a compression. 10
  • 11. 4. Comparison tests on tiles PII: The tests for one drop height H2 in the points P1, P2, P3 of each tile PII are differing from the comparable values on tile PI in a range between max. --14% and +16%, with a tendency of about - 5% lower HIC-values than on tile PI. This result shows the difference in the production of the tiles and can be neglected, when compared with the dispersions within the tiles PI. . Conclusion: 1. The compression effect on the same point in a series of drops can be considered as negligible, because the dispersions of HIC-values measured are within the range of the uncertainties of all the other measurements over the surface and the tendency of +5% is therefore no clear indication for a relevant compression effect. 2. The inhomogeneity of the material does not show a relevant influence on the variable +-dispersion of the results in the different points of the surface tested and can be neglected too for the further investigations. 3. The final comparison test after the whole round robin test procedure does not show a relevant change of properties on the tested material. 4. The tests on the second tiles PII of the same production do not show relevant differences to the tiles PI. 4.1.2 Uncertainties of the measurement system As the dispersions of measurements shown in 4.1.1 are not caused mainly by the material, this leads to the conclusion that they have to be considered as uncertainties in measurements of the apparatus. Reasons for possible dispersions in the results, caused by the test apparatus itself as defined now in EN 1177:1997 , were identified at the meeting of the participants of the round robin test on 22 January 2007. Improvements by giving more precise definitions for the measurement system of the apparatus have been found and partly confirmed by further investigations. They will be proposed for the revision of the standard (see pt. 4.1.4 measuring equipment). Unfortunately it was not possible to receive more detailed information about the measurement systems and about accuracies of instruments used from the majority of participants. For this reason it was not possible to calculate an uncertainty budget and to find a more precise estimation for the results of improvements which have been proposed for the revision of the standard EN1177. 11
  • 12. 4.2 Acceptability of the final result in a Test Report: The dispersions in the single measurements for the HIC values are not fully relevant for the final determination of the critical fall height, which is the end result of a complete impact test for the impact attenuation of a surface. EN 1177:1997 requires to draw the relevant HIC/ drop height- curve created only from all highest HIC- values in 9 drop tests to evaluate the critical fall height at HIC 1000. This method eliminates the measured lower HIC-values, so that the relevant result for the critical fall height is the lowest value from all measurements. This provides more safety for the user on the playground. As an additional safety this lowest value shall be rounded down to the lower decimal of a meter (e.g. 1,59m is reported as 1,5m). In this round robin test only 3 defined points have been measured (instead of 9 points as required in EN 1177:1997, including also joints of tiles), to have precise conditions for the main task of this test, which was to compare the accuracy of apparatus. Following the standard also for this special case and taking the lowest values from these drop tests, Table 1 would lead to final results for the critical fall height as given in Table 2. Following the task of this test, these values have not been rounded down to the lower decimal to show the real differences. Note: It should be considered that when carrying out the complete test according the standard (testing more points and also the joints between the tiles) the final results could be lower than found for these 3 points! Table 2: Critical Fall Height acc .EN 1177 Critical fall height in {m] Type 50mm Type 75 mm Type 100 mm ( acc. EN 1177:1997) 50-P1 75-P1 100-P1 Lab. No. 1 1,41 1,96 2,67 Lab. No. 2 1,42 2,05 2,80 Lab. No. 3 1,55 2,28 3,40 Lab. No. 4 1,43 2,04 2,82 Lab. No. 5 1,46 2,05 2,83 Lab. No. 6 1,47 2,12 2,92 Lab. No. 7 1,42 2,08 2,87 Lab. No. 8 1,43 2,02 2,88 Lab. No. 9 1,48 2,13 Lab. No. 10 1,48 2,08 2,85 Lab. No. 11 1,50 2,08 2,83 Lab. No. 12 0,08 0,11 0,08 Max. difference in [m] 0,14 0,32 0,73 5,6% 5,4% 2,9% Max. deviation in % 9,9% 16,3% 27,3% lowest incorrect incorrect highest 12
  • 13. These results show that although the dispersions in the HIC- measurements within one test apparatus will be compensated to the safe direction, it remains the situation that the differences between the different apparatus lead to end results with higher differences than intended. 4.2.1 CONSEQUENCES OF THE ROUND ROBIN TEST FOR IMPROVEMENTS The first step was to look for the measurement systems in the different apparatus and for the sources of differences in measurements. Table 3 shows the min. and max. a- values as well as HIC-values measured from all drop heights on each test tile and gives below the maximal dispersions from all apparatus in %, marking the Labs in the same way as above. Table 3: HIC and acceleration [a]- measurements Type 50 mm Type 75 mm Type 100 mm HICmin amin HICmax amax HICmin amin HICmax amax HICmin amin HICmax amax Lab. No. 1 677 134 1703 226 807 130 1450 178 856 121 1261 148 Lab. No. 2 705 137 1611 223 774 129 1327 172 803 117 1148 142 Lab. No. 3 588 131 1388 215 613 118 1085 161 584 102 866 127 Lab. No. 4 637 134 1589 228 729 127 1351 177 768 116 1158 146 Lab. No. 5 682 142 1530 223 764 132 1320 175 806 120 1153 146 Lab. No. 6 657 140 1504 222 735 130 1253 171 743 117 1071 140 Lab. No. 7 656 139 1616 233 719 130 1303 176 742 117 1125 145 Lab. No. 8 678 139 1280 208 747 130 1340 176(184) 782 118 1147 143 Lab. No. 9 600 132 1508 225 632 122 1248 174 711 113 994 136 Lab. No.10 657 141 1524 221 694 127 1223 168 737 118 1188 145 Lab. No.11 642 133 1472 205 703 125 1282 171 791 117 1153 144 Lab. No.12 Dispersion % 14 7 33 14 28 8 19 6 9 3 6 3 Dispersion % 16 8 33 14 32 12 34 11 47 19 46 17 This comparison shows that the max. HIC-values, which are relevant for the determination of the critical fall height, vary between 6% and 33% even in the green area, but between 33% and 46% in the red area (for the min. HIC- values this goes up to 47%). On the other hand the dispersion of the acceleration-values [a] is much lower. The amax-values vary between 3% and 14% in the green area and between 11% and 17% in the red area (for amin-values up to 19%). Conclusion: The differences in the HIC- values are caused by a minor dispersion of acceleration [a] measurements and a much bigger part of dispersions in the acceleration/ time curve 13
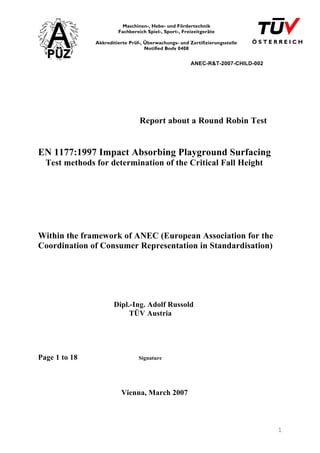
  • 14. [g]/ [t] respectively in the evaluation of this curve acc. the formula for HIC, as defined in EN 1177. Figure 1 shows a correct acceleration/time curve as given in the standard EN 1177 and the formula for calculation of HIC by evaluating this curve. The dimensions for accelerations are given in [g= gravity 9,81m/s2 ] and for time t in [ms]. Figure 1: Impact acceleration / time curve ( ) maxHIC 12 5,2 12 2 1 ⎥ ⎥ ⎥ ⎥ ⎥ ⎦ ⎤ ⎢ ⎢ ⎢ ⎢ ⎢ ⎣ ⎡ −× ⎟ ⎟ ⎟ ⎟ ⎠ ⎞ ⎜ ⎜ ⎜ ⎜ ⎝ ⎛ − × = ∫ tt tt dt t t a 4.2.2 IMPROVEMENTS FOR HIC-MEASUREMENTS: The following improvements for the impact measuring equipment have been identified following the results of this round robin test. As explained in pt. 4.1.2, it is not possible at the moment to give exact values for the final result from these improvements, which are therefore restricted to single estimations. 1. The accelerometer measurement system must be able to measure all relevant frequencies for tracing the exact [g]/ [t]- curve. It is necessary to define also the lower limiting frequency to get sufficient lower response and to reduce the amplitude error by overshooting the baseline after the impact and underestimating the g-max.and HIC- score, as shown in Figure 6.8. This error is bigger in particular for longer pulse durations. An accelerometer with a time constant of 2s or greater and appropriate signal conditioning will generally meet this requirement. The example for such overshooting is out of a data sheet from a manufacturer of such measuring instruments and shows such incorrect curves (full lined), which will lead to wrong HIC- values. 14
  • 15. Also the amplitude accuracy at higher frequencies and requirements for the filter need to be defined to avoid wrong incorrect curves caused by the “ringing”-effect (right curve). More details about such requirements are in ISO 6487, to which a reference will be made in the revised EN 1177. Source: Brüel & Kjaer, Denmark Additional tests made by C.S.T. after the round robin test have confirmed these overshooting measurements to minus g-values (in the Fig. named F(t)), which are not existing in reality and which therefore are amplitude errors caused from insufficient low frequency response of the measurement system. The lower limit for the frequency measurement is therefore proposed for the revision of the standard with 0,3 Hz to keep this error below 5% for pulse durations up to about 30ms. Note: This limitation was made for practical reasons to allow the mostly used piezo electric gauges, which reach at 0,3Hz the limit of accuracy. Very soft impact materials (e.g. loose fill material) can have longer pulse durations up to 50ms which can cause amplitude errors up to 10%. 2. Calibration of measuring equipment: Only calibrated measuring instruments shall be used for the measurement of the drop height (in case of free fall head forms) respectively of the velocity before the impact (in case of guided head forms) and for the measurement of the acceleration (accelerometers). The usual measurement uncertainties for such instruments are proposed for the revision of the standard EN 1177 and periodical calibration will be required. For accelerometers a guide on acceptable calibration levels will have to be elaborated in future, taking ISO 6487 into consideration. 15
  • 16. 3. Release system for the headform: The release system shall not create any significant rotation of the headform which can affect the vertical acceleration values measured at the impact point. A comparison test at the beginning of each test series to identify such effects is proposed for the revision of the standard. 4. HIC – calculation: An independent check for the computer algorithm by imposing a half sinus curve and comparing the result with the result of the computer is proposed for the revision of the standard. 4.2.3 CONSEQUENCES ON THE FINAL RESULTS FOR THE CRITICAL FALL HEIGHT: The improvements proposed are expected to lead to lower dispersions in the HIC- values than found in the round robin test. This means in practice dispersions of ca. 5% for short pulse durations and up to 10% for longer pulse durations up to 50ms in case of soft impact attenuating material. The consequences of such dispersions in the HIC- values on the critical fall height depend on the inclination of the HIC/drop-height curve and lead to different deviations in the final result. This influence is demonstrated in Figure 2 on the simple example for an anticipated deviation of 10% in HIC-values (shown in this figure for HIC 1000 and HIC 1100) within one and the same curves of Lab. No. 4-1. This simplification is possible because the “curves” are nearly linear and would have the same effect for another “curve” with 10% higher HIC-values. We can see that in such a case the difference in the fall height would be ca. 6cm for the steep curve (“harder” tile Type 50mm), but ca. 17cm for the flat curve (“softer” tile Type 100mm). The red arrows show the difference in the result. It shows also that these differences in the critical fall heights are always based on the same dispersion of HIC (in this case 10%) and in both cases would have the same acceptable safety tolerance. Note: These differences become bigger on flatter curves, e.g. in case of loose fill surfacing material, which was not subject of this test. 16
  • 17. Figure 2: Critical fall height for HIC 1000 and HIC 1100 0 200 400 600 800 1000 1200 1400 1600 1800 0,0 0,5 1,0 1,5 2,0 2,5 3,0 3,5 Drop height [m] HIC 50-P1 50-P2 50-P3 75-P1 75-P2 75-P3 100-P1 100-P2 100-P3 This result shows that the improvement of reducing the dispersions in the HIC- values cannot solve the formal problem that the final result for the critical fall height can differ more than 0,1m in case of soft material, as it was the original task of this project. It is to say that this task was also a wish from the market to avoid different classifications in test reports of playground surfacing. Nevertheless these differences in the critical fall height will not affect the safety of the surfacing. Provided that all improvements on the measuring system are made as proposed, in any case of such differences the values for HIC would not differ more than 10%, which seems to be an acceptable tolerance for the safety of the user. In particular for soft materials (e.g. loose fill surfacing) a bigger tolerance than 0,1m in the critical fall height results will be expected and can be accepted therefore. It is to state that under such complex conditions no uncertainty budget could be calculated. The practical results of the proposed improvements will have to be investigated in a further round robin test. 17
  • 18. 5. SUMMARY Tasks of the round robin test: Task 1 of this round robin test was to improve safety of surfacing on playgrounds by improving the accuracy of the test method described in EN 1177:1997 in its revision. It was intended to reach a difference of not more than one decimetre (100mm) in the final results of the critical fall height. Task 2 was to determine the measurement uncertainty of the measuring equipment by calculation of the uncertainty budget as a basis for task 1. Task 3 was to improve the standard EN 1177:1997 using all the results and their consequences by concrete amendments for the revision of this standard. Results: TASK 1 was considered for accredited test laboratories as well as for other operators. Subject of this round robin test was to compare test laboratories only. 11 European test houses with 12 partly different types of test equipment were participating in this test, which was running from May 2006 to January 2007. All tests have been carried out on the same samples in a defined test procedure, laid down by the independent supervisor of the test. The samples were tested before and after the round robin test to identify any changes from transport or testing. The results were evaluated by the supervisor and analysed with the participants in a separate meeting with a follow up meeting of CEN/TC136/SC1/WG1 and the advisor of ANEC. This task could be reached for the test equipments by identifying the reasons for major deviations in the test results received, leading to necessary improvements in the measurement requirements which will be proposed for the revision of the standard. Nevertheless the originally intended tolerance of one decimetre (100mm) in the final result for the critical fall height needed to be replaced by the real safety criteria, which is the tolerance in the measured HIC-values. This tolerance is proposed for the revision of EN 1177 with 5%, but must be expected up to 10% for long pulse durations (soft materials) when improving the existing apparatus according the given proposals. This is an acceptable tolerance for the safety of users and the resulting differences in the critical fall height given in the test report, even if more than 0,1m, will always be in compliance with this HIC-tolerance. Remark: Deviations caused by inhomogeneities in the material cannot be prevented by an improvement of the test method. TASK 2 was not possible to fulfil for the reason of the complex system of the measuring chain and the unknown uncertainties in this system, for which the 18
  • 19. improvements have been elaborated. The effects of these improvements need to be further investigated in connection with further additional tests. Although this was not within the scope of this round robin test, one of these additional tests could be carried out to define the frequency range of the measurement equipment more detailed. However further investigation will remain necessary. TASK 3 could be fulfilled as far as at this stage possible, using the findings of this round robin test for the revision of standard EN 1177:…as proposed in par. 4.2.2 of this report. The proposed revision is attached as Annex 3. Anyway this project was an important approach for clarification and improvements of the measuring equipment in apparatus for testing impact attenuating surfaces, to reach the task for more reliable test reports and increase the safety of the playground user. The supervisor thanks ANEC for supporting this project. TÜV AUSTRIA Vienna, 30 March 2007 Dipl.- Ing. Adolf Russold 19
  • 20. 20