SlideShare a Scribd company logo
1 of 116
Download to read offline
A 4 trillion cubic meter slice through ~ 2 billion years of strata!!


           Erosion is a natural process !
Natural erosion rates
 (m/m.y. = meters per million years)


                              http://bulletin.geoscienceworld.org/cgi/reprint/119/1-2/140
Cropland erosion rates
                   = 0.6 mm/y
Natural vs. accelerated erosion globally


                Natural Erosion


                Accelerated Erosion

          acclerated erosion = accelerated
                by human activities
Impact of climate on natural erosion rates


      Brady and Weil (2002)
Variation in natural erosion rates
Intense thunderstorms
provide the desert areas
of the Southwestern US
    with most of their
     meager annual
      precipitation.
What do you think this arroyo
looks like during a thunderstorm?
Fortunately most of land
 surface not covered by
vegetation is covered by
    desert pavement
Fortunately most of land
   surface not covered by
  vegetation is covered by
or cryptobiotic crusts
      desert pavement
What created this?
Understanding water erosion processes

                                             300 – 900 PSI

                        20- 40 feet / s


       1) Detachment


                           2) Transport
                                          3) Deposition


Brady and Weil (2002)
Detachment   Transport   Deposition
Manobolo River


Detachment estimates >> river sediment loads


                Why ??
              Most sediment is
          deposited within the same
                 landscape
Deposition zone


        Elevated SOM and
          nutrient levels
Sheet erosion


Brady and Weil (2002)
Rill erosion


            Rills result from concentrated flow and can
                be filled by normal tillage operations


Brady and Weil (2002)
We had better do
something before this
 rill turns into a gully.
Gully erosion
                    Dad !!!
                I think the rill
                  has turned
                 into a gully!
From : Steve Groff sgroff@hughes.net
Sent : Thursday, June 29, 2006 5:49 AM

Hi Joel,

We ended up with 14.8" of rain over a 4 day period. These pictures
show how my neighbor’s plowed fields look. The ditch was up to
4' 4" deep and averaged about 3' deep in a 400' section- that is not
a typo! The staked tomato picture is on my side of the property
line looking from that ditch-100 feet away. I did have a little bit of
erosion but could find nothing over 1" deep…

Steve
Fresh Market Tomatoes planted no-till into cover crops on Steve Groff’s farm
Neighbor’s conventional-till corn field ~100’ away
When a stream is straightened or widened,
             streambank erosion increases. Accelerated
             streambank erosion occurs until the stream
               reestablishes a stable size and pattern.


Streambank
  erosion


                   When land use changes occur in a
                 watershed, such as clearing of land for
                   agriculture or development, runoff
               increases. With this increase in runoff the
             stream channel will adjust to accommodate
              the additional flow, increasing streambank
                                 erosion.
Shoreline erosion


           As a boater, you can reduce
  shoreline erosion by reducing the speed and
 resulting wake from your boat, especially when
         the water level is above normal.
             Hydrologists estimate a wake 10” high
          is five times as destructive to the shoreline
         as a 5” wake and a wake that is 25” high has
             a destructive potential that is 30 times
                     greater than a 5” wake.
Engineering properties of soil

                                 Liquid limit


                                                             Brady and Weil, 2002
               low    Moisture content          high

When moistened to its liquid limit, a soil starts to flow.
La Conchita
  landslide
On January 14th 2005,
250,000 cubic yards of
soil flowed into the La
Conchita neighborhood
destroying 13 houses
and severely damaging
23 others.
Slump
Creep
Major causes of accelerated
     erosion in Illinois

  Arrival of tractors and the
       moldboard plow

   Arrival of soybean as a
  major crop replacing oats

  Construction and Mining


   Highest rates
It looks like we have made
lots of progress… but how
much confidence should we
      have in these #s??
―It is questionable
 whether there has
 ever been another
  perceived public
problem for which so
much time, effort and
money were spent in
    light of so little
scientific evidence.‖
History of the Universal Soil Loss Equation (USLE)

During the 1940s and 50s, soil scientists in the Corn Belt region began to
develop quantitative methods of predicting soil loss. It was recognized that
a soil loss equation would be a valuable tool for farm planning. In 1946, a
group of erosion specialists held a workshop in Ohio to reappraise the
factors previously used to predict erosion (slope and management) and
added a rainfall intensity factor. The National Runoff and Soil Loss Data
Center was established at Purdue University in 1954 to locate, assemble,
and consolidate data from soil erosion studies throughout the United
States.

Pioneering the use of computers to analyze more than 11,000 plot-years of
basic runoff and soil loss data from studies at 47 locations in 24 states,
Walter Wischmeier (director of the NRSLDC) and collaborators developed
the Universal Soil Loss Equation (USLE) in the late 1950s. By the 1970s,
the USLE (first introduced in 1958) was widely used for conservation
planning worldwide.


Lots of good science went into developing the USLE
History of the Universal Soil Loss Equation (USLE)

During the 1940s and 50s, soil scientists in the Corn Belt region began to
develop quantitative methods of predicting soil loss. It was recognized that
a soil loss equation would be a valuable tool for farm planning. In 1946, a

A = R * K * LS * C * P
group of erosion specialists held a workshop in Ohio to reappraise the
factors previously used to predict erosion (slope and management) and
added a rainfall intensity factor. The National Runoff and Soil Loss Data
                                   Rainfall erosivity factor


                                                               Soil erodibility factor


                                                                                         Topgraphy factor


                                                                                                            Cover factor


                                                                                                                           Erosion control practices factor
 Predicted soil loss (tons/acre)


Center was established at Purdue University in 1954 to locate, assemble,
and consolidate data from soil erosion studies throughout the United
States.

Pioneering the use of computers to analyze more than 11,000 plot-years of
basic runoff and soil loss data from studies at 47 locations in 24 states,
Walter Wischmeier (director of the NRSLDC) and collaborators developed
the Universal Soil Loss Equation (USLE) in the late 1950s. By the 1970s,
the USLE (first introduced in 1958) was widely used for conservation
planning worldwide.
Newer versions of the USLE, (RUSLE (Revised Universal Soil Loss Equation)
  and RUSLE 2) have been developed and are now in use by the National
    Resources Conservation Service (NRCS) for program planning and
                             implementation.

    Major changes to the USLE incorporated into RUSLE(2) include:

 new and improved isoerodent maps and erodibility index (EI) distributions
for some areas
 new soil erodibility factors which reflect freeze-thaw in some geographic
areas
 new equations to account for slope length and steepness
 additional sub-factors for evaluating the cover and management factor for
cropland and rangeland
 includes new conservation practice values for cropland and rangeland.

A new Agriculture Handbook (No. 703) which describes RUSLE in great detail
           was published in 1997 and is now accessible on-line.


       http://www.ott.wrcc.osmre.gov/library/hbmanual/rusle703.htm
R values in IL


Isoerodent
   lines
K values vary with texture and OM
LS factors
Impact of management (C and P factors)
The main reason why RUSLE #s do not
match up very well with real measurements
 is because most erosion occurs during
  extreme weather events (that are not
     included in the RUSLE model).
Extreme soil erosion occurred in IA during the first 2 weeks of June 2008
Direct measurements of erosion are the most accurate method
 of quantifying soil erosion, but are also the most laborious, time
  consuming, and expensive. They involve collecting deposited
   materials and taking volumetric and weight measurements.
Indirect measurements of erosion use natural benchmarks
 and established benchmarks to evaluate long term changes in
                     soil depth/elevation.
 1) A-horizon reconstruction is the comparison of A-horizon thicknesses between
lands suspected of being eroded and surrounding tracks of otherwise similar soil but
that are known not to have been affected by human action.

 2) Natural benchmarks such as trees or boulders might have soil marks, not unlike
the high water marks on buildings in recently flooded areas. Volumetic
remeasurements can be estimated on the basis of the distance between the surface
and the mark.

3) Erosion pins are metal rods set into the ground, typically with a portion sticking up
above the surface some known and recorded amount (10 cm). Flagging is tied to the
stake to warn possible disturbers. The distance between the top of the pin and the
surface are recorded over time. A variation on this theme is to use a very long spike
driven through a washer to ground level. Over time, the distance the washer drops
from the top of the spike to the eroded ground surface can be recorded.

4) Erosion pipes are similar to pins except that soil remains undisturbed within the
pipe while it erodes away on the outside. Differences between soil height inside and
outside of the pipe can be compared over time.
The economics of off-site erosion
    Karl L. Guntermann, Ming T. Lee and Earl R. Swanson - 1976


 Erosion and sedimentation in agriculture has traditionally
       been thought to result in substantial costs to the
      producer implying that voluntary measures at soil
   conservation would be in the individual's and society's
interest. The research reported here indicates that off-
   site sediment damages are far greater than the on-
  site productivity effects of erosion and that there is
considerable justification for stronger public policies
 in this area. The development of the efficient production
  frontier reveals that conventional production techniques
   are quite inefficient compared to procedures that could
                          be adopted.
(Pimental et al., 1995)
The U. S. Army Corps of Engineers spends ~ $ 100 million a year
          dredging the main channel of the Mississippi.
The U. S. Army Corps of Engineers spends ~ $ 100 million a year
          dredging the main channel of the Mississippi.


                                       Dustpan
                                        dredge


       Cutterhead
         dredge
On-site effects of erosion
  The main on-site impacts of accelerated erosion are
      loss of soil fertility and water-holding capacity.
 Eroded sediment normally contains elevated levels of
 nutrients and SOM relative to the soil left behind. Also,
 because the finest constituents of sediment tend to be
transported furthest, eroded soils become preferentially
   depleted of their finer constituents over time; which
   often reduces their water-holding capacity. In other
   words, ―Erosion removes the cream of the soil‖.

In affluent areas of the world, accelerated erosion’s on-
 site effects can often be mitigated by increased use of
fertilizer and irrigation; however this is not an option for
              much of the earth’s population.
What are the on-site costs of this erosion?
Hill-top erosion on Midwest farms


http://outdoors.webshots.com/photo/1236540189056376852HRFRXH
Tillage erosion
Tillage erosion has only recently been recognized as a form of soil erosion.
Studies across North America and Europe have concluded that tillage
erosion is the primary cause of the severe soil loss and crop yield loss
observed on hilltops.

Tillage erosion is the progressive downslope movement of soil by tillage
causing soil loss on hilltops (knolls) and soil accumulation at the base of
slopes (depressions). Large, aggressive tillage implements, operated at
excessive depths and speeds are more erosive, with more passes resulting
in more erosion. Landscapes that are very topographically complex (with
many short, steep, diverging slopes) are more susceptible to tillage erosion.
Visual evidence of tillage erosion includes loss of topsoil and
 exposure of subsoil at the summit of ridges and knolls; and
undercutting of field boundaries, such as fence lines, on the
       downslope side and burial on the upslope side.


     The soil loss on hilltops resulting from tillage erosion
    reduces crop productivity and increases field variability.


   Rates of soil loss on hilltops are often more than 10 times
       what is considered to be tolerable for sustainable
    production. Consequently, yield losses associated with
          these areas are often as high as 30 to 50%.
http://assets.knowledge.allianz.com/img/soil_conservation_q1_14282.jpg
Moving topsoil from
                                 deposition areas to
                                  degraded areas on
                                 the Mitchell Farm in
                                     Waterloo, IA


   Light green zones have
excess topsoil. Darker green
zones have successively less
 topsoil and red zones have
   the smallest amount of
topsoil. Black lines represent
 optimal routes for a tractor
to follow when redistributing
  top soil. The map on the
     right is the expected
            outcome.
Hugh Hammond Bennett


                                  From “Soil Erosion:
                                A National Menace (1928)

                             “What would be the feeling of this
                               Nation should a foreign nation
                              suddenly enter the United States
                             and destroy 90,000 acres of land,
                               as erosion has been allowed to
                                   do in a single county?”

                              “To visualize the full enormity of
                              land impairment and devastation
                                brought about by this ruthless
                              agent is beyond the possibility of
                             the mind. An era of land wreckage
                               destined to weigh heavily upon
                             the welfare of the next generation
                                         is at hand.”

Soil scientist and showman
Dust from the High Plains
  blotted out the sun in
Washington DC and helped
  HH Bennett convince
Congress to fund the SCS.


                    http://www.nrcs.usda.gov/Internet/FSE_MEDIA/nrcs143_020944.jpg
On September 13, 1933, the Soil Erosion Service was
formed in the Department of the Interior, with Bennett as
 chief. The service was transferred to the Department of
     Agriculture on March 23, 1935, and was shortly
 thereafter combined with other USDA units to form the
      Soil Conservation Service (SCS) by the Soil
   Conservation and Domestic Allotment Act of 1935.

  Hugh Bennett continued as chief, a position he held
            until his retirement in 1951.

 On October 20, 1994, the agency was renamed the
Natural Resources Conservation Service (NRCS) to
            reflect its broader mission.
Hugh Hammond Bennett inspecting strip cropping
 in the Coon Creek Watershed – the nation’s first
         watershed demonstration project
The ~ 500 Coon Creek farmers who signed five-year contracts
received $0.50/acre payments, foreshadowing future financial
assistance programs designed to promote wise stewardship of
                     natural resources.

 The Soil Conservation Service supplied Coon Creek farmers
with seed, fertilizer and fencing, and the Civilian Conservation
 Corps (known as the ―CCC Boys) provided a huge amount of
labor. They quarried and crushed millions of tons of limestone,
   installed nearly 29,000 miles of terracing, cultivated and
   planted many millions of trees and cleared channels and
  reservoirs of nearly 400,000 square yards of sediment and
        debris, in addition to other back-breaking tasks.
Coon Creek Watershed today


More than 95% of the 92,000-acre watershed is currently covered by a
conservation plan. Some current landowners still adhere to agreements
 their parents worked out with Bennett’s team more than 70 years ago.
So what has been the long term impact of the Coon Creek
project that Aldo Leopold once called an ―adventure in
cooperative conservation?‖

Going by the numbers, a satisfying portrait emerges:

•Erosion within the watershed has decreased 75%

•Sediment leaving the watershed has decreased 94%

•Gullies—some described as ―big enough to hold a house‖—
were reduced by 77% by the late 1970s.

•Flooding, once common on area farms, has been minimized.

•The watershed is now 44% forested
Since 1936,
~ $300 billion has
  been spent on
   conservation
    programs !
In the 1985 Farm Bill, Congress decided that as a quid pro
quo for federal farm assistance, farmers receiving taxpayer
support should control soil erosion on highly erodible lands
 (HEL) used to grow subsidized crops. The policy principle
 was straightforward and widely embraced in conservation
      and agriculture policy circles: taxpayer support for
 agriculture should not inadvertently subsidize degradation
  of natural resources or the environment. Parallel policies
 were authorized in the 1985 law to prevent subsidies from
  encouraging conversion of fragile lands and wetlands to
                       crop production.
WHAT IS HEL LAND?
According to the USDA, a field is designated
      as highly erodible land (HEL) if:

a) RKLS/T for the soil mapping units equals
                 or exceeds 8.
 b) the highly erodible soil mapping units in
the field make up 33 percent or more of the
                field’s acreage or
  c) the highly erodible soil mapping units in
       the field equal 50 or more acres.
http://www.ewg.org/book/export/html/22513
In order to maintain their eligibility for federal farm benefits
such as commodity crop subsidies and disaster payments,
 farmers with subsidized crops on HEL land were required
   to develop and implement a government-approved soil
  conservation plan specifying soil conservation practices.

   Common erosion reduction practices include: rotating
  crops, minimizing tillage, leaving soil covered with crop
 residue after harvest, and installing grassed buffers, etc.
     This program was called the Highly Erodible Land
      Conservation (HELC) Compliance provision or
               ―conservation compliance‖.
Corn production on land classified as HEL by NRCS


Acres per county
   200 - 12,000
   12,000 – 37,000
   37,000 - 62,000
   > 62,000
                              https://www.agronomy.org/publications/aj/articles/96/1/1
Farmers were given 10 years (until 1995) to fully implement
    the soil conservation plans. The U.S. Department of
   Agriculture (USDA) attributes the HELC planning and
      compliance process with widespread adoption of
conservation systems, which made unprecedented progress
          in reducing erosion over these 10 years.

 HELC compliance, coupled with the Conservation Reserve
 Program (CRP), reduced erosion by about 40 percent (1.2
 billion tons) from 3.07 billion tons in 1982 to 1.9 billion tons
   in 1997 (national soil survey years which encompass the
      1985 to 1995 time period). USDA attributes about 25
percent of that reduction to HELC compliance requirements.
     HELC compliance is also credited with a ―technology-
  forcing‖ effect that helped reduce erosion on cropland not
                     subject to HELC plans.
Since full implementation of HELC
  compliance plans in 1995, there has been
little additional progress in reducing erosion.
      According to the National Resources
  Inventory (NRI) survey, approximately 100
million acres of cropland in the U.S.—nearly
one-third of the 368 million acres of cropland
    nationwide —continue to erode at rates
            deemed ―unsustainable.‖
Each red dot = 100,000 tons of wind erosion, total = 765 million tons
Each blue dot = 100,000 tons of water erosion, total = 960 million tons
HEL Compliance

Is conservation system application required on HEL ground?
Yes, if the land is used to produce agricultural commodity crops.
Responsibility rests with both landowners and operators to implement an
appropriate conservation system or forfeit USDA program benefits.
Conservation systems are specific to each HEL tract on a farm.

What is the most common mistake made by operators out of
compliance?
Working soybean ground is the most common mistake that results in
noncompliance. Working soybean ground even lightly can cause your
operation to be out of compliance, as many conservation systems require
no-till or strip-till on soybean stubble.

Keep a few things in mind about tillage. Using aerators or rotary
harrows on fields scheduled for no-till may result in noncompliance. Strip
tillage with less than 25% row disturbance is equivalent to no-till. In a no-till
system, if ruts occur due to wet conditions at harvest, light tillage to level
the site is acceptable, but only on the affected area. Producers should
contact their NRCS office before performing tillage.
Additional Practices

  Depending on your land, additional practices may be
required, such as gully and/or concentrated flow erosion
  control through structural practices. This may include
 establishment and maintenance of practices, such as:

               Grassed waterways
         Water & sediment control basins
                    Terraces
            Grade control structures
                   Diversions
   Other NRCS approved conservation practices
Is your farming system in compliance?

 Conservation cropping systems for HEL
None of the 10 Mississippi River border states reviewed sufficient numbers
    of tracts to achieve the one percent NRCS goal from 2000 to 2006
                                              Number of tracts reviewed
                      # to
                    review
                     each
                    year to                                                              2000 to
        State                 2000    2001    2002    2003    2004     2005     2006
                    achieve                                                               2006
                      1%
                    review
                     goal
      Arkansas        815      322     266     273     545     338      430      367     2,541
       Illinois      2,883    1,184   1,162   1,030   1,061   1,803    2,257    1,977    10,474
        Iowa         2,535    1,512   1,430   1,542   1,516   2,387    2,205    1,707    12,299
      Kentucky       2,367     762     938     823    1,017   1,248    1,934    1,612    8,334
      Louisiana      606      242     244     242     247      423      349      285     2,032

      Minnesota      1,912    572     505     514     506     1,382    1,049     960     5,488

      Mississippi    853      426     423     421     465      482      356      297     2,870
       Missouri      1,723    838     881     1,069   922     1,283    1,103    1,185    7,281
      Tennessee      1,775    361     440     440     435      584     1,059     861     4,180

      Wisconsin      1,620    625     835     827     791     1,430    1,428    1,239    7,175
       TOTAL        17,089    6,844   7,124   7,181   7,505   11,360   12,170   10,490   62,674
Erosion continues to be a serious
    issue in Western Illinois
                    (#s = % of sample points)

     County            < 1 *T          1-2*T           > 2*T
      Adams             85              12               3
      Brown             75              17               8
     Hancock            91               6               3
    Henderson           91               7               2
   McDonough            85              12               3
       Pike             70              18              11
     Schuyler           83              13               4

 http://www.agr.state.il.us/darts/References/transect/transect06.pdf

   T = tolerable level of erosion according to NRCS
~ 50% of the crop acres eroding at rates > T
in the 10 Mississippi River border states are
   not subject to conservation compliance


           http://www.ewg.org/book/export/html/22513
Crop residue is not trash – its cover for the soil !!
This is soil pornography !
Photo comparison method of estimating residue cover
   25%           50%         75%           90%
One pass with a disk
~60 % residue cover
Two passes with a disk
might still be considered
  conservation tillage
A single disking of less
 abundant and more fragile
soybean residues is likely to
leave less than 20% residue
  cover and not qualify as
    conservation tillage.
Impact of field
  operations on
residue cover can
also be estimated
using tables such
 as the one to the
       right
Relationship between yield and residue cover
Line transect method of estimating residue cover

The line-transect method is an easy, reliable way to determine residue cover.
It involves stretching a 50-foot measuring tape, line or rope (knotted, beaded
or otherwise marked at six inch intervals) diagonally across crop rows.
Percent cover is determined by counting the number of marks that intersect
or lie directly over a piece of residue.

The key to accuracy with this method is avoiding over- or underestimation.
Look straight down on each mark and take all readings on the same side of
the tape or rope, asking yourself, ―If a raindrop falls at this point, would it hit
residue or bare soil?‖ In general, residue should be 3/32 inch (roughly the
size of a healthy wheat straw) in diameter or larger. If there is any doubt at
all, do not count it.

At least five measurements should be taken and averaged at each site !
In 2006, no-till rose to
33.2% of Illinois cropland,
while conventional tillage
dropped to 31.2% !
In 2006, for the first
time, more than half
  of the soybeans
  grown in IL were
   planted no-till !
WET SPRINGS CAUSING ILLINOIS PRODUCERS TO
            INCREASE FALL TILLAGE
Wet springs the past two years have caused an increase in crop tillage,
according to a new study from the Illinois Department of Agriculture.

The 2011 Illinois Soil Conservation Transect Survey revealed that no-till crop
production has fallen five percentage points since 2009.

The farmers who switched production systems have not abandoned soil
conservation practices entirely, however. While the use of conventional tillage
increased during this period, so did the use of mulch-till, a practice that
leaves at least 30 percent of the residue from the previous crop on the
ground and, much like no-till, protects soil from erosion.

No-till farming still is the conservation practice of choice among Illinois
farmers. However, the gap between it and mulch-till has narrowed
considerably. The survey shows 21.4 percent of fields now are planted using
mulch-till, up from 20.7 percent in 2009 and 16.4 percent in 2006. No-till
usage has declined during the same span from a record-high of 33.2 percent
in 2006 to the current 24.2 percent.       http://www.agrimarketing.com/ss.php?id=71271
Criteria used to rate soil suitability for no-till in PA

Factors                 More suitable                   Less suitable

Temperature regime      Warmer: > 2800 GDD              Cooler: < 2800 GDD

Soil drainage           Good: Most soils are well or   Poor: Most soils are
                        moderately well drained        very poorly, poorly or
                                                       somewhat poorly drained

Water holding           Low: < 6‖                      High: > 6 ―
capacity of root zone

Slope                   High: > 8 % slope              Low: < 8% slope

Rock fragment           High: Most soils are loamy     Low: Most soils are not
content                 and sandy skeletal             skeletal


                                                                  Duiker et al., 2001
No-till is much more challenging on some soils but
innovative farmers are making no-till work on most soils
Conservation tillage is just one piece of a
comprehensive approach to soil and water
              conservation
Contour strip
   cropping


http://allamakeeswcd.org/wp-content/uploads/2010/04/contour-farming.jpg
Contour terraces capture sediment and transform
  long slopes into a series of shorter slopes.


http://www.ia.nrcs.usda.gov/news/brochures/terraces.html
Grassed waterways
Steve
Nebel


        Cover crops
Grassed filterstrip
Grade stabilization structure
Tile Drainage - it is well established through both
scientific investigation and farmer observations that
   improved drainage reduces surface runoff and
                transport of sediment.
Impact of the 2008 floods on IA soils
  20 tons per acre average soil loss across
                2,284,000 ac!

   Conservation structures needing repair
          12,157 Grassed Waterways
                8,137 Terraces
   3,375 Water and Sediment Control Basins
       800 Grade Stabilization Structures
   Fields with combinations of two or more
  conservation practices (e.g., no-till + cover
crops) performed much better than fields with a
                single practice
Erosion
  is more
  than an
agricultural
   issue
Major efforts
            are being
             made to
             control
             erosion


in urban
  areas
Silt fences are
                           intended to trap
                            sediment while
                            allowing water
                             to slowly flow
                                through.


The bottom of the fabric
   should be buried at
 least six inches under
    the soil to prevent
sediment from escaping
     under the fence
Sediment retention pond
Diversion of water from trails prevents washouts
Waterway stabilized with rock and geotextile
Wind erosion is a serious problem
        in the Western US
Wind Erosion Equation (WEQ)
                           E=f(IKCLV)
E is the estimation of average annual soil loss in tons per acre

f indicates the equation includes complex relationships rather than
just multiplication as in the USLE/RUSLE.

I is the soil erodibility index.

K is the ridge roughness factor.

C is the climatic factor. All climatic factor values are expressed as a
percentage of the value established at Garden City, Kansas.

L is the unsheltered distance across an erodible field, measured
along the prevailing wind erosion direction.

V is the vegetative cover factor.
http://www.weru.ksu.edu/weps/wepshome.html
Lots of discussion about dust
storms on Ag Talk recently:
―I want to say it doesn't look that
bad, but I know every pic I've
taken "doesn't look that bad."
This is definitely the worst I've
ever seen. Even no-tilled ground
is blowing on top of the hills.‖

More Related Content

What's hot

Watershed management
Watershed  managementWatershed  management
Watershed managementGhassan Hadi
 
R 12013(ssc-411)-soil moisture constants,soil-water movement &amp; infiltration
R 12013(ssc-411)-soil moisture constants,soil-water movement &amp; infiltrationR 12013(ssc-411)-soil moisture constants,soil-water movement &amp; infiltration
R 12013(ssc-411)-soil moisture constants,soil-water movement &amp; infiltrationKritika Somya
 
Soil salinity P K MANI
Soil salinity  P K MANISoil salinity  P K MANI
Soil salinity P K MANIP.K. Mani
 
Evapotranspiration ppt
Evapotranspiration pptEvapotranspiration ppt
Evapotranspiration pptSidra Shahid
 
Soil erosion by water- factors and mechanism.pptx
Soil erosion by water- factors and mechanism.pptxSoil erosion by water- factors and mechanism.pptx
Soil erosion by water- factors and mechanism.pptxanju bala
 
COMPARISON OF DIFFERENT METHODS OF ESTIMATING POTENTIAL EVAPOTRANSPIRATION
COMPARISON OF DIFFERENT METHODS OF ESTIMATING POTENTIAL EVAPOTRANSPIRATIONCOMPARISON OF DIFFERENT METHODS OF ESTIMATING POTENTIAL EVAPOTRANSPIRATION
COMPARISON OF DIFFERENT METHODS OF ESTIMATING POTENTIAL EVAPOTRANSPIRATIONAnurag Satpathi
 
Irrigation scheduling
Irrigation schedulingIrrigation scheduling
Irrigation schedulingbabu kakumanu
 
Soil conservation problems and their management
Soil conservation problems and their managementSoil conservation problems and their management
Soil conservation problems and their managementChiter Mani
 
Soil erosion assessment using RUSLE and Projection Augmented Landscape Model ...
Soil erosion assessment using RUSLE and Projection Augmented Landscape Model ...Soil erosion assessment using RUSLE and Projection Augmented Landscape Model ...
Soil erosion assessment using RUSLE and Projection Augmented Landscape Model ...ExternalEvents
 
Ground water recharge Methods
Ground water recharge MethodsGround water recharge Methods
Ground water recharge MethodsPrabhat Mishra
 

What's hot (20)

Watershed management
Watershed  managementWatershed  management
Watershed management
 
R 12013(ssc-411)-soil moisture constants,soil-water movement &amp; infiltration
R 12013(ssc-411)-soil moisture constants,soil-water movement &amp; infiltrationR 12013(ssc-411)-soil moisture constants,soil-water movement &amp; infiltration
R 12013(ssc-411)-soil moisture constants,soil-water movement &amp; infiltration
 
Control of soil erosion
Control of soil erosionControl of soil erosion
Control of soil erosion
 
Soil salinity P K MANI
Soil salinity  P K MANISoil salinity  P K MANI
Soil salinity P K MANI
 
Evapotranspiration ppt
Evapotranspiration pptEvapotranspiration ppt
Evapotranspiration ppt
 
Watershed management
Watershed managementWatershed management
Watershed management
 
Offsite and onsite
Offsite and onsiteOffsite and onsite
Offsite and onsite
 
Soil erosion by water- factors and mechanism.pptx
Soil erosion by water- factors and mechanism.pptxSoil erosion by water- factors and mechanism.pptx
Soil erosion by water- factors and mechanism.pptx
 
COMPARISON OF DIFFERENT METHODS OF ESTIMATING POTENTIAL EVAPOTRANSPIRATION
COMPARISON OF DIFFERENT METHODS OF ESTIMATING POTENTIAL EVAPOTRANSPIRATIONCOMPARISON OF DIFFERENT METHODS OF ESTIMATING POTENTIAL EVAPOTRANSPIRATION
COMPARISON OF DIFFERENT METHODS OF ESTIMATING POTENTIAL EVAPOTRANSPIRATION
 
Irrigation scheduling
Irrigation schedulingIrrigation scheduling
Irrigation scheduling
 
Soil conservation problems and their management
Soil conservation problems and their managementSoil conservation problems and their management
Soil conservation problems and their management
 
Soil erosion causes and effects
Soil erosion causes and effectsSoil erosion causes and effects
Soil erosion causes and effects
 
Soil conservation techniques
Soil conservation techniquesSoil conservation techniques
Soil conservation techniques
 
SOIL SCIENCE PDF PPT
SOIL SCIENCE PDF PPTSOIL SCIENCE PDF PPT
SOIL SCIENCE PDF PPT
 
Soil water
Soil waterSoil water
Soil water
 
Soil Water Plant Relationships
Soil Water Plant RelationshipsSoil Water Plant Relationships
Soil Water Plant Relationships
 
Soil erosion assessment using RUSLE and Projection Augmented Landscape Model ...
Soil erosion assessment using RUSLE and Projection Augmented Landscape Model ...Soil erosion assessment using RUSLE and Projection Augmented Landscape Model ...
Soil erosion assessment using RUSLE and Projection Augmented Landscape Model ...
 
Ground water recharge Methods
Ground water recharge MethodsGround water recharge Methods
Ground water recharge Methods
 
WATERSHED MANAGEMENT
WATERSHED MANAGEMENTWATERSHED MANAGEMENT
WATERSHED MANAGEMENT
 
What is watershed
What is watershedWhat is watershed
What is watershed
 

Viewers also liked

soil erosion and conservation
soil erosion and conservationsoil erosion and conservation
soil erosion and conservationvinand
 
Engineering methods to control soil erosion
Engineering methods to control soil erosionEngineering methods to control soil erosion
Engineering methods to control soil erosionSantosh pathak
 
Bio engineering methods and their control for soil erosion
Bio engineering methods and their control for soil erosionBio engineering methods and their control for soil erosion
Bio engineering methods and their control for soil erosionSantosh pathak
 
SOIL CONSERVATION
SOIL CONSERVATIONSOIL CONSERVATION
SOIL CONSERVATIONSamyak Jain
 
Soil conservation ppt
Soil conservation pptSoil conservation ppt
Soil conservation pptrithikkapoor7
 
Sec 3 Coastal Management
Sec 3 Coastal ManagementSec 3 Coastal Management
Sec 3 Coastal Managementchua.geog
 
Application of Basic Remote Sensing in Geology
Application of Basic Remote Sensing in GeologyApplication of Basic Remote Sensing in Geology
Application of Basic Remote Sensing in GeologyUzair Khan
 
Flood management Ppt
Flood management PptFlood management Ppt
Flood management PptPamGoward
 
Weathering, Erosion and Soil
Weathering, Erosion and SoilWeathering, Erosion and Soil
Weathering, Erosion and Soiltcooper66
 
Engineering Geology (Civil Engineering Applications)
Engineering Geology (Civil Engineering Applications)Engineering Geology (Civil Engineering Applications)
Engineering Geology (Civil Engineering Applications)GAURAV. H .TANDON
 
Coastal Management
Coastal ManagementCoastal Management
Coastal ManagementMrs Coles
 

Viewers also liked (19)

soil erosion and conservation
soil erosion and conservationsoil erosion and conservation
soil erosion and conservation
 
Soil erosion2
Soil erosion2Soil erosion2
Soil erosion2
 
Engineering methods to control soil erosion
Engineering methods to control soil erosionEngineering methods to control soil erosion
Engineering methods to control soil erosion
 
Bio engineering methods and their control for soil erosion
Bio engineering methods and their control for soil erosionBio engineering methods and their control for soil erosion
Bio engineering methods and their control for soil erosion
 
SOIL CONSERVATION
SOIL CONSERVATIONSOIL CONSERVATION
SOIL CONSERVATION
 
Soil conservation ppt
Soil conservation pptSoil conservation ppt
Soil conservation ppt
 
Coastal Management 4
Coastal Management 4Coastal Management 4
Coastal Management 4
 
Sec 3 Coastal Management
Sec 3 Coastal ManagementSec 3 Coastal Management
Sec 3 Coastal Management
 
Flood Management
Flood ManagementFlood Management
Flood Management
 
Application of Basic Remote Sensing in Geology
Application of Basic Remote Sensing in GeologyApplication of Basic Remote Sensing in Geology
Application of Basic Remote Sensing in Geology
 
Flood management Ppt
Flood management PptFlood management Ppt
Flood management Ppt
 
Weathering, Erosion and Soil
Weathering, Erosion and SoilWeathering, Erosion and Soil
Weathering, Erosion and Soil
 
Engineering Geology
Engineering Geology Engineering Geology
Engineering Geology
 
soil erosion
soil erosionsoil erosion
soil erosion
 
Soil erosion
Soil erosionSoil erosion
Soil erosion
 
Engineering Geology (Civil Engineering Applications)
Engineering Geology (Civil Engineering Applications)Engineering Geology (Civil Engineering Applications)
Engineering Geology (Civil Engineering Applications)
 
Coastal Management
Coastal ManagementCoastal Management
Coastal Management
 
Excavations ppt
Excavations pptExcavations ppt
Excavations ppt
 
Flood management m4
Flood management m4Flood management m4
Flood management m4
 

Similar to A 4 trillion cubic meter slice through ~2 billion years of natural erosion rates

Principles of Soil Erosion.pptx
Principles of Soil Erosion.pptxPrinciples of Soil Erosion.pptx
Principles of Soil Erosion.pptxAjay Singh Lodhi
 
Hao 2011 STR Personal copy
Hao 2011 STR Personal copyHao 2011 STR Personal copy
Hao 2011 STR Personal copyHongtao HAO
 
Soil degradation and desertification Ashish(2011A22BIV)
 Soil degradation and desertification Ashish(2011A22BIV) Soil degradation and desertification Ashish(2011A22BIV)
Soil degradation and desertification Ashish(2011A22BIV)AshishNain
 
Bashir M54 course work 2
Bashir M54 course work 2Bashir M54 course work 2
Bashir M54 course work 2Abubakar Bashir
 
Identification Of Soil Erosion Prone Zones Using Geomatics Technology In Part...
Identification Of Soil Erosion Prone Zones Using Geomatics Technology In Part...Identification Of Soil Erosion Prone Zones Using Geomatics Technology In Part...
Identification Of Soil Erosion Prone Zones Using Geomatics Technology In Part...IJERA Editor
 
Extent of gully erosion and farmer’s perception of soil erosion in alalicha w...
Extent of gully erosion and farmer’s perception of soil erosion in alalicha w...Extent of gully erosion and farmer’s perception of soil erosion in alalicha w...
Extent of gully erosion and farmer’s perception of soil erosion in alalicha w...Alexander Decker
 
Farms, Floods And Fluvial Geomorphology: Making The Most of Our Natural Resou...
Farms, Floods And Fluvial Geomorphology: Making The Most of Our Natural Resou...Farms, Floods And Fluvial Geomorphology: Making The Most of Our Natural Resou...
Farms, Floods And Fluvial Geomorphology: Making The Most of Our Natural Resou...National Institute of Food and Agriculture
 
B.sc. agri i foswce unit 3 soil erosion
B.sc. agri i foswce unit 3 soil erosionB.sc. agri i foswce unit 3 soil erosion
B.sc. agri i foswce unit 3 soil erosionRai University
 
Methods to control soil erosion and water run off
Methods to control soil erosion and water run offMethods to control soil erosion and water run off
Methods to control soil erosion and water run offRajat Sharma
 
Peatland management impacts on flood regulation
Peatland management impacts on flood regulationPeatland management impacts on flood regulation
Peatland management impacts on flood regulationAberdeen CES
 
Assesment of the morphometry of gullies in kastina ala, nigeria
Assesment of the morphometry of gullies in kastina ala, nigeriaAssesment of the morphometry of gullies in kastina ala, nigeria
Assesment of the morphometry of gullies in kastina ala, nigeriaAlexander Decker
 
IMPACT OF SILTATION AND RECLAMATION ON AQUATIC HABITAT.pptx
IMPACT OF SILTATION AND RECLAMATION ON AQUATIC HABITAT.pptxIMPACT OF SILTATION AND RECLAMATION ON AQUATIC HABITAT.pptx
IMPACT OF SILTATION AND RECLAMATION ON AQUATIC HABITAT.pptxSakshi Patil
 
Soil quality - does it matter?
Soil quality - does it matter?Soil quality - does it matter?
Soil quality - does it matter?jbgruver
 
National Assessment of Soil Erosion in Canada from 1971 to 2016
National Assessment of Soil Erosion in Canada from 1971 to 2016National Assessment of Soil Erosion in Canada from 1971 to 2016
National Assessment of Soil Erosion in Canada from 1971 to 2016ExternalEvents
 

Similar to A 4 trillion cubic meter slice through ~2 billion years of natural erosion rates (20)

467 age 505 lecture on ppp
467 age 505 lecture on ppp467 age 505 lecture on ppp
467 age 505 lecture on ppp
 
Soil Erosion Essay
Soil Erosion EssaySoil Erosion Essay
Soil Erosion Essay
 
Principles of Soil Erosion.pptx
Principles of Soil Erosion.pptxPrinciples of Soil Erosion.pptx
Principles of Soil Erosion.pptx
 
Hao 2011 STR Personal copy
Hao 2011 STR Personal copyHao 2011 STR Personal copy
Hao 2011 STR Personal copy
 
Soil degradation and desertification Ashish(2011A22BIV)
 Soil degradation and desertification Ashish(2011A22BIV) Soil degradation and desertification Ashish(2011A22BIV)
Soil degradation and desertification Ashish(2011A22BIV)
 
Bashir M54 course work 2
Bashir M54 course work 2Bashir M54 course work 2
Bashir M54 course work 2
 
Identification Of Soil Erosion Prone Zones Using Geomatics Technology In Part...
Identification Of Soil Erosion Prone Zones Using Geomatics Technology In Part...Identification Of Soil Erosion Prone Zones Using Geomatics Technology In Part...
Identification Of Soil Erosion Prone Zones Using Geomatics Technology In Part...
 
Watershed - Principles of Erosion
Watershed - Principles of ErosionWatershed - Principles of Erosion
Watershed - Principles of Erosion
 
Extent of gully erosion and farmer’s perception of soil erosion in alalicha w...
Extent of gully erosion and farmer’s perception of soil erosion in alalicha w...Extent of gully erosion and farmer’s perception of soil erosion in alalicha w...
Extent of gully erosion and farmer’s perception of soil erosion in alalicha w...
 
Farms, Floods And Fluvial Geomorphology: Making The Most of Our Natural Resou...
Farms, Floods And Fluvial Geomorphology: Making The Most of Our Natural Resou...Farms, Floods And Fluvial Geomorphology: Making The Most of Our Natural Resou...
Farms, Floods And Fluvial Geomorphology: Making The Most of Our Natural Resou...
 
B.sc. agri i foswce unit 3 soil erosion
B.sc. agri i foswce unit 3 soil erosionB.sc. agri i foswce unit 3 soil erosion
B.sc. agri i foswce unit 3 soil erosion
 
16697804.ppt
16697804.ppt16697804.ppt
16697804.ppt
 
Methods to control soil erosion and water run off
Methods to control soil erosion and water run offMethods to control soil erosion and water run off
Methods to control soil erosion and water run off
 
(Soil erosion (dsm 2202) m. a. mahbub
(Soil erosion (dsm 2202) m. a. mahbub(Soil erosion (dsm 2202) m. a. mahbub
(Soil erosion (dsm 2202) m. a. mahbub
 
Peatland management impacts on flood regulation
Peatland management impacts on flood regulationPeatland management impacts on flood regulation
Peatland management impacts on flood regulation
 
Assesment of the morphometry of gullies in kastina ala, nigeria
Assesment of the morphometry of gullies in kastina ala, nigeriaAssesment of the morphometry of gullies in kastina ala, nigeria
Assesment of the morphometry of gullies in kastina ala, nigeria
 
IMPACT OF SILTATION AND RECLAMATION ON AQUATIC HABITAT.pptx
IMPACT OF SILTATION AND RECLAMATION ON AQUATIC HABITAT.pptxIMPACT OF SILTATION AND RECLAMATION ON AQUATIC HABITAT.pptx
IMPACT OF SILTATION AND RECLAMATION ON AQUATIC HABITAT.pptx
 
1 Soil Water Erosion.pptx
1 Soil Water Erosion.pptx1 Soil Water Erosion.pptx
1 Soil Water Erosion.pptx
 
Soil quality - does it matter?
Soil quality - does it matter?Soil quality - does it matter?
Soil quality - does it matter?
 
National Assessment of Soil Erosion in Canada from 1971 to 2016
National Assessment of Soil Erosion in Canada from 1971 to 2016National Assessment of Soil Erosion in Canada from 1971 to 2016
National Assessment of Soil Erosion in Canada from 1971 to 2016
 

More from jbgruver

Urban ecology
Urban ecologyUrban ecology
Urban ecologyjbgruver
 
Managing Cover Crops as a Nutrient Management Tool
Managing Cover Crops as a Nutrient Management ToolManaging Cover Crops as a Nutrient Management Tool
Managing Cover Crops as a Nutrient Management Tooljbgruver
 
10 year retrospective on CCs
10 year retrospective on CCs10 year retrospective on CCs
10 year retrospective on CCsjbgruver
 
Ca mg16slideshare
Ca mg16slideshareCa mg16slideshare
Ca mg16slidesharejbgruver
 
Integrating CC in Strip-Till Systems
Integrating CC in Strip-Till SystemsIntegrating CC in Strip-Till Systems
Integrating CC in Strip-Till Systemsjbgruver
 
Quincy2015pptx
Quincy2015pptxQuincy2015pptx
Quincy2015pptxjbgruver
 
Value of Cover Crops
Value of Cover CropsValue of Cover Crops
Value of Cover Cropsjbgruver
 
Hybrid corn2014new
Hybrid corn2014newHybrid corn2014new
Hybrid corn2014newjbgruver
 
Precision Cover Cropping for Organic Farms
Precision Cover Cropping for Organic FarmsPrecision Cover Cropping for Organic Farms
Precision Cover Cropping for Organic Farmsjbgruver
 
Cover Cropping Practices that Enhance Soil Fertility
Cover Cropping Practices that Enhance Soil FertilityCover Cropping Practices that Enhance Soil Fertility
Cover Cropping Practices that Enhance Soil Fertilityjbgruver
 
Maximizing crop root growth in no-till systems
Maximizing crop root growth in no-till systemsMaximizing crop root growth in no-till systems
Maximizing crop root growth in no-till systemsjbgruver
 
Potassium2013new
Potassium2013newPotassium2013new
Potassium2013newjbgruver
 
Field dayflier2013
Field dayflier2013Field dayflier2013
Field dayflier2013jbgruver
 
Adopting Cover Crop Systems
Adopting Cover Crop SystemsAdopting Cover Crop Systems
Adopting Cover Crop Systemsjbgruver
 
Understanding Soil Organic Matter
Understanding Soil Organic MatterUnderstanding Soil Organic Matter
Understanding Soil Organic Matterjbgruver
 
Understanding the West TX explosion
Understanding the West TX explosionUnderstanding the West TX explosion
Understanding the West TX explosionjbgruver
 
Your soil: crumbly or cloddy?
Your soil: crumbly or cloddy?Your soil: crumbly or cloddy?
Your soil: crumbly or cloddy?jbgruver
 
Community garden presentation
Community garden presentationCommunity garden presentation
Community garden presentationjbgruver
 
Precision Organics
Precision OrganicsPrecision Organics
Precision Organicsjbgruver
 

More from jbgruver (20)

Urban ecology
Urban ecologyUrban ecology
Urban ecology
 
Managing Cover Crops as a Nutrient Management Tool
Managing Cover Crops as a Nutrient Management ToolManaging Cover Crops as a Nutrient Management Tool
Managing Cover Crops as a Nutrient Management Tool
 
10 year retrospective on CCs
10 year retrospective on CCs10 year retrospective on CCs
10 year retrospective on CCs
 
Ca mg16slideshare
Ca mg16slideshareCa mg16slideshare
Ca mg16slideshare
 
Integrating CC in Strip-Till Systems
Integrating CC in Strip-Till SystemsIntegrating CC in Strip-Till Systems
Integrating CC in Strip-Till Systems
 
Som2015
Som2015Som2015
Som2015
 
Quincy2015pptx
Quincy2015pptxQuincy2015pptx
Quincy2015pptx
 
Value of Cover Crops
Value of Cover CropsValue of Cover Crops
Value of Cover Crops
 
Hybrid corn2014new
Hybrid corn2014newHybrid corn2014new
Hybrid corn2014new
 
Precision Cover Cropping for Organic Farms
Precision Cover Cropping for Organic FarmsPrecision Cover Cropping for Organic Farms
Precision Cover Cropping for Organic Farms
 
Cover Cropping Practices that Enhance Soil Fertility
Cover Cropping Practices that Enhance Soil FertilityCover Cropping Practices that Enhance Soil Fertility
Cover Cropping Practices that Enhance Soil Fertility
 
Maximizing crop root growth in no-till systems
Maximizing crop root growth in no-till systemsMaximizing crop root growth in no-till systems
Maximizing crop root growth in no-till systems
 
Potassium2013new
Potassium2013newPotassium2013new
Potassium2013new
 
Field dayflier2013
Field dayflier2013Field dayflier2013
Field dayflier2013
 
Adopting Cover Crop Systems
Adopting Cover Crop SystemsAdopting Cover Crop Systems
Adopting Cover Crop Systems
 
Understanding Soil Organic Matter
Understanding Soil Organic MatterUnderstanding Soil Organic Matter
Understanding Soil Organic Matter
 
Understanding the West TX explosion
Understanding the West TX explosionUnderstanding the West TX explosion
Understanding the West TX explosion
 
Your soil: crumbly or cloddy?
Your soil: crumbly or cloddy?Your soil: crumbly or cloddy?
Your soil: crumbly or cloddy?
 
Community garden presentation
Community garden presentationCommunity garden presentation
Community garden presentation
 
Precision Organics
Precision OrganicsPrecision Organics
Precision Organics
 

Recently uploaded

Q4-PPT-Music9_Lesson-1-Romantic-Opera.pptx
Q4-PPT-Music9_Lesson-1-Romantic-Opera.pptxQ4-PPT-Music9_Lesson-1-Romantic-Opera.pptx
Q4-PPT-Music9_Lesson-1-Romantic-Opera.pptxlancelewisportillo
 
Activity 2-unit 2-update 2024. English translation
Activity 2-unit 2-update 2024. English translationActivity 2-unit 2-update 2024. English translation
Activity 2-unit 2-update 2024. English translationRosabel UA
 
4.16.24 Poverty and Precarity--Desmond.pptx
4.16.24 Poverty and Precarity--Desmond.pptx4.16.24 Poverty and Precarity--Desmond.pptx
4.16.24 Poverty and Precarity--Desmond.pptxmary850239
 
MULTIDISCIPLINRY NATURE OF THE ENVIRONMENTAL STUDIES.pptx
MULTIDISCIPLINRY NATURE OF THE ENVIRONMENTAL STUDIES.pptxMULTIDISCIPLINRY NATURE OF THE ENVIRONMENTAL STUDIES.pptx
MULTIDISCIPLINRY NATURE OF THE ENVIRONMENTAL STUDIES.pptxAnupkumar Sharma
 
Expanded definition: technical and operational
Expanded definition: technical and operationalExpanded definition: technical and operational
Expanded definition: technical and operationalssuser3e220a
 
Active Learning Strategies (in short ALS).pdf
Active Learning Strategies (in short ALS).pdfActive Learning Strategies (in short ALS).pdf
Active Learning Strategies (in short ALS).pdfPatidar M
 
Inclusivity Essentials_ Creating Accessible Websites for Nonprofits .pdf
Inclusivity Essentials_ Creating Accessible Websites for Nonprofits .pdfInclusivity Essentials_ Creating Accessible Websites for Nonprofits .pdf
Inclusivity Essentials_ Creating Accessible Websites for Nonprofits .pdfTechSoup
 
Millenials and Fillennials (Ethical Challenge and Responses).pptx
Millenials and Fillennials (Ethical Challenge and Responses).pptxMillenials and Fillennials (Ethical Challenge and Responses).pptx
Millenials and Fillennials (Ethical Challenge and Responses).pptxJanEmmanBrigoli
 
Dust Of Snow By Robert Frost Class-X English CBSE
Dust Of Snow By Robert Frost Class-X English CBSEDust Of Snow By Robert Frost Class-X English CBSE
Dust Of Snow By Robert Frost Class-X English CBSEaurabinda banchhor
 
4.16.24 21st Century Movements for Black Lives.pptx
4.16.24 21st Century Movements for Black Lives.pptx4.16.24 21st Century Movements for Black Lives.pptx
4.16.24 21st Century Movements for Black Lives.pptxmary850239
 
HỌC TỐT TIẾNG ANH 11 THEO CHƯƠNG TRÌNH GLOBAL SUCCESS ĐÁP ÁN CHI TIẾT - CẢ NĂ...
HỌC TỐT TIẾNG ANH 11 THEO CHƯƠNG TRÌNH GLOBAL SUCCESS ĐÁP ÁN CHI TIẾT - CẢ NĂ...HỌC TỐT TIẾNG ANH 11 THEO CHƯƠNG TRÌNH GLOBAL SUCCESS ĐÁP ÁN CHI TIẾT - CẢ NĂ...
HỌC TỐT TIẾNG ANH 11 THEO CHƯƠNG TRÌNH GLOBAL SUCCESS ĐÁP ÁN CHI TIẾT - CẢ NĂ...Nguyen Thanh Tu Collection
 
ENG 5 Q4 WEEk 1 DAY 1 Restate sentences heard in one’s own words. Use appropr...
ENG 5 Q4 WEEk 1 DAY 1 Restate sentences heard in one’s own words. Use appropr...ENG 5 Q4 WEEk 1 DAY 1 Restate sentences heard in one’s own words. Use appropr...
ENG 5 Q4 WEEk 1 DAY 1 Restate sentences heard in one’s own words. Use appropr...JojoEDelaCruz
 
THEORIES OF ORGANIZATION-PUBLIC ADMINISTRATION
THEORIES OF ORGANIZATION-PUBLIC ADMINISTRATIONTHEORIES OF ORGANIZATION-PUBLIC ADMINISTRATION
THEORIES OF ORGANIZATION-PUBLIC ADMINISTRATIONHumphrey A Beña
 
Measures of Position DECILES for ungrouped data
Measures of Position DECILES for ungrouped dataMeasures of Position DECILES for ungrouped data
Measures of Position DECILES for ungrouped dataBabyAnnMotar
 
How to Add Barcode on PDF Report in Odoo 17
How to Add Barcode on PDF Report in Odoo 17How to Add Barcode on PDF Report in Odoo 17
How to Add Barcode on PDF Report in Odoo 17Celine George
 
How to do quick user assign in kanban in Odoo 17 ERP
How to do quick user assign in kanban in Odoo 17 ERPHow to do quick user assign in kanban in Odoo 17 ERP
How to do quick user assign in kanban in Odoo 17 ERPCeline George
 
USPS® Forced Meter Migration - How to Know if Your Postage Meter Will Soon be...
USPS® Forced Meter Migration - How to Know if Your Postage Meter Will Soon be...USPS® Forced Meter Migration - How to Know if Your Postage Meter Will Soon be...
USPS® Forced Meter Migration - How to Know if Your Postage Meter Will Soon be...Postal Advocate Inc.
 
ClimART Action | eTwinning Project
ClimART Action    |    eTwinning ProjectClimART Action    |    eTwinning Project
ClimART Action | eTwinning Projectjordimapav
 

Recently uploaded (20)

FINALS_OF_LEFT_ON_C'N_EL_DORADO_2024.pptx
FINALS_OF_LEFT_ON_C'N_EL_DORADO_2024.pptxFINALS_OF_LEFT_ON_C'N_EL_DORADO_2024.pptx
FINALS_OF_LEFT_ON_C'N_EL_DORADO_2024.pptx
 
Q4-PPT-Music9_Lesson-1-Romantic-Opera.pptx
Q4-PPT-Music9_Lesson-1-Romantic-Opera.pptxQ4-PPT-Music9_Lesson-1-Romantic-Opera.pptx
Q4-PPT-Music9_Lesson-1-Romantic-Opera.pptx
 
Activity 2-unit 2-update 2024. English translation
Activity 2-unit 2-update 2024. English translationActivity 2-unit 2-update 2024. English translation
Activity 2-unit 2-update 2024. English translation
 
4.16.24 Poverty and Precarity--Desmond.pptx
4.16.24 Poverty and Precarity--Desmond.pptx4.16.24 Poverty and Precarity--Desmond.pptx
4.16.24 Poverty and Precarity--Desmond.pptx
 
MULTIDISCIPLINRY NATURE OF THE ENVIRONMENTAL STUDIES.pptx
MULTIDISCIPLINRY NATURE OF THE ENVIRONMENTAL STUDIES.pptxMULTIDISCIPLINRY NATURE OF THE ENVIRONMENTAL STUDIES.pptx
MULTIDISCIPLINRY NATURE OF THE ENVIRONMENTAL STUDIES.pptx
 
Expanded definition: technical and operational
Expanded definition: technical and operationalExpanded definition: technical and operational
Expanded definition: technical and operational
 
Active Learning Strategies (in short ALS).pdf
Active Learning Strategies (in short ALS).pdfActive Learning Strategies (in short ALS).pdf
Active Learning Strategies (in short ALS).pdf
 
Inclusivity Essentials_ Creating Accessible Websites for Nonprofits .pdf
Inclusivity Essentials_ Creating Accessible Websites for Nonprofits .pdfInclusivity Essentials_ Creating Accessible Websites for Nonprofits .pdf
Inclusivity Essentials_ Creating Accessible Websites for Nonprofits .pdf
 
Millenials and Fillennials (Ethical Challenge and Responses).pptx
Millenials and Fillennials (Ethical Challenge and Responses).pptxMillenials and Fillennials (Ethical Challenge and Responses).pptx
Millenials and Fillennials (Ethical Challenge and Responses).pptx
 
Dust Of Snow By Robert Frost Class-X English CBSE
Dust Of Snow By Robert Frost Class-X English CBSEDust Of Snow By Robert Frost Class-X English CBSE
Dust Of Snow By Robert Frost Class-X English CBSE
 
4.16.24 21st Century Movements for Black Lives.pptx
4.16.24 21st Century Movements for Black Lives.pptx4.16.24 21st Century Movements for Black Lives.pptx
4.16.24 21st Century Movements for Black Lives.pptx
 
HỌC TỐT TIẾNG ANH 11 THEO CHƯƠNG TRÌNH GLOBAL SUCCESS ĐÁP ÁN CHI TIẾT - CẢ NĂ...
HỌC TỐT TIẾNG ANH 11 THEO CHƯƠNG TRÌNH GLOBAL SUCCESS ĐÁP ÁN CHI TIẾT - CẢ NĂ...HỌC TỐT TIẾNG ANH 11 THEO CHƯƠNG TRÌNH GLOBAL SUCCESS ĐÁP ÁN CHI TIẾT - CẢ NĂ...
HỌC TỐT TIẾNG ANH 11 THEO CHƯƠNG TRÌNH GLOBAL SUCCESS ĐÁP ÁN CHI TIẾT - CẢ NĂ...
 
ENG 5 Q4 WEEk 1 DAY 1 Restate sentences heard in one’s own words. Use appropr...
ENG 5 Q4 WEEk 1 DAY 1 Restate sentences heard in one’s own words. Use appropr...ENG 5 Q4 WEEk 1 DAY 1 Restate sentences heard in one’s own words. Use appropr...
ENG 5 Q4 WEEk 1 DAY 1 Restate sentences heard in one’s own words. Use appropr...
 
THEORIES OF ORGANIZATION-PUBLIC ADMINISTRATION
THEORIES OF ORGANIZATION-PUBLIC ADMINISTRATIONTHEORIES OF ORGANIZATION-PUBLIC ADMINISTRATION
THEORIES OF ORGANIZATION-PUBLIC ADMINISTRATION
 
Measures of Position DECILES for ungrouped data
Measures of Position DECILES for ungrouped dataMeasures of Position DECILES for ungrouped data
Measures of Position DECILES for ungrouped data
 
INCLUSIVE EDUCATION PRACTICES FOR TEACHERS AND TRAINERS.pptx
INCLUSIVE EDUCATION PRACTICES FOR TEACHERS AND TRAINERS.pptxINCLUSIVE EDUCATION PRACTICES FOR TEACHERS AND TRAINERS.pptx
INCLUSIVE EDUCATION PRACTICES FOR TEACHERS AND TRAINERS.pptx
 
How to Add Barcode on PDF Report in Odoo 17
How to Add Barcode on PDF Report in Odoo 17How to Add Barcode on PDF Report in Odoo 17
How to Add Barcode on PDF Report in Odoo 17
 
How to do quick user assign in kanban in Odoo 17 ERP
How to do quick user assign in kanban in Odoo 17 ERPHow to do quick user assign in kanban in Odoo 17 ERP
How to do quick user assign in kanban in Odoo 17 ERP
 
USPS® Forced Meter Migration - How to Know if Your Postage Meter Will Soon be...
USPS® Forced Meter Migration - How to Know if Your Postage Meter Will Soon be...USPS® Forced Meter Migration - How to Know if Your Postage Meter Will Soon be...
USPS® Forced Meter Migration - How to Know if Your Postage Meter Will Soon be...
 
ClimART Action | eTwinning Project
ClimART Action    |    eTwinning ProjectClimART Action    |    eTwinning Project
ClimART Action | eTwinning Project
 

A 4 trillion cubic meter slice through ~2 billion years of natural erosion rates

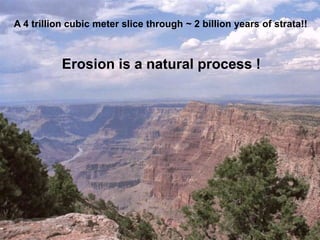
  • 1. A 4 trillion cubic meter slice through ~ 2 billion years of strata!! Erosion is a natural process !
  • 2. Natural erosion rates (m/m.y. = meters per million years) http://bulletin.geoscienceworld.org/cgi/reprint/119/1-2/140
  • 4. Natural vs. accelerated erosion globally Natural Erosion Accelerated Erosion acclerated erosion = accelerated by human activities
  • 5. Impact of climate on natural erosion rates Brady and Weil (2002)
  • 6. Variation in natural erosion rates
  • 7. Intense thunderstorms provide the desert areas of the Southwestern US with most of their meager annual precipitation.
  • 8. What do you think this arroyo looks like during a thunderstorm?
  • 9. Fortunately most of land surface not covered by vegetation is covered by desert pavement
  • 10. Fortunately most of land surface not covered by vegetation is covered by or cryptobiotic crusts desert pavement
  • 12.
  • 13. Understanding water erosion processes 300 – 900 PSI 20- 40 feet / s 1) Detachment 2) Transport 3) Deposition Brady and Weil (2002)
  • 14. Detachment Transport Deposition
  • 15. Manobolo River Detachment estimates >> river sediment loads Why ?? Most sediment is deposited within the same landscape
  • 16. Deposition zone Elevated SOM and nutrient levels
  • 17. Sheet erosion Brady and Weil (2002)
  • 18. Rill erosion Rills result from concentrated flow and can be filled by normal tillage operations Brady and Weil (2002)
  • 19. We had better do something before this rill turns into a gully.
  • 20. Gully erosion Dad !!! I think the rill has turned into a gully!
  • 21. From : Steve Groff sgroff@hughes.net Sent : Thursday, June 29, 2006 5:49 AM Hi Joel, We ended up with 14.8" of rain over a 4 day period. These pictures show how my neighbor’s plowed fields look. The ditch was up to 4' 4" deep and averaged about 3' deep in a 400' section- that is not a typo! The staked tomato picture is on my side of the property line looking from that ditch-100 feet away. I did have a little bit of erosion but could find nothing over 1" deep… Steve
  • 22. Fresh Market Tomatoes planted no-till into cover crops on Steve Groff’s farm
  • 24. When a stream is straightened or widened, streambank erosion increases. Accelerated streambank erosion occurs until the stream reestablishes a stable size and pattern. Streambank erosion When land use changes occur in a watershed, such as clearing of land for agriculture or development, runoff increases. With this increase in runoff the stream channel will adjust to accommodate the additional flow, increasing streambank erosion.
  • 25. Shoreline erosion As a boater, you can reduce shoreline erosion by reducing the speed and resulting wake from your boat, especially when the water level is above normal. Hydrologists estimate a wake 10” high is five times as destructive to the shoreline as a 5” wake and a wake that is 25” high has a destructive potential that is 30 times greater than a 5” wake.
  • 26. Engineering properties of soil Liquid limit Brady and Weil, 2002 low Moisture content high When moistened to its liquid limit, a soil starts to flow.
  • 27. La Conchita landslide On January 14th 2005, 250,000 cubic yards of soil flowed into the La Conchita neighborhood destroying 13 houses and severely damaging 23 others.
  • 28. Slump
  • 29. Creep
  • 30. Major causes of accelerated erosion in Illinois Arrival of tractors and the moldboard plow Arrival of soybean as a major crop replacing oats Construction and Mining Highest rates
  • 31. It looks like we have made lots of progress… but how much confidence should we have in these #s??
  • 32. ―It is questionable whether there has ever been another perceived public problem for which so much time, effort and money were spent in light of so little scientific evidence.‖
  • 33. History of the Universal Soil Loss Equation (USLE) During the 1940s and 50s, soil scientists in the Corn Belt region began to develop quantitative methods of predicting soil loss. It was recognized that a soil loss equation would be a valuable tool for farm planning. In 1946, a group of erosion specialists held a workshop in Ohio to reappraise the factors previously used to predict erosion (slope and management) and added a rainfall intensity factor. The National Runoff and Soil Loss Data Center was established at Purdue University in 1954 to locate, assemble, and consolidate data from soil erosion studies throughout the United States. Pioneering the use of computers to analyze more than 11,000 plot-years of basic runoff and soil loss data from studies at 47 locations in 24 states, Walter Wischmeier (director of the NRSLDC) and collaborators developed the Universal Soil Loss Equation (USLE) in the late 1950s. By the 1970s, the USLE (first introduced in 1958) was widely used for conservation planning worldwide. Lots of good science went into developing the USLE
  • 34. History of the Universal Soil Loss Equation (USLE) During the 1940s and 50s, soil scientists in the Corn Belt region began to develop quantitative methods of predicting soil loss. It was recognized that a soil loss equation would be a valuable tool for farm planning. In 1946, a A = R * K * LS * C * P group of erosion specialists held a workshop in Ohio to reappraise the factors previously used to predict erosion (slope and management) and added a rainfall intensity factor. The National Runoff and Soil Loss Data Rainfall erosivity factor Soil erodibility factor Topgraphy factor Cover factor Erosion control practices factor Predicted soil loss (tons/acre) Center was established at Purdue University in 1954 to locate, assemble, and consolidate data from soil erosion studies throughout the United States. Pioneering the use of computers to analyze more than 11,000 plot-years of basic runoff and soil loss data from studies at 47 locations in 24 states, Walter Wischmeier (director of the NRSLDC) and collaborators developed the Universal Soil Loss Equation (USLE) in the late 1950s. By the 1970s, the USLE (first introduced in 1958) was widely used for conservation planning worldwide.
  • 35. Newer versions of the USLE, (RUSLE (Revised Universal Soil Loss Equation) and RUSLE 2) have been developed and are now in use by the National Resources Conservation Service (NRCS) for program planning and implementation. Major changes to the USLE incorporated into RUSLE(2) include:  new and improved isoerodent maps and erodibility index (EI) distributions for some areas  new soil erodibility factors which reflect freeze-thaw in some geographic areas  new equations to account for slope length and steepness  additional sub-factors for evaluating the cover and management factor for cropland and rangeland  includes new conservation practice values for cropland and rangeland. A new Agriculture Handbook (No. 703) which describes RUSLE in great detail was published in 1997 and is now accessible on-line. http://www.ott.wrcc.osmre.gov/library/hbmanual/rusle703.htm
  • 36. R values in IL Isoerodent lines
  • 37. K values vary with texture and OM
  • 39. Impact of management (C and P factors)
  • 40. The main reason why RUSLE #s do not match up very well with real measurements is because most erosion occurs during extreme weather events (that are not included in the RUSLE model).
  • 41. Extreme soil erosion occurred in IA during the first 2 weeks of June 2008
  • 42. Direct measurements of erosion are the most accurate method of quantifying soil erosion, but are also the most laborious, time consuming, and expensive. They involve collecting deposited materials and taking volumetric and weight measurements.
  • 43. Indirect measurements of erosion use natural benchmarks and established benchmarks to evaluate long term changes in soil depth/elevation. 1) A-horizon reconstruction is the comparison of A-horizon thicknesses between lands suspected of being eroded and surrounding tracks of otherwise similar soil but that are known not to have been affected by human action. 2) Natural benchmarks such as trees or boulders might have soil marks, not unlike the high water marks on buildings in recently flooded areas. Volumetic remeasurements can be estimated on the basis of the distance between the surface and the mark. 3) Erosion pins are metal rods set into the ground, typically with a portion sticking up above the surface some known and recorded amount (10 cm). Flagging is tied to the stake to warn possible disturbers. The distance between the top of the pin and the surface are recorded over time. A variation on this theme is to use a very long spike driven through a washer to ground level. Over time, the distance the washer drops from the top of the spike to the eroded ground surface can be recorded. 4) Erosion pipes are similar to pins except that soil remains undisturbed within the pipe while it erodes away on the outside. Differences between soil height inside and outside of the pipe can be compared over time.
  • 44. The economics of off-site erosion Karl L. Guntermann, Ming T. Lee and Earl R. Swanson - 1976 Erosion and sedimentation in agriculture has traditionally been thought to result in substantial costs to the producer implying that voluntary measures at soil conservation would be in the individual's and society's interest. The research reported here indicates that off- site sediment damages are far greater than the on- site productivity effects of erosion and that there is considerable justification for stronger public policies in this area. The development of the efficient production frontier reveals that conventional production techniques are quite inefficient compared to procedures that could be adopted.
  • 46. The U. S. Army Corps of Engineers spends ~ $ 100 million a year dredging the main channel of the Mississippi.
  • 47. The U. S. Army Corps of Engineers spends ~ $ 100 million a year dredging the main channel of the Mississippi. Dustpan dredge Cutterhead dredge
  • 48.
  • 49. On-site effects of erosion The main on-site impacts of accelerated erosion are loss of soil fertility and water-holding capacity. Eroded sediment normally contains elevated levels of nutrients and SOM relative to the soil left behind. Also, because the finest constituents of sediment tend to be transported furthest, eroded soils become preferentially depleted of their finer constituents over time; which often reduces their water-holding capacity. In other words, ―Erosion removes the cream of the soil‖. In affluent areas of the world, accelerated erosion’s on- site effects can often be mitigated by increased use of fertilizer and irrigation; however this is not an option for much of the earth’s population.
  • 50. What are the on-site costs of this erosion?
  • 51. Hill-top erosion on Midwest farms http://outdoors.webshots.com/photo/1236540189056376852HRFRXH
  • 52. Tillage erosion Tillage erosion has only recently been recognized as a form of soil erosion. Studies across North America and Europe have concluded that tillage erosion is the primary cause of the severe soil loss and crop yield loss observed on hilltops. Tillage erosion is the progressive downslope movement of soil by tillage causing soil loss on hilltops (knolls) and soil accumulation at the base of slopes (depressions). Large, aggressive tillage implements, operated at excessive depths and speeds are more erosive, with more passes resulting in more erosion. Landscapes that are very topographically complex (with many short, steep, diverging slopes) are more susceptible to tillage erosion.
  • 53. Visual evidence of tillage erosion includes loss of topsoil and exposure of subsoil at the summit of ridges and knolls; and undercutting of field boundaries, such as fence lines, on the downslope side and burial on the upslope side. The soil loss on hilltops resulting from tillage erosion reduces crop productivity and increases field variability. Rates of soil loss on hilltops are often more than 10 times what is considered to be tolerable for sustainable production. Consequently, yield losses associated with these areas are often as high as 30 to 50%.
  • 54.
  • 56. Moving topsoil from deposition areas to degraded areas on the Mitchell Farm in Waterloo, IA Light green zones have excess topsoil. Darker green zones have successively less topsoil and red zones have the smallest amount of topsoil. Black lines represent optimal routes for a tractor to follow when redistributing top soil. The map on the right is the expected outcome.
  • 57. Hugh Hammond Bennett From “Soil Erosion: A National Menace (1928) “What would be the feeling of this Nation should a foreign nation suddenly enter the United States and destroy 90,000 acres of land, as erosion has been allowed to do in a single county?” “To visualize the full enormity of land impairment and devastation brought about by this ruthless agent is beyond the possibility of the mind. An era of land wreckage destined to weigh heavily upon the welfare of the next generation is at hand.” Soil scientist and showman
  • 58. Dust from the High Plains blotted out the sun in Washington DC and helped HH Bennett convince Congress to fund the SCS. http://www.nrcs.usda.gov/Internet/FSE_MEDIA/nrcs143_020944.jpg
  • 59. On September 13, 1933, the Soil Erosion Service was formed in the Department of the Interior, with Bennett as chief. The service was transferred to the Department of Agriculture on March 23, 1935, and was shortly thereafter combined with other USDA units to form the Soil Conservation Service (SCS) by the Soil Conservation and Domestic Allotment Act of 1935. Hugh Bennett continued as chief, a position he held until his retirement in 1951. On October 20, 1994, the agency was renamed the Natural Resources Conservation Service (NRCS) to reflect its broader mission.
  • 60. Hugh Hammond Bennett inspecting strip cropping in the Coon Creek Watershed – the nation’s first watershed demonstration project
  • 61. The ~ 500 Coon Creek farmers who signed five-year contracts received $0.50/acre payments, foreshadowing future financial assistance programs designed to promote wise stewardship of natural resources. The Soil Conservation Service supplied Coon Creek farmers with seed, fertilizer and fencing, and the Civilian Conservation Corps (known as the ―CCC Boys) provided a huge amount of labor. They quarried and crushed millions of tons of limestone, installed nearly 29,000 miles of terracing, cultivated and planted many millions of trees and cleared channels and reservoirs of nearly 400,000 square yards of sediment and debris, in addition to other back-breaking tasks.
  • 62. Coon Creek Watershed today More than 95% of the 92,000-acre watershed is currently covered by a conservation plan. Some current landowners still adhere to agreements their parents worked out with Bennett’s team more than 70 years ago.
  • 63. So what has been the long term impact of the Coon Creek project that Aldo Leopold once called an ―adventure in cooperative conservation?‖ Going by the numbers, a satisfying portrait emerges: •Erosion within the watershed has decreased 75% •Sediment leaving the watershed has decreased 94% •Gullies—some described as ―big enough to hold a house‖— were reduced by 77% by the late 1970s. •Flooding, once common on area farms, has been minimized. •The watershed is now 44% forested
  • 64.
  • 65. Since 1936, ~ $300 billion has been spent on conservation programs !
  • 66. In the 1985 Farm Bill, Congress decided that as a quid pro quo for federal farm assistance, farmers receiving taxpayer support should control soil erosion on highly erodible lands (HEL) used to grow subsidized crops. The policy principle was straightforward and widely embraced in conservation and agriculture policy circles: taxpayer support for agriculture should not inadvertently subsidize degradation of natural resources or the environment. Parallel policies were authorized in the 1985 law to prevent subsidies from encouraging conversion of fragile lands and wetlands to crop production.
  • 67. WHAT IS HEL LAND? According to the USDA, a field is designated as highly erodible land (HEL) if: a) RKLS/T for the soil mapping units equals or exceeds 8. b) the highly erodible soil mapping units in the field make up 33 percent or more of the field’s acreage or c) the highly erodible soil mapping units in the field equal 50 or more acres.
  • 69. In order to maintain their eligibility for federal farm benefits such as commodity crop subsidies and disaster payments, farmers with subsidized crops on HEL land were required to develop and implement a government-approved soil conservation plan specifying soil conservation practices. Common erosion reduction practices include: rotating crops, minimizing tillage, leaving soil covered with crop residue after harvest, and installing grassed buffers, etc. This program was called the Highly Erodible Land Conservation (HELC) Compliance provision or ―conservation compliance‖.
  • 70. Corn production on land classified as HEL by NRCS Acres per county 200 - 12,000 12,000 – 37,000 37,000 - 62,000 > 62,000 https://www.agronomy.org/publications/aj/articles/96/1/1
  • 71. Farmers were given 10 years (until 1995) to fully implement the soil conservation plans. The U.S. Department of Agriculture (USDA) attributes the HELC planning and compliance process with widespread adoption of conservation systems, which made unprecedented progress in reducing erosion over these 10 years. HELC compliance, coupled with the Conservation Reserve Program (CRP), reduced erosion by about 40 percent (1.2 billion tons) from 3.07 billion tons in 1982 to 1.9 billion tons in 1997 (national soil survey years which encompass the 1985 to 1995 time period). USDA attributes about 25 percent of that reduction to HELC compliance requirements. HELC compliance is also credited with a ―technology- forcing‖ effect that helped reduce erosion on cropland not subject to HELC plans.
  • 72. Since full implementation of HELC compliance plans in 1995, there has been little additional progress in reducing erosion. According to the National Resources Inventory (NRI) survey, approximately 100 million acres of cropland in the U.S.—nearly one-third of the 368 million acres of cropland nationwide —continue to erode at rates deemed ―unsustainable.‖
  • 73.
  • 74. Each red dot = 100,000 tons of wind erosion, total = 765 million tons Each blue dot = 100,000 tons of water erosion, total = 960 million tons
  • 75. HEL Compliance Is conservation system application required on HEL ground? Yes, if the land is used to produce agricultural commodity crops. Responsibility rests with both landowners and operators to implement an appropriate conservation system or forfeit USDA program benefits. Conservation systems are specific to each HEL tract on a farm. What is the most common mistake made by operators out of compliance? Working soybean ground is the most common mistake that results in noncompliance. Working soybean ground even lightly can cause your operation to be out of compliance, as many conservation systems require no-till or strip-till on soybean stubble. Keep a few things in mind about tillage. Using aerators or rotary harrows on fields scheduled for no-till may result in noncompliance. Strip tillage with less than 25% row disturbance is equivalent to no-till. In a no-till system, if ruts occur due to wet conditions at harvest, light tillage to level the site is acceptable, but only on the affected area. Producers should contact their NRCS office before performing tillage.
  • 76. Additional Practices Depending on your land, additional practices may be required, such as gully and/or concentrated flow erosion control through structural practices. This may include establishment and maintenance of practices, such as: Grassed waterways Water & sediment control basins Terraces Grade control structures Diversions Other NRCS approved conservation practices
  • 77. Is your farming system in compliance? Conservation cropping systems for HEL
  • 78.
  • 79. None of the 10 Mississippi River border states reviewed sufficient numbers of tracts to achieve the one percent NRCS goal from 2000 to 2006 Number of tracts reviewed # to review each year to 2000 to State 2000 2001 2002 2003 2004 2005 2006 achieve 2006 1% review goal Arkansas 815 322 266 273 545 338 430 367 2,541 Illinois 2,883 1,184 1,162 1,030 1,061 1,803 2,257 1,977 10,474 Iowa 2,535 1,512 1,430 1,542 1,516 2,387 2,205 1,707 12,299 Kentucky 2,367 762 938 823 1,017 1,248 1,934 1,612 8,334 Louisiana 606 242 244 242 247 423 349 285 2,032 Minnesota 1,912 572 505 514 506 1,382 1,049 960 5,488 Mississippi 853 426 423 421 465 482 356 297 2,870 Missouri 1,723 838 881 1,069 922 1,283 1,103 1,185 7,281 Tennessee 1,775 361 440 440 435 584 1,059 861 4,180 Wisconsin 1,620 625 835 827 791 1,430 1,428 1,239 7,175 TOTAL 17,089 6,844 7,124 7,181 7,505 11,360 12,170 10,490 62,674
  • 80. Erosion continues to be a serious issue in Western Illinois (#s = % of sample points) County < 1 *T 1-2*T > 2*T Adams 85 12 3 Brown 75 17 8 Hancock 91 6 3 Henderson 91 7 2 McDonough 85 12 3 Pike 70 18 11 Schuyler 83 13 4 http://www.agr.state.il.us/darts/References/transect/transect06.pdf T = tolerable level of erosion according to NRCS
  • 81. ~ 50% of the crop acres eroding at rates > T in the 10 Mississippi River border states are not subject to conservation compliance http://www.ewg.org/book/export/html/22513
  • 82. Crop residue is not trash – its cover for the soil !!
  • 83. This is soil pornography !
  • 84. Photo comparison method of estimating residue cover 25% 50% 75% 90%
  • 85. One pass with a disk ~60 % residue cover
  • 86. Two passes with a disk might still be considered conservation tillage
  • 87. A single disking of less abundant and more fragile soybean residues is likely to leave less than 20% residue cover and not qualify as conservation tillage.
  • 88. Impact of field operations on residue cover can also be estimated using tables such as the one to the right
  • 89. Relationship between yield and residue cover
  • 90. Line transect method of estimating residue cover
  • 91. Line transect method of estimating residue cover The line-transect method is an easy, reliable way to determine residue cover. It involves stretching a 50-foot measuring tape, line or rope (knotted, beaded or otherwise marked at six inch intervals) diagonally across crop rows. Percent cover is determined by counting the number of marks that intersect or lie directly over a piece of residue. The key to accuracy with this method is avoiding over- or underestimation. Look straight down on each mark and take all readings on the same side of the tape or rope, asking yourself, ―If a raindrop falls at this point, would it hit residue or bare soil?‖ In general, residue should be 3/32 inch (roughly the size of a healthy wheat straw) in diameter or larger. If there is any doubt at all, do not count it. At least five measurements should be taken and averaged at each site !
  • 92. In 2006, no-till rose to 33.2% of Illinois cropland, while conventional tillage dropped to 31.2% !
  • 93. In 2006, for the first time, more than half of the soybeans grown in IL were planted no-till !
  • 94. WET SPRINGS CAUSING ILLINOIS PRODUCERS TO INCREASE FALL TILLAGE Wet springs the past two years have caused an increase in crop tillage, according to a new study from the Illinois Department of Agriculture. The 2011 Illinois Soil Conservation Transect Survey revealed that no-till crop production has fallen five percentage points since 2009. The farmers who switched production systems have not abandoned soil conservation practices entirely, however. While the use of conventional tillage increased during this period, so did the use of mulch-till, a practice that leaves at least 30 percent of the residue from the previous crop on the ground and, much like no-till, protects soil from erosion. No-till farming still is the conservation practice of choice among Illinois farmers. However, the gap between it and mulch-till has narrowed considerably. The survey shows 21.4 percent of fields now are planted using mulch-till, up from 20.7 percent in 2009 and 16.4 percent in 2006. No-till usage has declined during the same span from a record-high of 33.2 percent in 2006 to the current 24.2 percent. http://www.agrimarketing.com/ss.php?id=71271
  • 95. Criteria used to rate soil suitability for no-till in PA Factors More suitable Less suitable Temperature regime Warmer: > 2800 GDD Cooler: < 2800 GDD Soil drainage Good: Most soils are well or Poor: Most soils are moderately well drained very poorly, poorly or somewhat poorly drained Water holding Low: < 6‖ High: > 6 ― capacity of root zone Slope High: > 8 % slope Low: < 8% slope Rock fragment High: Most soils are loamy Low: Most soils are not content and sandy skeletal skeletal Duiker et al., 2001
  • 96. No-till is much more challenging on some soils but innovative farmers are making no-till work on most soils
  • 97.
  • 98. Conservation tillage is just one piece of a comprehensive approach to soil and water conservation
  • 99. Contour strip cropping http://allamakeeswcd.org/wp-content/uploads/2010/04/contour-farming.jpg
  • 100. Contour terraces capture sediment and transform long slopes into a series of shorter slopes. http://www.ia.nrcs.usda.gov/news/brochures/terraces.html
  • 102. Steve Nebel Cover crops
  • 105. Tile Drainage - it is well established through both scientific investigation and farmer observations that improved drainage reduces surface runoff and transport of sediment.
  • 106. Impact of the 2008 floods on IA soils 20 tons per acre average soil loss across 2,284,000 ac! Conservation structures needing repair 12,157 Grassed Waterways 8,137 Terraces 3,375 Water and Sediment Control Basins 800 Grade Stabilization Structures Fields with combinations of two or more conservation practices (e.g., no-till + cover crops) performed much better than fields with a single practice
  • 107. Erosion is more than an agricultural issue
  • 108. Major efforts are being made to control erosion in urban areas
  • 109. Silt fences are intended to trap sediment while allowing water to slowly flow through. The bottom of the fabric should be buried at least six inches under the soil to prevent sediment from escaping under the fence
  • 111. Diversion of water from trails prevents washouts
  • 112. Waterway stabilized with rock and geotextile
  • 113. Wind erosion is a serious problem in the Western US
  • 114. Wind Erosion Equation (WEQ) E=f(IKCLV) E is the estimation of average annual soil loss in tons per acre f indicates the equation includes complex relationships rather than just multiplication as in the USLE/RUSLE. I is the soil erodibility index. K is the ridge roughness factor. C is the climatic factor. All climatic factor values are expressed as a percentage of the value established at Garden City, Kansas. L is the unsheltered distance across an erodible field, measured along the prevailing wind erosion direction. V is the vegetative cover factor.
  • 116. Lots of discussion about dust storms on Ag Talk recently: ―I want to say it doesn't look that bad, but I know every pic I've taken "doesn't look that bad." This is definitely the worst I've ever seen. Even no-tilled ground is blowing on top of the hills.‖