Sna demo apr 11 annotated
•Descargar como PPTX, PDF•
2 recomendaciones•493 vistas

A demonstration of some of the potential for social network analysis. This is a previously-posted file which I had meant to narrate, but the sound didn't work out. I have added annotations to this file.

Recomendados
Recomendados
Más contenido relacionado
La actualidad más candente
La actualidad más candente (13)
Destacado
Destacado (20)
Similar a Sna demo apr 11 annotated
Similar a Sna demo apr 11 annotated (20)
Más de John Burrett
Más de John Burrett (8)
Sna demo apr 11 annotated
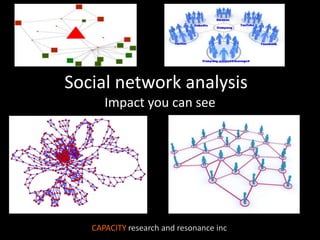
- 1. Social network analysis Impact you can see CAPACITY research and resonance inc
- 2. Social network analysis What is it? Social network analysis views social relationships in terms of network theory consisting of nodes (representing individual actors within the network) and connections or links (which represent relationships between the individuals). These networks are often depicted in a social network diagram, where nodes are the points and ties are the lines. OK, very cool, but what can we do with it?
- 3. Here’s a hypothetical example involving government relations. Success in government relations and advocacy of course relies on relationships and networks, and it is critical to understand networks STRATEGICALLY
- 4. In this example, the Board of Directors of a housing support association want to explore strategic linkages in other sectors. They are already well connected in the community safety world, but they know it’s important to join forces with key players in community health. How are they going to do this?
- 5. Key questions would be – who do they already know, and to whom who should they reach out? This is a complex area, with many players in policy and delivery. Attacking this problem will require planned outreach and relationship- building. So, how can they map this out?
- 6. You can try the flip chart method, sticky notes, drawing arrows and circles, but it’s confusing and difficult and you will miss key information
- 7. Social network analysis lets your group input their set of mutual and separate connections to key players. Usually this should mean strong connections,,, someone who will take your call. After a short period, you will have a data matrix – still looks awful, but….
- 8. Network analysis software turns this data into a picture of the connections that your group has input. This is a hypothetical view, actually generated by data fabricated for this demonstration, but it is typical of the kind of result you would probably see. It might still look confusing, but look closer.
- 9. Here’s the Housing Association, Board members, President and Executive Director. They are of course interconnected, and hence are clustered here.
- 10. Similarly, the community safety actors can be assumed to know each other, and form another cluster
- 11. And the community health players constitute another cluster. This is where the housing association would like to connect
- 12. So, where do we need to make connections? The Executive Director is not well connected in health, but is connected to the staff of the public safety minister, the Prime Minister’s office and the department of finance
- 13. This Board member is connected to the Minister for community health and the ADM for safety, who is herself well connected in health Board member #5 is well connected to health associations, all of whom can help bring the housing agenda into play
- 14. Challenges – the President is connected in safety but not in health. Some Board members may have more capacity to engage, and the PCO needs connecting
- 15. reach collaborations connections diffusion clusters policy technology evaluation social performance research advocacy marketing This hypothetical example illustrated the possibility of application of social network analysis to many fields, including diffusion of information and technology, inter-organizational collaboration, policy and evaluation
- 16. Here’s another example, in the field of community development. How can you see the intricate connections that are necessary for achieving, and demonstrating progress toward, community development?
- 17. Suppose you are running a community engagement program for seniors. You might want to see if you were making a difference by hosting bridge nights. The idea is that participants would make friends and be less isolated. How would you produce a systematic measure of progress toward that goal?
- 18. Again, social network analysis techniques, working with the participants, can give you a rich data set
- 19. As in the previous example, we can turn this data into an intuitively accessible picture. This view, as before, generated for this demonstration, might summarize the “before” situation, at the start of the program,, using data input by the participants as to whom they know well and count as friends. We see some important concerns, strong points and opportunities. We see some relatively isolated individuals, but also some potential around a group of neighbors and a social club. We see several links to the local library, and a strong group brought together by volunteering.
- 20. Now suppose this is the picture 3 months later. We see a lot of changes, with strong groups bringing in previously isolated people, although some are still relatively isolated
- 21. It’s hard to go back to the drawing board and make changes. But is is better when you have information and ideas, and can see what you need to do next
- 22. SOCIAL NETWORK ANALYSIS Impact you can see Capacity research and resonance inc Facilitated analytics, visual data and powerful presentations for planning, evaluating and reporting
Notas del editor
- Click 1 – Social network analysisClick 2 – impact you can see. This is an introduction to social network analysis and some of the things you can do with it.Click 3 – its revealing,, Click 4 - sometimes even beautifulClick 5 – and always useful when you need to know where and to whom your efforts reachClick 6 –We’ve added this capability to the Capacity toolbox - let’s have a look
- Click #1 then #2 – Social Network Analysis - what is it? Click #3 - Social network analysis, as a field, has been in development since the 1930s. Social network analysis (related to network theory) has emerged as a key technique in many fields, from sociology, anthropology and biology, through economics, information science andorganizational studies and has become a popular topic of speculation and study. Where traditional social scientific studies assume that it is the attributes of individual actors that matter, social network analysis focuses on the relationships and ties between actors within the network.Click #4 - Social network analysis views social relationships in terms of network theory consisting of nodes (representing individual actors within the network) and connections or links (which represent relationships between the individuals). These networks are often depicted in a social network diagram, where nodes are the points and ties are the lines. Click #5 (PAUSE)– This technique can be used to understand a wide range of relationships and dynamics in the real world. Aside from networks of individuals, social networks have also been used to examine how organizations interact with each other, for example, by characterizing the many informal connections that link executives together, as well as associations and connections between individual employees at different organizations. Let’s look at a few examples.
- – here’s a hypothetical example involving government relationsClick #1 – success in government relations and advocacy of course relies on relationships and networks,,,,, Click #3 - and it is critical to understand networks STRATEGICALLY
- In this example, the Board of Directors of a housing support association CLICK #1 – want to explore strategic linkages in other sectors. Click #2 – they are already well connected in the community safety world, butCLICK #3 – they know it’s important to join forces with key players in community heath Click #4 – how are they going to do this?
- Key questions would be – who do they already know, and to whom who should they reach out?Click #1 – this is a complex area, with many players in policy and deliveryClick #2 – attacking this problem will require planned outreach and relationship-buildingClick #3 – so, how can they map this out?
- YOU CAN TRY THE FLIP CHART METHOD – CLICK #2CLICK #3 – STICKY NOTESCLICK #4 DRAWING ARROWS AND CIRCLES,,,, BUT ITS CONFUSING AND DIFFICULT AND YOU WILL MISS KEY INFORMATION
- SOCIAL NETWORK ANALYSIS LETS YOUR GROUP INPUT THEIR SET OF MUTUAL AND SEPARATE CONNECTIONS TO KEY PLAYERSCLICK #1 – USUALLY THIS SHOULD MEAN STRONG CONNECTIONS,,, SOMEONE WHO WILL TAKE YOIUR CALLCLICK #3 – AFTER A SHORT PERIOD, YOU WILL HAVE A DATA MATRIX – STILL LOOKS AWFUL, BUT …….
- NETWORK ANALYSIS SOFTWARE LIKE UCINET TURNS THIS DATA INTO A PICTURE OF THE CONNECTIONS THAT YOUR GROUP HAS INPUT. THIS IS A HYPOTHETICAL VIEW, ACTUALLY GENERATED BY DATA FABRICATED FOR THIS DEMONSTRATION, BUT IT IS TYPICAL OF THE RESULT YOU WOULD PROBABLY SEE.IT MIGHT STILL LOOK CONFUSING,,, BUT LOOK CLOSER
- HERES THE HOUSING ASSOCIATION,, BOARD MEMBERS, PRESIDENT AND EXECUTIVE DIRECTOR. THEY ARE INTERCONNECTED, OF COURSE, AND HENCE ARE CLUSTERED HERE
- SIMILARLY, THE COMMUNITY SAFTEY ACTORS CAN BE ASSUMED TO KNOW EACH OTHER, AND FORM ANOTHER CLUSTER.
- AND THE COMMUNITY HEALTH PLAYERS CONSTITUTE ANOTHER CLUSTER. THIS IS WHERE THE HOUSING ASSOCIATION WOULD LIKE TO CONNECT
- SO,, WHERE ARE THE EXISTING CONNECTIONS, AND WHERE DO WE NEED TO MAKE CONNECTIONS?CLICK #1 – THE EXECUTIVE DIRECTOR IS NOT WELL CONNECTED IN THE HEALTH WORLD BUT IS, AT HER LEVEL, CONNECTED - CLICK #2 – TO THE STAFF OF THE SAFETY MINISTER ,,, CLICK #3 – THE PRIME MINISTER’S OFFICE AND …. CLICK #4 – THE DEPARTMENT OF FINANCE…. CLICK #5 & CLICK #6 – WHO WILL BE CRITICAL IN CONNECTING ON HEALTH
- CLICK AND CLICK #1– THIS BOARD MEMBER IS WELL CONNECTED TO CLICK # 2 THE MINISTER FOR COMMUNITY HEALTH AND … CLICK # 3 THE ADM FOR SAFETY, WHO IS WELL CONNECTED IN HEALTH … CLICK # 4CLICK #5 – BOARD MEMBER 5 IS WELL CONNECTED CLICK #6 TO ASSOCIATIONS IN THE HEALTH SPHERE, ALL OF WHOM WILL HELP BRING THE HOUSING AGENDA INTO PLAY … CLICK #7
- SOME CHALLENGES REMAIN…CLICK #1 – THE PRESIDENT IS WELL-CONNECTED IN SAFTEY.. CLICK #2 … BUT NOT REALLY TOWARD THE HEALTH WORLD .. CLICK 3… BUT… CLICK #4 COULD WORK WITH THE MORE CONNECTED BOARD MEMBERSCLICK #5 – SOME BOARD MEMBERS APPEAR TO HAVE MORE CAPACITY TO ENGAGE, SO THIS CAN BE WORKED ON,,,CLICK #6 – AND LAST BUT NOT LEAST, THE PRIVY COUNCIL OFFICE NEEDS ATTENTION
- (AS THE WORDS POP UP )………THIS ENTIRELY HYPOTHETICAL EXAMPLE ILLUSTRATES THE POSSIBILITY OF APPLICATION OF NETWORK ANALYSIS TO MANY FIELDS, INCLUDING DIFFUSION OF INFORMATION AND TECHNOLOGY, INTER-ORGANIZATIONAL COLLABORATION, POLICY AND EVALUATION.
- HERE’S ANOTHER EXAMPLE, IN THE FIELD OF COMMUNITY DEVELOPMENT. CLICK #1 – HOW CAN YOU SEE THE INTRICATE CONNECTIONS THAT ARE NECESSARY FOR, AND SHOW PROGRESS TOWARD, COMMUNITY DEVELOPMENT?
- SUPPOSE YOU WERE RUNNING A PROGRAM INVOLVING COMMUNITY ENGAGEMENT OF SENIORS. YOU MIGHT WANT TO DO SOME CASE STUDIES. IN ONE STUDY, YOU MIGHT WANT TO SEE HOW ONE FUNDED ORGANIZATION WAS MAKING A DIFFERENCE BY HOSTING BRIDGE CLUB NIGHTS. CLICK #2 – THE IDEA IS THAT PARTICIPANTS WOULD MAKE FRIENDS AND BE LESS ISOLATED. CLICK #3,,,, HOW WOULD YOU PRODUCE A SYSTEMATIC MEASURE OF PROGRESS TOWARD THAT GOAL?
- AGAIN,, SOCIAL NETWORK ANALYSIS TECHNIQUES, WORKING WITH THE PARTICIPANTS, CAN GIVE YOU A RICH DATA SET….. CLICK #1
- AS IN THE PREVIOUS EXAMPLE, SOCIAL NETWORK ANALYSIS SOFTWARE CAN TURN THIS DATA INTO AN INTUITIVELY ACCESSIBLE PICTURE. THIS IS A VIEW, AS BEFORE, GENERATED WITH DATA FABRICATED FOR THIS DEMONSTRATION, THAT MIGHT SUMMARIZE THE “BEFORE” SITUATION,,, AT THE START OF THE PROGRAM OF BRIDGE NIGHTS,,, USING DATA THAT HAS BEEN INPUT BY THE NEW PARTICIPANTS. WE SEE SOME IMPORTANT CONCERNS, STRONG POINTS AND OPPORTUNITIES. CLICK # 1, 2 &3 – WE SEE SOME RELATIVELY ISOLATED INDIVIDUALSCLICK # 4 AND 5 – BUT ALSO SOME POTENTIAL AROUND A GROUP OF NEIGHBORS AND A SOCIAL CLUBCLICK #6 – SEVERAL ISOLATED PEOPLE,, BUT WITH LINKS TO THE LOCAL LIBRARY … CLICK #7CLICK #8 – A STRONG GROUP BROUGHT TOGETHER BY VOLUNTEERING,,,, AND FINALLY,CLICK #9 – UNDER-UTILIZATION OF LOCAL ORGANIZATIONS
- NOW SUPPOSE WE LOOK AT THE WAY THE PARTICIPANTS FEEL THAT THEY CONNECT, IN TERMS OF PEOPLE THEY CALL FRIENDS AND ORGANIZATIONS WITH WHICH THEY MIGHT INTERSECT, AFTER A FEW MONTHS. WE CAN SEE A LOT OF CHANGES – CLICK #1 – THE STRONG GROUP SEEN BEFORE HAS BROUGHT IN TWO PREVIOUSLY ISOLATED INDIVIDUALS… CLICK #2 AND … CLICK #3.. CONTINUES TO ANCHOR OTHERS CLICK #4– MORE LINKS HAVE BEEN MADE IN THE VICINITY OF THIS GROUP, CLICK #5… AN ISOLATED INDIVIDUAL HAS BEEN LINKED WITH OTHERS, AND…. CLICK 6…A COMMUNITY GROUP IS IN PLAYCLICK 7 – THE NEIGHBOR GROUP IS SOMEWHAT MORE COHESIVE BUT …. CLICK 8,,,, SOME MEMBERS MAY STILL BE RELATIVELY ISOLATEDCLICK 9 – AND TWO INDIVIDUALS ARE STILL MORE OR LESS WHERE THEY BEGANTHIS MAPPING ALOWS THE PROGRAM TO IDENTIFY BOTH RESULTS, COMPARED TO THE STARTING POSITION .. CLICK #10 .. AND KEY AREAS FOR IMPROVEMENT.
- IT’S HARD TO GO BACK TO THE DRAWING BOARD AND MAKE CHANGES…CLICK #1 - BUT ITS BETTER WHEN YOU HAVE A SOURCE OF INFORMATION AND IDEAS,,, AND CLICK #3 CAN SEE AS AN ORGANIZATION WHAT YOU NEED TO DO NEXT.
- CLICK #1 SOCIAL NETWORK ANALYSIS ,,, IMPACT YOU CAN SEECLICK 2 & 3 – THANK YOU FOR VIEWING THIS PRESENTATION