
Recomendados
Recomendados
Más contenido relacionado
Destacado
Destacado (10)
Similar a J.C. Williams Group National Retail Bulletin December 2008 Us
Similar a J.C. Williams Group National Retail Bulletin December 2008 Us (20)
Último
Último (20)
J.C. Williams Group National Retail Bulletin December 2008 Us
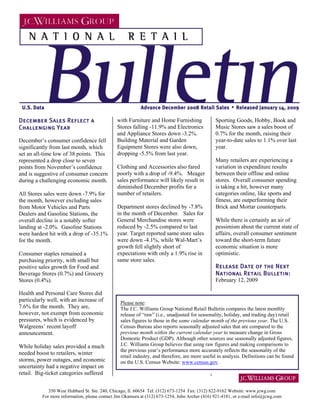
- 1. Advance December 2008 Retail Sales i Released January 14, 2009 U.S. Data with Furniture and Home Furnishing Sporting Goods, Hobby, Book and December Sales Reflect a Stores falling -11.9% and Electronics Music Stores saw a sales boost of Challenging Year and Appliance Stores down -3.2%. 0.7% for the month, raising their Building Material and Garden year-to-date sales to 1.1% over last December’s consumer confidence fell Equipment Stores were also down, year. significantly from last month, which dropping -5.5% from last year. set an all-time low of 38 points. This Many retailers are experiencing a represented a drop close to seven variation in expenditure results Clothing and Accessories also fared points from November’s confidence between their offline and online poorly with a drop of -9.4%. Meager and is suggestive of consumer concern stores. Overall consumer spending sales performance will likely result in during a challenging economic month. is taking a hit, however many diminished December profits for a categories online, like sports and number of retailers. All Stores sales were down -7.9% for fitness, are outperforming their the month, however excluding sales Brick and Mortar counterparts. Department stores declined by -7.8% from Motor Vehicles and Parts in the month of December. Sales for Dealers and Gasoline Stations, the While there is certainly an air of General Merchandise stores were overall decline is a notably softer pessimism about the current state of reduced by -2.5% compared to last landing at -2.0%. Gasoline Stations affairs, overall consumer sentiment year. Target reported same store sales were hardest hit with a drop of -35.1% toward the short-term future were down -4.1%, while Wal-Mart’s for the month. economic situation is more growth fell slightly short of optimistic. expectations with only a 1.9% rise in Consumer staples remained a same store sales. purchasing priority, with small but positive sales growth for Food and Release Date of the Next Beverage Stores (0.7%) and Grocery National Retail Bulletin: February 12, 2009 Stores (0.4%). Health and Personal Care Stores did particularly well, with an increase of Please note: 7.6% for the month. They are, The J.C. Williams Group National Retail Bulletin compares the latest monthly however, not exempt from economic release of “raw” (i.e., unadjusted for seasonality, holiday, and trading day) retail pressures, which is evidenced by sales figures to those in the same calendar month of the previous year. The U.S. Walgreens’ recent layoff Census Bureau also reports seasonally adjusted sales that are compared to the previous month within the current calendar year to measure change in Gross announcement. Domestic Product (GDP). Although other sources use seasonally adjusted figures, J.C. Williams Group believes that using raw figures and making comparisons to While holiday sales provided a much the previous year’s performance more accurately reflects the seasonality of the needed boost to retailers, winter retail industry, and therefore, are more useful in analysis. Definitions can be found storms, power outages, and economic on the U.S. Census Website: www.census.gov. uncertainty had a negative impact on retail. Big-ticket categories suffered 350 West Hubbard St. Ste. 240, Chicago, Il. 60654 Tel: (312) 673-1254 Fax: (312) 822-9162 Website: www.jcwg.com For more information, please contact Jim Okamura at (312) 673-1254, John Archer (416) 921-4181, or e-mail info@jcwg.com
- 2. NATIONAL RETAIL BULLETIN Release Date: 14/01/09 Retail Sales by Store Category Sales for the Month of December 2008 2007 2008/2007 All Stores 396,150 429,953 -7.9% Motor Vehicle and Parts Dealers 56,105 69,864 -19.7% Gasoline Stations 24,878 38,358 -35.1% Food and Beverage Stores 52,819 52,470 0.7% Grocery Stores 45,653 45,463 0.4% Health and Personal Care Stores 23,498 21,839 7.6% Building Material and Garden Equipment Stores 22,147 23,429 -5.5% General Merchandise Stores 69,593 71,346 -2.5% Department Stores (excluding leased departments) 27,380 29,700 -7.8% Clothing and Accessories Stores 28,296 31,235 -9.4% Furniture, Home Furnishings, Electronics and Appliance Stores 24,642 26,464 -6.9% Furniture and Home Furnishing Stores 9,839 11,172 -11.9% Electronics and Appliance Stores 14,803 15,292 -3.2% Sporting Goods, Hobby, Book and Music Stores 12,159 12,072 0.7% Miscellaneous Store Retailers 11,812 11,687 1.1% Nonstore Retailers 32,356 32,693 -1.0% Food Services and Drinking Places 37,845 38,496 -1.7% Year to Date Sales Ending December 2008 2007 2008/2007 All Stores 4,478,360 4,482,668 -0.1% Motor Vehicle and Parts Dealers 809,736 919,252 -11.9% Gasoline Stations 489,252 445,212 9.9% Food and Beverage Stores 589,512 560,649 5.1% Grocery Stores 527,395 501,077 5.3% Health and Personal Care Stores 247,022 237,437 4.0% Building Material and Garden Equipment Stores 325,181 337,173 -3.6% General Merchandise Stores 595,536 576,426 3.3% Department Stores (excluding leased departments) 200,437 209,892 -4.5% Clothing and Accessories Stores 220,795 224,651 -1.7% Furniture, Home Furnishings, Electronics and Appliance Stores 220,692 230,016 -4.1% Furniture and Home Furnishing Stores 109,180 118,657 -8.0% Electronics and Appliance Stores 111,512 111,359 0.1% Sporting Goods, Hobby, Book and Music Stores 88,327 87,324 1.1% Miscellaneous Store Retailers 119,120 118,848 0.2% Nonstore Retailers 314,384 303,423 3.6% Food Services and Drinking Places 458,803 442,257 3.7% Source: US Census Bureau. All Values are expressed in millions of US dollars and are not seasonally adjusted 350 West Hubbard St. Ste 240, Chicago, Il. 60610 Tel: (312) 673-1254 Fax: (312) 822-9162 Website: www.jcwg.com For more info, please contact Jim Okamura at (312) 673-1254, John Archer at (416) 921-4181, or e-mail info@jcwg.com
- 3. Release Date: 14/01/09 NATIONAL RETAIL BULLETIN U.S. Consumer Confidence Index 120 110 100 90 80 70 60 50 40 30 Oct-04 Oct-05 Oct-06 Oct-07 Oct-08 Apr-04 Jul-04 Apr-05 Jul-05 Apr-06 Jul-06 Apr-07 Jul-07 Apr-08 Jul-08 Jan-04 Jan-05 Jan-06 Jan-07 Jan-08 Source: U.S. Conference Board U.S. Monthly Retail Sales by Major Category Percentage Change from Same Month, Previous Year Auto Food & Drug GAFO 15% 10% 5% 0% -5% -10% -15% -20% -25% -30% Oct-07 Oct-08 Jan-07 Mar-07 Nov-07 Mar-08 Nov-08 Jun-07 Jan-08 Jun-08 Jul-07 Jul-08 Dec-06 Feb-07 May-07 Dec-07 Feb-08 May-08 Apr-07 Aug-07 Sep-07 Apr-08 Aug-08 Sep-08 Source: U.S. Census Bureau 350 West Hubbard St. Ste 240, Chicago, Il. 60610 Tel: (312) 673-1254 Fax: (312) 822-9162 Website: www.jcwg.com For more info, please contact Jim Okamura at (312) 673-1254, John Archer at (416) 921-4181, or e-mail info@jcwg.com