SlideShare una empresa de Scribd logo
1 de 10
Descargar para leer sin conexión
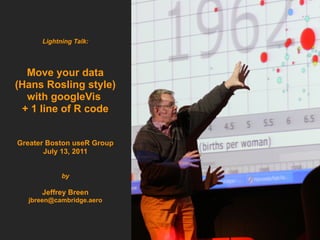
Lightning Talk:


  Move your data
(Hans Rosling style)
  with googleVis
 + 1 line of R code


Greater Boston useR Group
       July 13, 2011


            by

      Jeffrey Breen
  jbreen@cambridge.aero
Hans and TED and Gapminder and Google

 ●      Swedish polymath Hans Rosling gave an amazing
        presentation on economic development at the
        2006 TED Conference
           ●      http://www.ted.com/index.php/talks/hans_rosling_shows_the_best_stats_you_ve_ever_seen.html

 ●      Rosling's team at the Gapminder Foundation used
        animated bubble charts to visualize 50 years of
        global economic indicators
 ●      Google bought Gapminder's Trendalyzer software
        and development team in 2007 & incorporated
        “motion charts” into the Google Visualization API

Lightning Talk: googleVis + 1 line of code = motion charts   Greater Boston useR Meeting, July 2011            Slide 2
about the googleVis package

 ●      Written by Markus Gesmann & Diego de Castillo
 ●      Available on CRAN
 ●      Allows you to create a visualization with just one
        line of code
           ●      Automatically converts your data to JSON via
                  RJSONIO package
           ●      Writes all the JavaScript and HTML for you
 ●      Uses R's built-in help web server to preview
           ●      Overrides plot() function

Lightning Talk: googleVis + 1 line of code = motion charts   Greater Boston useR Meeting, July 2011   Slide 3
googleVis supports many visualizations

                   gvisAnnotatedTimeLine()                   Google Annotated Time Line with R
                   gvisAreaChart()                           Google Area Chart with R
                   gvisBarChart()                            Google Bar Chart with R
                   gvisColumnChart()                         Google Column Chart with R
                   gvisGauge()                               Google Gauge with R
                   gvisGeoMap()                              Google Geo Map with R
                   gvisIntensityMap()                        Google Intensity Map with R
                   gvisLineChart()                           Google Line Chart with R
                   gvisMap()                                 Google Maps with R
                   gvisMotionChart()                         Google Motion Chart with R
                   gvisOrgChart()                            Google Org Chart with R
                   gvisPieChart()                            Google Pie Chart with R
                   gvisScatterChart()                        Google Scatter Chart with R
                   gvisTable()                               Google Table Chart with R
                   gvisTreeMap()                             Google Tree Map with R
Lightning Talk: googleVis + 1 line of code = motion charts       Greater Boston useR Meeting, July 2011   Slide 4
googleVis gallery


Lightning Talk: googleVis + 1 line of code = motion charts   Greater Boston useR Meeting, July 2011   Slide 5
motion charts in one line

Load the library and some supplied (sample) data
> library(googleVis)
> data(Fruits)


Create the motion chart
> M = gvisMotionChart(data=Fruits, idvar="Fruit",
                      timevar="Date", chartid="ILoveFruit")


Lightning Talk: googleVis + 1 line of code = motion charts   Greater Boston useR Meeting, July 2011   Slide 6
viewing the results

Use plot() to
preview in browser
> plot(M)


Uses R's built-in web
server
           ●      Convenient
           ●      Overcomes Flash
                  security restriction
                  running from local
                  files

Lightning Talk: googleVis + 1 line of code = motion charts   Greater Boston useR Meeting, July 2011   Slide 7
one line of R = 165 lines of HTML + JavaScript
> print(M)                                                              [                                                                           data.addColumn('number','Profit');
                                                                          "Oranges",                                                                data.addRows(datajson);
<!DOCTYPE html PUBLIC "-//W3C//DTD XHTML 1.0 Strict//EN"                                                                                            return(data);
                                                                        new Date(2008,11,31),
      "http://www.w3.org/TR/xhtml1/DTD/xhtml1-strict.dtd">                                                                                          }
                                                                           2008,
<html xmlns="http://www.w3.org/1999/xhtml">
                                                                        "East",
<head>                                                                                                                                              // jsDrawChart
                                                                            96,
 <title>ILoveFruit</title>                                                                                                                          function drawChartILoveFruit() {
                                                                            81,
 <meta http-equiv="content-type" content="text/html;charset=utf-8" />                                                                                 var data = gvisDataILoveFruit()
                                                                            15
 <style type="text/css">                                                                                                                              var chart = new google.visualization.MotionChart(
                                                                        ],
   body {                                                                                                                                              document.getElementById('ILoveFruit')
                                                                        [
       color: #444444;                                                                                                                                );
                                                                          "Bananas",
       font-family: Arial,Helvetica,sans-serif;                                                                                                       var options ={};
                                                                        new Date(2008,11,31),
       font-size: 75%;                                                                                                                              options["width"] = 600;
                                                                           2008,
   }                                                                                                                                                options["height"] = 500;
                                                                        "East",
   a{                                                                                                                                                 chart.draw(data,options);
                                                                            85,
       color: #4D87C7;                                                                                                                              }
                                                                            76,
       text-decoration: none;
                                                                            9
   }                                                                                                                                                // jsDisplayChart
                                                                        ],
 </style>                                                                                                                                           function displayChartILoveFruit()
                                                                        [
</head>                                                                                                                                             {
                                                                          "Oranges",
<body>                                                                                                                                                google.load("visualization", "1", { packages:["motionchart"] });
                                                                        new Date(2009,11,31),
<!-- MotionChart generated in R 2.13.0 by googleVis 0.2.5 package -->                                                                                 google.setOnLoadCallback(drawChartILoveFruit);
                                                                           2009,
<!-- Wed Jul 13 14:56:33 2011 -->                                                                                                                   }
                                                                        "East",
                                                                            93,
                                                                            80,                                                                     // jsChart
<!-- jsHeader -->                                                                                                                                   displayChartILoveFruit()
                                                                            13
<script type="text/javascript" src="http://www.google.com/jsapi">
                                                                        ],
</script>                                                                                                                                           <!-- jsFooter -->
                                                                        [
<script type="text/javascript">                                                                                                                     //-->
                                                                          "Bananas",
                                                                        new Date(2009,11,31),                                                       </script>
// jsData
                                                                           2009,
function gvisDataILoveFruit ()                                                                                                                      <!-- divChart -->
                                                                        "East",
{                                                                                                                                                   <div id="ILoveFruit"
                                                                            94,
   var data = new google.visualization.DataTable();                                                                                                  style="width: 600px; height: 500px;">
                                                                            78,
   var datajson =                                                                                                                                   </div>
                                                                            16
[                                                                                                                                                    <div><span>Data: Fruits &#8226; Chart ID: <a
                                                                        ],
 [                                                                                                                                                  href="Chart_ILoveFruit.html">ILoveFruit</a></span><br />
                                                                        [
 "Apples",                                                                                                                                          <!-- htmlFooter -->
                                                                          "Oranges",
new Date(2008,11,31),                                                                                                                               <span>
                                                                        new Date(2010,11,31),
   2008,                                                                                                                                            R version 2.13.0 (2011-04-13) &#8226; <a
                                                                           2010,
"West",                                                                                                                                             href="http://code.google.com/p/google-motion-charts-with-r/">googleVis-
                                                                        "East",
     98,                                                                                                                                            0.2.5</a>
                                                                            98,
     78,                                                                                                                                            &#8226; <a href="http://code.google.com/apis/visualization/terms.html">Google
                                                                            91,
     20                                                                                                                                             Terms of Use</a>
                                                                            7
],                                                                                                                                                  </span></div>
                                                                        ],
[                                                                                                                                                   </body>
                                                                        [
 "Apples",                                                                                                                                          </html>
                                                                          "Bananas",
new Date(2009,11,31),
                                                                        new Date(2010,11,31),
   2009,
                                                                           2010,
"West",
                                                                        "East",
    111,
                                                                            81,
     79,
                                                                            71,
     32
                                                                            10
],
                                                                        ]
[
                                                                        ];
 "Apples",
                                                                        data.addColumn('string','Fruit');
new Date(2010,11,31),
                                                                        data.addColumn('date','Date');
   2010,
                                                                        data.addColumn('number','Year');
"West",
                                                                        data.addColumn('string','Location');
     89,
                                                                        data.addColumn('number','Sales');
     76,
                                                                        data.addColumn('number','Expenses');
     13
],


Lightning Talk: googleVis + 1 line of code = motion charts                                                     Greater Boston useR Meeting, July 2011                                                                               Slide 8
What? No airline example?


Lightning Talk: googleVis + 1 line of code = motion charts   Greater Boston useR Meeting, July 2011   Slide 9
blog post: 20 Years of the U.S. Domestic Airline
Market In 20 seconds
http://www.cambridge.aero/_blog/main/post/US_Domestic_Airline_Market_In_Motion_1990-2010/


Lightning Talk: googleVis + 1 line of code = motion charts   Greater Boston useR Meeting, July 2011   Slide 10

Más contenido relacionado

La actualidad más candente

Data manipulation on r
Data manipulation on rData manipulation on r
Data manipulation on rAbhik Seal
 
Data handling in r
Data handling in rData handling in r
Data handling in rAbhik Seal
 
Seminar PSU 09.04.2013 - 10.04.2013 MiFIT, Arbuzov Vyacheslav
Seminar PSU 09.04.2013 - 10.04.2013 MiFIT, Arbuzov VyacheslavSeminar PSU 09.04.2013 - 10.04.2013 MiFIT, Arbuzov Vyacheslav
Seminar PSU 09.04.2013 - 10.04.2013 MiFIT, Arbuzov VyacheslavVyacheslav Arbuzov
 
Data preparation covariates
Data preparation covariatesData preparation covariates
Data preparation covariatesFAO
 
Introduction to data.table in R
Introduction to data.table in RIntroduction to data.table in R
Introduction to data.table in RPaul Richards
 
Monad presentation scala as a category
Monad presentation   scala as a categoryMonad presentation   scala as a category
Monad presentation scala as a categorysamthemonad
 
R getting spatial
R getting spatialR getting spatial
R getting spatialFAO
 
Data preparation, depth function
Data preparation, depth functionData preparation, depth function
Data preparation, depth functionFAO
 
10. Getting Spatial
10. Getting Spatial10. Getting Spatial
10. Getting SpatialFAO
 
3 R Tutorial Data Structure
3 R Tutorial Data Structure3 R Tutorial Data Structure
3 R Tutorial Data StructureSakthi Dasans
 
Stata cheat sheet: data processing
Stata cheat sheet: data processingStata cheat sheet: data processing
Stata cheat sheet: data processingTim Essam
 
R Programming: Learn To Manipulate Strings In R
R Programming: Learn To Manipulate Strings In RR Programming: Learn To Manipulate Strings In R
R Programming: Learn To Manipulate Strings In RRsquared Academy
 
R Programming: Export/Output Data In R
R Programming: Export/Output Data In RR Programming: Export/Output Data In R
R Programming: Export/Output Data In RRsquared Academy
 
PPT ON MACHINE LEARNING by Ragini Ratre
PPT ON MACHINE LEARNING by Ragini RatrePPT ON MACHINE LEARNING by Ragini Ratre
PPT ON MACHINE LEARNING by Ragini RatreRaginiRatre
 
Understanding histogramppt.prn
Understanding histogramppt.prnUnderstanding histogramppt.prn
Understanding histogramppt.prnLeyi (Kamus) Zhang
 
5.3 mining sequential patterns
5.3 mining sequential patterns5.3 mining sequential patterns
5.3 mining sequential patternsKrish_ver2
 

La actualidad más candente (20)

Data manipulation on r
Data manipulation on rData manipulation on r
Data manipulation on r
 
R language introduction
R language introductionR language introduction
R language introduction
 
Data handling in r
Data handling in rData handling in r
Data handling in r
 
Seminar psu 20.10.2013
Seminar psu 20.10.2013Seminar psu 20.10.2013
Seminar psu 20.10.2013
 
Perm winter school 2014.01.31
Perm winter school 2014.01.31Perm winter school 2014.01.31
Perm winter school 2014.01.31
 
Seminar PSU 09.04.2013 - 10.04.2013 MiFIT, Arbuzov Vyacheslav
Seminar PSU 09.04.2013 - 10.04.2013 MiFIT, Arbuzov VyacheslavSeminar PSU 09.04.2013 - 10.04.2013 MiFIT, Arbuzov Vyacheslav
Seminar PSU 09.04.2013 - 10.04.2013 MiFIT, Arbuzov Vyacheslav
 
Data preparation covariates
Data preparation covariatesData preparation covariates
Data preparation covariates
 
Seminar PSU 10.10.2014 mme
Seminar PSU 10.10.2014 mmeSeminar PSU 10.10.2014 mme
Seminar PSU 10.10.2014 mme
 
Introduction to data.table in R
Introduction to data.table in RIntroduction to data.table in R
Introduction to data.table in R
 
Monad presentation scala as a category
Monad presentation   scala as a categoryMonad presentation   scala as a category
Monad presentation scala as a category
 
R getting spatial
R getting spatialR getting spatial
R getting spatial
 
Data preparation, depth function
Data preparation, depth functionData preparation, depth function
Data preparation, depth function
 
10. Getting Spatial
10. Getting Spatial10. Getting Spatial
10. Getting Spatial
 
3 R Tutorial Data Structure
3 R Tutorial Data Structure3 R Tutorial Data Structure
3 R Tutorial Data Structure
 
Stata cheat sheet: data processing
Stata cheat sheet: data processingStata cheat sheet: data processing
Stata cheat sheet: data processing
 
R Programming: Learn To Manipulate Strings In R
R Programming: Learn To Manipulate Strings In RR Programming: Learn To Manipulate Strings In R
R Programming: Learn To Manipulate Strings In R
 
R Programming: Export/Output Data In R
R Programming: Export/Output Data In RR Programming: Export/Output Data In R
R Programming: Export/Output Data In R
 
PPT ON MACHINE LEARNING by Ragini Ratre
PPT ON MACHINE LEARNING by Ragini RatrePPT ON MACHINE LEARNING by Ragini Ratre
PPT ON MACHINE LEARNING by Ragini Ratre
 
Understanding histogramppt.prn
Understanding histogramppt.prnUnderstanding histogramppt.prn
Understanding histogramppt.prn
 
5.3 mining sequential patterns
5.3 mining sequential patterns5.3 mining sequential patterns
5.3 mining sequential patterns
 

Destacado

Big Data Step-by-Step: Using R & Hadoop (with RHadoop's rmr package)
Big Data Step-by-Step: Using R & Hadoop (with RHadoop's rmr package)Big Data Step-by-Step: Using R & Hadoop (with RHadoop's rmr package)
Big Data Step-by-Step: Using R & Hadoop (with RHadoop's rmr package)Jeffrey Breen
 
Big Data Step-by-Step: Infrastructure 1/3: Local VM
Big Data Step-by-Step: Infrastructure 1/3: Local VMBig Data Step-by-Step: Infrastructure 1/3: Local VM
Big Data Step-by-Step: Infrastructure 1/3: Local VMJeffrey Breen
 
Big Data Step-by-Step: Infrastructure 2/3: Running R and RStudio on EC2
Big Data Step-by-Step: Infrastructure 2/3: Running R and RStudio on EC2Big Data Step-by-Step: Infrastructure 2/3: Running R and RStudio on EC2
Big Data Step-by-Step: Infrastructure 2/3: Running R and RStudio on EC2Jeffrey Breen
 
Tapping the Data Deluge with R
Tapping the Data Deluge with RTapping the Data Deluge with R
Tapping the Data Deluge with RJeffrey Breen
 
Big Data Step-by-Step: Infrastructure 3/3: Taking it to the cloud... easily.....
Big Data Step-by-Step: Infrastructure 3/3: Taking it to the cloud... easily.....Big Data Step-by-Step: Infrastructure 3/3: Taking it to the cloud... easily.....
Big Data Step-by-Step: Infrastructure 3/3: Taking it to the cloud... easily.....Jeffrey Breen
 

Destacado (6)

Using R with Hadoop
Using R with HadoopUsing R with Hadoop
Using R with Hadoop
 
Big Data Step-by-Step: Using R & Hadoop (with RHadoop's rmr package)
Big Data Step-by-Step: Using R & Hadoop (with RHadoop's rmr package)Big Data Step-by-Step: Using R & Hadoop (with RHadoop's rmr package)
Big Data Step-by-Step: Using R & Hadoop (with RHadoop's rmr package)
 
Big Data Step-by-Step: Infrastructure 1/3: Local VM
Big Data Step-by-Step: Infrastructure 1/3: Local VMBig Data Step-by-Step: Infrastructure 1/3: Local VM
Big Data Step-by-Step: Infrastructure 1/3: Local VM
 
Big Data Step-by-Step: Infrastructure 2/3: Running R and RStudio on EC2
Big Data Step-by-Step: Infrastructure 2/3: Running R and RStudio on EC2Big Data Step-by-Step: Infrastructure 2/3: Running R and RStudio on EC2
Big Data Step-by-Step: Infrastructure 2/3: Running R and RStudio on EC2
 
Tapping the Data Deluge with R
Tapping the Data Deluge with RTapping the Data Deluge with R
Tapping the Data Deluge with R
 
Big Data Step-by-Step: Infrastructure 3/3: Taking it to the cloud... easily.....
Big Data Step-by-Step: Infrastructure 3/3: Taking it to the cloud... easily.....Big Data Step-by-Step: Infrastructure 3/3: Taking it to the cloud... easily.....
Big Data Step-by-Step: Infrastructure 3/3: Taking it to the cloud... easily.....
 

Similar a Move Data with GoogleVis

Google Chart Tools Kanika Garg (10BM60035) Lavanya R. (10BM60042)
Google Chart Tools Kanika Garg (10BM60035) Lavanya R. (10BM60042)Google Chart Tools Kanika Garg (10BM60035) Lavanya R. (10BM60042)
Google Chart Tools Kanika Garg (10BM60035) Lavanya R. (10BM60042)Kanika Garg
 
Google Chart Tools
Google Chart Tools Google Chart Tools
Google Chart Tools Kanika Garg
 
Data visualization in python/Django
Data visualization in python/DjangoData visualization in python/Django
Data visualization in python/Djangokenluck2001
 
Dynamic Data Visualization With Chartkick
Dynamic Data Visualization With ChartkickDynamic Data Visualization With Chartkick
Dynamic Data Visualization With ChartkickDax Murray
 
After max+phonegap
After max+phonegapAfter max+phonegap
After max+phonegapyangdj
 
混搭移动开发:PhoneGap+JQurey+Dreamweaver
混搭移动开发:PhoneGap+JQurey+Dreamweaver混搭移动开发:PhoneGap+JQurey+Dreamweaver
混搭移动开发:PhoneGap+JQurey+Dreamweaveryangdj
 
Html5 and web technology update
Html5 and web technology updateHtml5 and web technology update
Html5 and web technology updateDoug Domeny
 
SVCC 2013 D3.js Presentation (10/05/2013)
SVCC 2013 D3.js Presentation (10/05/2013)SVCC 2013 D3.js Presentation (10/05/2013)
SVCC 2013 D3.js Presentation (10/05/2013)Oswald Campesato
 
Big Data for each one of us
Big Data for each one of usBig Data for each one of us
Big Data for each one of usOSCON Byrum
 
Strata Conference + Hadoop World San Jose 2015: Data Discovery on Hadoop
Strata Conference + Hadoop World San Jose 2015: Data Discovery on Hadoop Strata Conference + Hadoop World San Jose 2015: Data Discovery on Hadoop
Strata Conference + Hadoop World San Jose 2015: Data Discovery on Hadoop Sumeet Singh
 
The Ring programming language version 1.9 book - Part 54 of 210
The Ring programming language version 1.9 book - Part 54 of 210The Ring programming language version 1.9 book - Part 54 of 210
The Ring programming language version 1.9 book - Part 54 of 210Mahmoud Samir Fayed
 
mobl presentation @ IHomer
mobl presentation @ IHomermobl presentation @ IHomer
mobl presentation @ IHomerzefhemel
 
SharePoint Conference 2018 - APIs, APIs everywhere!
SharePoint Conference 2018 - APIs, APIs everywhere!SharePoint Conference 2018 - APIs, APIs everywhere!
SharePoint Conference 2018 - APIs, APIs everywhere!Sébastien Levert
 

Similar a Move Data with GoogleVis (20)

Google Chart Tools Kanika Garg (10BM60035) Lavanya R. (10BM60042)
Google Chart Tools Kanika Garg (10BM60035) Lavanya R. (10BM60042)Google Chart Tools Kanika Garg (10BM60035) Lavanya R. (10BM60042)
Google Chart Tools Kanika Garg (10BM60035) Lavanya R. (10BM60042)
 
Google Chart Tools
Google Chart Tools Google Chart Tools
Google Chart Tools
 
Googlevis examples
Googlevis examplesGooglevis examples
Googlevis examples
 
Data visualization in python/Django
Data visualization in python/DjangoData visualization in python/Django
Data visualization in python/Django
 
Dynamic Data Visualization With Chartkick
Dynamic Data Visualization With ChartkickDynamic Data Visualization With Chartkick
Dynamic Data Visualization With Chartkick
 
Google charts
Google chartsGoogle charts
Google charts
 
After max+phonegap
After max+phonegapAfter max+phonegap
After max+phonegap
 
混搭移动开发:PhoneGap+JQurey+Dreamweaver
混搭移动开发:PhoneGap+JQurey+Dreamweaver混搭移动开发:PhoneGap+JQurey+Dreamweaver
混搭移动开发:PhoneGap+JQurey+Dreamweaver
 
Html5 and web technology update
Html5 and web technology updateHtml5 and web technology update
Html5 and web technology update
 
Svcc 2013-d3
Svcc 2013-d3Svcc 2013-d3
Svcc 2013-d3
 
SVCC 2013 D3.js Presentation (10/05/2013)
SVCC 2013 D3.js Presentation (10/05/2013)SVCC 2013 D3.js Presentation (10/05/2013)
SVCC 2013 D3.js Presentation (10/05/2013)
 
Big Data for each one of us
Big Data for each one of usBig Data for each one of us
Big Data for each one of us
 
Html5 For Jjugccc2009fall
Html5 For Jjugccc2009fallHtml5 For Jjugccc2009fall
Html5 For Jjugccc2009fall
 
JQuery Flot
JQuery FlotJQuery Flot
JQuery Flot
 
Html5 Overview
Html5 OverviewHtml5 Overview
Html5 Overview
 
Strata Conference + Hadoop World San Jose 2015: Data Discovery on Hadoop
Strata Conference + Hadoop World San Jose 2015: Data Discovery on Hadoop Strata Conference + Hadoop World San Jose 2015: Data Discovery on Hadoop
Strata Conference + Hadoop World San Jose 2015: Data Discovery on Hadoop
 
Data Science on Google Cloud Platform
Data Science on Google Cloud PlatformData Science on Google Cloud Platform
Data Science on Google Cloud Platform
 
The Ring programming language version 1.9 book - Part 54 of 210
The Ring programming language version 1.9 book - Part 54 of 210The Ring programming language version 1.9 book - Part 54 of 210
The Ring programming language version 1.9 book - Part 54 of 210
 
mobl presentation @ IHomer
mobl presentation @ IHomermobl presentation @ IHomer
mobl presentation @ IHomer
 
SharePoint Conference 2018 - APIs, APIs everywhere!
SharePoint Conference 2018 - APIs, APIs everywhere!SharePoint Conference 2018 - APIs, APIs everywhere!
SharePoint Conference 2018 - APIs, APIs everywhere!
 

Más de Jeffrey Breen

Getting started with R & Hadoop
Getting started with R & HadoopGetting started with R & Hadoop
Getting started with R & HadoopJeffrey Breen
 
R by example: mining Twitter for consumer attitudes towards airlines
R by example: mining Twitter for consumer attitudes towards airlinesR by example: mining Twitter for consumer attitudes towards airlines
R by example: mining Twitter for consumer attitudes towards airlinesJeffrey Breen
 
Accessing Databases from R
Accessing Databases from RAccessing Databases from R
Accessing Databases from RJeffrey Breen
 
R + 15 minutes = Hadoop cluster
R + 15 minutes = Hadoop clusterR + 15 minutes = Hadoop cluster
R + 15 minutes = Hadoop clusterJeffrey Breen
 
FAA Aviation Forecasts 2011-2031 overview
FAA Aviation Forecasts 2011-2031 overviewFAA Aviation Forecasts 2011-2031 overview
FAA Aviation Forecasts 2011-2031 overviewJeffrey Breen
 

Más de Jeffrey Breen (6)

Getting started with R & Hadoop
Getting started with R & HadoopGetting started with R & Hadoop
Getting started with R & Hadoop
 
R by example: mining Twitter for consumer attitudes towards airlines
R by example: mining Twitter for consumer attitudes towards airlinesR by example: mining Twitter for consumer attitudes towards airlines
R by example: mining Twitter for consumer attitudes towards airlines
 
Accessing Databases from R
Accessing Databases from RAccessing Databases from R
Accessing Databases from R
 
Reshaping Data in R
Reshaping Data in RReshaping Data in R
Reshaping Data in R
 
R + 15 minutes = Hadoop cluster
R + 15 minutes = Hadoop clusterR + 15 minutes = Hadoop cluster
R + 15 minutes = Hadoop cluster
 
FAA Aviation Forecasts 2011-2031 overview
FAA Aviation Forecasts 2011-2031 overviewFAA Aviation Forecasts 2011-2031 overview
FAA Aviation Forecasts 2011-2031 overview
 

Último

From Family Reminiscence to Scholarly Archive .
From Family Reminiscence to Scholarly Archive .From Family Reminiscence to Scholarly Archive .
From Family Reminiscence to Scholarly Archive .Alan Dix
 
DevEX - reference for building teams, processes, and platforms
DevEX - reference for building teams, processes, and platformsDevEX - reference for building teams, processes, and platforms
DevEX - reference for building teams, processes, and platformsSergiu Bodiu
 
Leverage Zilliz Serverless - Up to 50X Saving for Your Vector Storage Cost
Leverage Zilliz Serverless - Up to 50X Saving for Your Vector Storage CostLeverage Zilliz Serverless - Up to 50X Saving for Your Vector Storage Cost
Leverage Zilliz Serverless - Up to 50X Saving for Your Vector Storage CostZilliz
 
New from BookNet Canada for 2024: BNC CataList - Tech Forum 2024
New from BookNet Canada for 2024: BNC CataList - Tech Forum 2024New from BookNet Canada for 2024: BNC CataList - Tech Forum 2024
New from BookNet Canada for 2024: BNC CataList - Tech Forum 2024BookNet Canada
 
Tampa BSides - Chef's Tour of Microsoft Security Adoption Framework (SAF)
Tampa BSides - Chef's Tour of Microsoft Security Adoption Framework (SAF)Tampa BSides - Chef's Tour of Microsoft Security Adoption Framework (SAF)
Tampa BSides - Chef's Tour of Microsoft Security Adoption Framework (SAF)Mark Simos
 
Advanced Test Driven-Development @ php[tek] 2024
Advanced Test Driven-Development @ php[tek] 2024Advanced Test Driven-Development @ php[tek] 2024
Advanced Test Driven-Development @ php[tek] 2024Scott Keck-Warren
 
Are Multi-Cloud and Serverless Good or Bad?
Are Multi-Cloud and Serverless Good or Bad?Are Multi-Cloud and Serverless Good or Bad?
Are Multi-Cloud and Serverless Good or Bad?Mattias Andersson
 
Human Factors of XR: Using Human Factors to Design XR Systems
Human Factors of XR: Using Human Factors to Design XR SystemsHuman Factors of XR: Using Human Factors to Design XR Systems
Human Factors of XR: Using Human Factors to Design XR SystemsMark Billinghurst
 
TrustArc Webinar - How to Build Consumer Trust Through Data Privacy
TrustArc Webinar - How to Build Consumer Trust Through Data PrivacyTrustArc Webinar - How to Build Consumer Trust Through Data Privacy
TrustArc Webinar - How to Build Consumer Trust Through Data PrivacyTrustArc
 
Take control of your SAP testing with UiPath Test Suite
Take control of your SAP testing with UiPath Test SuiteTake control of your SAP testing with UiPath Test Suite
Take control of your SAP testing with UiPath Test SuiteDianaGray10
 
Advanced Computer Architecture – An Introduction
Advanced Computer Architecture – An IntroductionAdvanced Computer Architecture – An Introduction
Advanced Computer Architecture – An IntroductionDilum Bandara
 
Vertex AI Gemini Prompt Engineering Tips
Vertex AI Gemini Prompt Engineering TipsVertex AI Gemini Prompt Engineering Tips
Vertex AI Gemini Prompt Engineering TipsMiki Katsuragi
 
Commit 2024 - Secret Management made easy
Commit 2024 - Secret Management made easyCommit 2024 - Secret Management made easy
Commit 2024 - Secret Management made easyAlfredo García Lavilla
 
Dev Dives: Streamline document processing with UiPath Studio Web
Dev Dives: Streamline document processing with UiPath Studio WebDev Dives: Streamline document processing with UiPath Studio Web
Dev Dives: Streamline document processing with UiPath Studio WebUiPathCommunity
 
Unraveling Multimodality with Large Language Models.pdf
Unraveling Multimodality with Large Language Models.pdfUnraveling Multimodality with Large Language Models.pdf
Unraveling Multimodality with Large Language Models.pdfAlex Barbosa Coqueiro
 
"Debugging python applications inside k8s environment", Andrii Soldatenko
"Debugging python applications inside k8s environment", Andrii Soldatenko"Debugging python applications inside k8s environment", Andrii Soldatenko
"Debugging python applications inside k8s environment", Andrii SoldatenkoFwdays
 
H2O.ai CEO/Founder: Sri Ambati Keynote at Wells Fargo Day
H2O.ai CEO/Founder: Sri Ambati Keynote at Wells Fargo DayH2O.ai CEO/Founder: Sri Ambati Keynote at Wells Fargo Day
H2O.ai CEO/Founder: Sri Ambati Keynote at Wells Fargo DaySri Ambati
 
Anypoint Exchange: It’s Not Just a Repo!
Anypoint Exchange: It’s Not Just a Repo!Anypoint Exchange: It’s Not Just a Repo!
Anypoint Exchange: It’s Not Just a Repo!Manik S Magar
 
Ensuring Technical Readiness For Copilot in Microsoft 365
Ensuring Technical Readiness For Copilot in Microsoft 365Ensuring Technical Readiness For Copilot in Microsoft 365
Ensuring Technical Readiness For Copilot in Microsoft 3652toLead Limited
 

Último (20)

From Family Reminiscence to Scholarly Archive .
From Family Reminiscence to Scholarly Archive .From Family Reminiscence to Scholarly Archive .
From Family Reminiscence to Scholarly Archive .
 
DevEX - reference for building teams, processes, and platforms
DevEX - reference for building teams, processes, and platformsDevEX - reference for building teams, processes, and platforms
DevEX - reference for building teams, processes, and platforms
 
Leverage Zilliz Serverless - Up to 50X Saving for Your Vector Storage Cost
Leverage Zilliz Serverless - Up to 50X Saving for Your Vector Storage CostLeverage Zilliz Serverless - Up to 50X Saving for Your Vector Storage Cost
Leverage Zilliz Serverless - Up to 50X Saving for Your Vector Storage Cost
 
New from BookNet Canada for 2024: BNC CataList - Tech Forum 2024
New from BookNet Canada for 2024: BNC CataList - Tech Forum 2024New from BookNet Canada for 2024: BNC CataList - Tech Forum 2024
New from BookNet Canada for 2024: BNC CataList - Tech Forum 2024
 
Tampa BSides - Chef's Tour of Microsoft Security Adoption Framework (SAF)
Tampa BSides - Chef's Tour of Microsoft Security Adoption Framework (SAF)Tampa BSides - Chef's Tour of Microsoft Security Adoption Framework (SAF)
Tampa BSides - Chef's Tour of Microsoft Security Adoption Framework (SAF)
 
Advanced Test Driven-Development @ php[tek] 2024
Advanced Test Driven-Development @ php[tek] 2024Advanced Test Driven-Development @ php[tek] 2024
Advanced Test Driven-Development @ php[tek] 2024
 
Are Multi-Cloud and Serverless Good or Bad?
Are Multi-Cloud and Serverless Good or Bad?Are Multi-Cloud and Serverless Good or Bad?
Are Multi-Cloud and Serverless Good or Bad?
 
Human Factors of XR: Using Human Factors to Design XR Systems
Human Factors of XR: Using Human Factors to Design XR SystemsHuman Factors of XR: Using Human Factors to Design XR Systems
Human Factors of XR: Using Human Factors to Design XR Systems
 
TrustArc Webinar - How to Build Consumer Trust Through Data Privacy
TrustArc Webinar - How to Build Consumer Trust Through Data PrivacyTrustArc Webinar - How to Build Consumer Trust Through Data Privacy
TrustArc Webinar - How to Build Consumer Trust Through Data Privacy
 
Take control of your SAP testing with UiPath Test Suite
Take control of your SAP testing with UiPath Test SuiteTake control of your SAP testing with UiPath Test Suite
Take control of your SAP testing with UiPath Test Suite
 
Advanced Computer Architecture – An Introduction
Advanced Computer Architecture – An IntroductionAdvanced Computer Architecture – An Introduction
Advanced Computer Architecture – An Introduction
 
Vertex AI Gemini Prompt Engineering Tips
Vertex AI Gemini Prompt Engineering TipsVertex AI Gemini Prompt Engineering Tips
Vertex AI Gemini Prompt Engineering Tips
 
Commit 2024 - Secret Management made easy
Commit 2024 - Secret Management made easyCommit 2024 - Secret Management made easy
Commit 2024 - Secret Management made easy
 
Dev Dives: Streamline document processing with UiPath Studio Web
Dev Dives: Streamline document processing with UiPath Studio WebDev Dives: Streamline document processing with UiPath Studio Web
Dev Dives: Streamline document processing with UiPath Studio Web
 
Unraveling Multimodality with Large Language Models.pdf
Unraveling Multimodality with Large Language Models.pdfUnraveling Multimodality with Large Language Models.pdf
Unraveling Multimodality with Large Language Models.pdf
 
"Debugging python applications inside k8s environment", Andrii Soldatenko
"Debugging python applications inside k8s environment", Andrii Soldatenko"Debugging python applications inside k8s environment", Andrii Soldatenko
"Debugging python applications inside k8s environment", Andrii Soldatenko
 
H2O.ai CEO/Founder: Sri Ambati Keynote at Wells Fargo Day
H2O.ai CEO/Founder: Sri Ambati Keynote at Wells Fargo DayH2O.ai CEO/Founder: Sri Ambati Keynote at Wells Fargo Day
H2O.ai CEO/Founder: Sri Ambati Keynote at Wells Fargo Day
 
Anypoint Exchange: It’s Not Just a Repo!
Anypoint Exchange: It’s Not Just a Repo!Anypoint Exchange: It’s Not Just a Repo!
Anypoint Exchange: It’s Not Just a Repo!
 
DMCC Future of Trade Web3 - Special Edition
DMCC Future of Trade Web3 - Special EditionDMCC Future of Trade Web3 - Special Edition
DMCC Future of Trade Web3 - Special Edition
 
Ensuring Technical Readiness For Copilot in Microsoft 365
Ensuring Technical Readiness For Copilot in Microsoft 365Ensuring Technical Readiness For Copilot in Microsoft 365
Ensuring Technical Readiness For Copilot in Microsoft 365
 

Move Data with GoogleVis

  • 1. Lightning Talk: Move your data (Hans Rosling style) with googleVis + 1 line of R code Greater Boston useR Group July 13, 2011 by Jeffrey Breen jbreen@cambridge.aero
  • 2. Hans and TED and Gapminder and Google ● Swedish polymath Hans Rosling gave an amazing presentation on economic development at the 2006 TED Conference ● http://www.ted.com/index.php/talks/hans_rosling_shows_the_best_stats_you_ve_ever_seen.html ● Rosling's team at the Gapminder Foundation used animated bubble charts to visualize 50 years of global economic indicators ● Google bought Gapminder's Trendalyzer software and development team in 2007 & incorporated “motion charts” into the Google Visualization API Lightning Talk: googleVis + 1 line of code = motion charts Greater Boston useR Meeting, July 2011 Slide 2
  • 3. about the googleVis package ● Written by Markus Gesmann & Diego de Castillo ● Available on CRAN ● Allows you to create a visualization with just one line of code ● Automatically converts your data to JSON via RJSONIO package ● Writes all the JavaScript and HTML for you ● Uses R's built-in help web server to preview ● Overrides plot() function Lightning Talk: googleVis + 1 line of code = motion charts Greater Boston useR Meeting, July 2011 Slide 3
  • 4. googleVis supports many visualizations gvisAnnotatedTimeLine() Google Annotated Time Line with R gvisAreaChart() Google Area Chart with R gvisBarChart() Google Bar Chart with R gvisColumnChart() Google Column Chart with R gvisGauge() Google Gauge with R gvisGeoMap() Google Geo Map with R gvisIntensityMap() Google Intensity Map with R gvisLineChart() Google Line Chart with R gvisMap() Google Maps with R gvisMotionChart() Google Motion Chart with R gvisOrgChart() Google Org Chart with R gvisPieChart() Google Pie Chart with R gvisScatterChart() Google Scatter Chart with R gvisTable() Google Table Chart with R gvisTreeMap() Google Tree Map with R Lightning Talk: googleVis + 1 line of code = motion charts Greater Boston useR Meeting, July 2011 Slide 4
  • 5. googleVis gallery Lightning Talk: googleVis + 1 line of code = motion charts Greater Boston useR Meeting, July 2011 Slide 5
  • 6. motion charts in one line Load the library and some supplied (sample) data > library(googleVis) > data(Fruits) Create the motion chart > M = gvisMotionChart(data=Fruits, idvar="Fruit", timevar="Date", chartid="ILoveFruit") Lightning Talk: googleVis + 1 line of code = motion charts Greater Boston useR Meeting, July 2011 Slide 6
  • 7. viewing the results Use plot() to preview in browser > plot(M) Uses R's built-in web server ● Convenient ● Overcomes Flash security restriction running from local files Lightning Talk: googleVis + 1 line of code = motion charts Greater Boston useR Meeting, July 2011 Slide 7
  • 8. one line of R = 165 lines of HTML + JavaScript > print(M) [ data.addColumn('number','Profit'); "Oranges", data.addRows(datajson); <!DOCTYPE html PUBLIC "-//W3C//DTD XHTML 1.0 Strict//EN" return(data); new Date(2008,11,31), "http://www.w3.org/TR/xhtml1/DTD/xhtml1-strict.dtd"> } 2008, <html xmlns="http://www.w3.org/1999/xhtml"> "East", <head> // jsDrawChart 96, <title>ILoveFruit</title> function drawChartILoveFruit() { 81, <meta http-equiv="content-type" content="text/html;charset=utf-8" /> var data = gvisDataILoveFruit() 15 <style type="text/css"> var chart = new google.visualization.MotionChart( ], body { document.getElementById('ILoveFruit') [ color: #444444; ); "Bananas", font-family: Arial,Helvetica,sans-serif; var options ={}; new Date(2008,11,31), font-size: 75%; options["width"] = 600; 2008, } options["height"] = 500; "East", a{ chart.draw(data,options); 85, color: #4D87C7; } 76, text-decoration: none; 9 } // jsDisplayChart ], </style> function displayChartILoveFruit() [ </head> { "Oranges", <body> google.load("visualization", "1", { packages:["motionchart"] }); new Date(2009,11,31), <!-- MotionChart generated in R 2.13.0 by googleVis 0.2.5 package --> google.setOnLoadCallback(drawChartILoveFruit); 2009, <!-- Wed Jul 13 14:56:33 2011 --> } "East", 93, 80, // jsChart <!-- jsHeader --> displayChartILoveFruit() 13 <script type="text/javascript" src="http://www.google.com/jsapi"> ], </script> <!-- jsFooter --> [ <script type="text/javascript"> //--> "Bananas", new Date(2009,11,31), </script> // jsData 2009, function gvisDataILoveFruit () <!-- divChart --> "East", { <div id="ILoveFruit" 94, var data = new google.visualization.DataTable(); style="width: 600px; height: 500px;"> 78, var datajson = </div> 16 [ <div><span>Data: Fruits &#8226; Chart ID: <a ], [ href="Chart_ILoveFruit.html">ILoveFruit</a></span><br /> [ "Apples", <!-- htmlFooter --> "Oranges", new Date(2008,11,31), <span> new Date(2010,11,31), 2008, R version 2.13.0 (2011-04-13) &#8226; <a 2010, "West", href="http://code.google.com/p/google-motion-charts-with-r/">googleVis- "East", 98, 0.2.5</a> 98, 78, &#8226; <a href="http://code.google.com/apis/visualization/terms.html">Google 91, 20 Terms of Use</a> 7 ], </span></div> ], [ </body> [ "Apples", </html> "Bananas", new Date(2009,11,31), new Date(2010,11,31), 2009, 2010, "West", "East", 111, 81, 79, 71, 32 10 ], ] [ ]; "Apples", data.addColumn('string','Fruit'); new Date(2010,11,31), data.addColumn('date','Date'); 2010, data.addColumn('number','Year'); "West", data.addColumn('string','Location'); 89, data.addColumn('number','Sales'); 76, data.addColumn('number','Expenses'); 13 ], Lightning Talk: googleVis + 1 line of code = motion charts Greater Boston useR Meeting, July 2011 Slide 8
  • 9. What? No airline example? Lightning Talk: googleVis + 1 line of code = motion charts Greater Boston useR Meeting, July 2011 Slide 9
  • 10. blog post: 20 Years of the U.S. Domestic Airline Market In 20 seconds http://www.cambridge.aero/_blog/main/post/US_Domestic_Airline_Market_In_Motion_1990-2010/ Lightning Talk: googleVis + 1 line of code = motion charts Greater Boston useR Meeting, July 2011 Slide 10