

Recomendados
Más contenido relacionado
Último
Último (16)
Destacado
Destacado (20)
Census2011 (1)
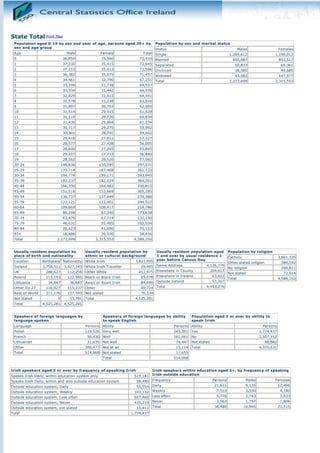
- 1. State Total Print Map Population aged 0-19 by sex and year of age, persons aged 20+ by Population by sex and marital status sex and age group Status Males Females Age Male Female Total Single 1,285,612 1,199,013 0 36,850 35,560 72,410 Married 855,087 853,517 1 37,230 35,415 72,645 Separated 50,833 65,361 2 37,153 35,413 72,566 Divorced 38,085 49,685 3 36,382 35,075 71,457 Widowed 43,082 147,977 4 34,461 32,790 67,251 Total 2,272,699 2,315,553 5 33,199 31,738 64,937 6 33,534 31,442 64,976 7 32,829 31,612 64,441 8 32,578 31,238 63,816 9 31,897 30,703 62,600 10 31,514 29,915 61,429 11 31,114 29,720 60,834 12 31,430 29,804 61,234 13 30,717 29,275 59,992 14 30,301 28,701 59,002 15 29,416 27,811 57,227 16 28,577 27,428 56,005 17 28,600 27,265 55,865 18 29,107 27,733 56,840 19 28,562 28,520 57,082 20-24 146,636 150,595 297,231 25-29 173,714 187,408 361,122 30-34 194,774 199,171 393,945 35-39 182,237 182,024 364,261 40-44 166,330 164,482 330,812 45-49 151,516 153,669 305,185 50-54 136,737 137,649 274,386 55-59 122,121 122,401 244,522 60-64 109,869 108,917 218,786 65-69 86,298 87,340 173,638 70-74 63,476 67,714 131,190 75-79 46,631 55,405 102,036 80-84 28,423 41,690 70,113 85+ 18,486 39,930 58,416 Total 2,272,699 2,315,553 4,588,252 Usually resident population by Usually resident population by Usually resident population aged Population by religion place of birth and nationality ethnic or cultural background 1 and over by usual residence 1 Catholic 3,861,335 Location Birthplace Nationality White Irish 3,821,995 year before Census Day Other stated religion 384,192 Ireland 3,758,511 3,927,143 White Irish Traveller 29,495 Same Address 4,126,770 No religion 269,811 UK 288,627 112,259 Other White 412,975 Elsewhere in County 209,617 Not stated 72,914 Poland 115,193 122,585 Black or Black Irish 65,078 Elsewhere in Ireland 63,622 Total 4,588,252 Lithuania 34,847 36,683 Asian or Asian Irish 84,690 Outside Ireland 53,267 Other EU 27 116,927 115,237 Other 40,724 Total 4,453,276 Rest of World 211,176 157,593 Not stated 70,324 Not stated 0 53,781 Total 4,525,281 Total 4,525,281 4,525,281 Speakers of foreign languages by Speakers of foreign languages by ability Population aged 3 or over by ability to language spoken to speak English speak Irish Language Persons Ability Persons Ability Persons Polish 119,526 Very well 245,391 Yes 1,774,437 French 56,430 Well 161,461 No 2,507,312 Lithuanian 31,635 Not well 74,447 Not stated 88,882 Other 306,477 Not at all 15,114 Total 4,370,631 Total 514,068 Not stated 17,655 Total 514,068 Irish speakers aged 3 or over by frequency of speaking Irish Irish speakers within education aged 3+, by frequency of speaking Speaks Irish Daily, within education system only 519,181 Irish outside education Speaks Irish Daily, within and also outside education system 38,480 Frequency Persons Males Females Outside education system, Daily 55,554 Daily 21,631 9,135 12,496 Outside education system, Weekly 103,132 Weekly 7,510 3,330 4,180 Outside education system, Less often 607,460 Less often 5,776 2,743 3,033 Outside education system, Never 435,219 Never 3,563 1,757 1,806 Outside education system, not stated 15,411 Total 38,480 16,965 21,515 Total 1,774,437
- 2. Families,family members and children in Family units with children by size and Family units with children by type of family and families, by size of family age of children age of children Number of Number of All Children Lone Lone Size of Number of All Couples persons in children in children both mothers fathers family families children Total with families families 15 or under and with with under 15 children 2 over over 15 children children 469,709 939,418 124,765 persons No Number of families 0 0 0 344,944 3 children All children aged 273,416 820,248 332,001 315,974 83,476 6,136 persons 1 child 161,584 178,012 0 339,596 under fifteen 4 2 All children aged over 249,343 997,372 520,662 151,941 92,826 41,185 285,952 207,216 81,206 20,753 persons children fifteen 5 3 Other 95,761 21,602 2,142 129,561 647,805 395,750 68,557 30,010 45,903 144,470 persons children Total number of 618,951 186,284 29,031 6 or 4 family units 18,903 6,733 21,966 47,602 more 57,181 364,237 252,797 children Number of children persons 5 or All children aged Total 1,179,210 3,769,080 1,625,975 more 4,601 1,594 10,451 16,646 632,609 129,347 9,186 under fifteen children All children aged over 345,600 114,895 28,526 fifteen Other 295,770 63,867 6,175 Total number of 1,273,979 308,109 43,887 family units Families by age of youngest child Families by family cycle Females aged 20 years or over by Number of Number of family Number of Number of family number of children born alive Family cycle families members families members Number of children born Number of females 0-4 Pre-family 131,877 263,754 0 526,960 266,141 1,036,743 years Empty nest 118,939 237,878 1 214,486 5-9 Retired 94,128 188,256 2 328,666 139,761 562,076 years Pre-school 141,320 446,974 3 254,957 10-14 119,189 474,961 Early school 133,003 511,725 4 or more 306,077 years 15-19 Pre- Total 1,631,146 104,025 385,352 131,263 534,003 years Adolescent 20+ Adolescent 135,218 550,311 205,150 620,060 years Adult 293,462 1,036,179 Total 834,266 3,079,192 Total 1,179,210 3,769,080 Private households by type Private households by size Private households by type of Type of Household Households Persons Size of family Households Persons accommodation One person 392,000 392,000 1 person 392,000 392,000 Type of accommodation Households Persons Husband and wife 240,146 480,292 2 persons 479,271 958,542 House/Bungalow 1,438,345 4,079,628 Cohabiting couple 73,111 146,222 3 persons 296,010 888,030 Flat/Apartment 177,587 342,350 Husband, wife and 4 persons 268,136 1,072,544 Bed-sit 5,695 8,005 522,959 2,147,067 children 5 persons 145,102 725,510 Caravan/Mobile Home 4,800 9,840 Cohabiting couple and 6 persons 52,775 316,650 Not stated 27,781 70,586 54,911 206,327 children Total 1,654,208 4,510,409 7 persons 14,174 99,218 Father and children 24,497 62,014 8 or more persons 6,740 57,915 Mother and children 155,264 420,011 Total 1,654,208 4,510,409 Couple and others 21,697 72,760 Couple, children and 30,459 156,514 others Father, children and 2,986 10,885 others Mother, children and 15,190 56,134 others Two or more family units 18,769 100,938 Non-family households 39,611 92,664 and relations Two or more non-related 62,608 166,581 persons Total 1,654,208 4,510,409 Permanent private households by year Permanent private households by type of Permanent private households by built occupancy number of rooms Year Built Households Persons Type of occupancy Households Persons Number of rooms Households Persons Pre 1919 149,939 340,515 Owner occupied with 1 room 23,058 33,389 583,148 1,888,826 1919 to 1945 114,817 265,699 mortgage 2 rooms 78,373 138,552 1946 to 1960 127,691 311,298 Owner occupied no 566,776 1,346,590 3 rooms 156,731 350,764 mortgage 1961 to 1970 114,510 285,906 4 rooms 174,296 390,118 Rented from Private 1971 to 1980 214,197 578,111 305,377 770,375 5 rooms 380,115 993,136 Landlord 1981 to 1990 172,413 509,817 Rented from Local 6 rooms 299,646 847,801 129,033 354,992 1991 to 2000 238,724 749,913 Authority 7 rooms 223,835 708,587 2001 to 2005 266,110 784,606 Rented from Voluntary 8 or more rooms 247,026 879,085 14,942 34,340 2006 or later 171,397 465,963 Body Not stated 66,328 159,137 Not stated 79,610 208,741 Occupied free of rent 25,436 47,883 Total 1,649,408 4,500,569 Total 1,649,408 4,500,569 Not stated 24,696 57,563 Total 1,649,408 4,500,569
- 3. Permanent private households by central Permanent private households by water Permanent private households by heating supply sewerage facility No central heating 26,952 Public main 1,247,185 Public scheme 1,092,418 Oil 711,330 Group scheme with local authority Individual septic tank 437,652 144,428 Natural Gas 550,215 source Other individual treatment 50,259 Electricity 140,419 Group scheme with private source 45,774 Other 9,370 Coal (including anthracite) 79,145 Other private source 161,532 No sewerage facility 2,555 Peat (including turf) 78,638 None 2,080 Not stated 57,154 Liquid Petroleum Gas (LPG) 10,452 Not stated 48,409 Total 1,649,408 Wood (including wood pellets) 21,395 Total 1,649,408 Other 8,524 Not stated 22,338 Total 1,649,408 Occupancy status of permanent dwellings Persons in Communal Establishments Population aged 15 years and over by on Census night Number of establishments 4,035 principal economic status and sex Occupied 1,660,111 Number of persons 109,897 Principal Unoccupied 334,734 Economic Male Female Total Status Total 1,994,845 At work 954,541 852,819 1,807,360 Looking for first 19,512 14,654 34,166 regular job Unemployed having lost or 254,815 135,862 390,677 given up previous job Student 201,203 207,635 408,838 Looking after 18,040 321,878 339,918 home/family Retired 237,409 219,985 457,394 Unable to work due to permanent 79,502 77,491 156,993 sickness or disability Other 6,488 6,828 13,316 Total 1,771,510 1,837,152 3,608,662 Population by sex and social class Persons in private households by socio- Population aged 15 years and over by Social Class Male Female Total economic group of reference person age education ceased Professional Socio-economic group of Age Males Females Total 185,324 151,296 336,620 Households Persons workers reference person Under 15 years 130,481 109,427 239,908 Managerial and A Employers and 15 84,759 64,821 149,580 587,931 663,740 1,251,671 237,024 703,726 technical managers 16 145,418 115,624 261,042 Non-manual 306,771 494,533 801,304 B Higher professional 102,811 293,023 17 117,191 128,649 245,840 Skilled manual 457,137 250,232 707,369 C Lower professional 182,368 483,424 18 176,365 196,324 372,689 Semi-skilled 259,543 227,906 487,449 D Non-manual 291,033 767,654 19 54,576 73,505 128,081 Unskilled 95,437 74,577 170,014 E Manual skilled 157,362 460,193 20 52,448 62,479 114,927 All others F Semi-skilled 139,278 392,719 21 and over 302,009 339,845 641,854 gainfully G Unskilled 62,156 165,734 380,556 453,269 833,825 Not stated 410,236 439,333 849,569 occupied and H Own account workers 86,837 268,680 unknown Total 1,473,483 1,530,007 3,003,490 I Farmers 85,731 243,380 Total 2,272,699 2,315,553 4,588,252 J Agricultural workers 10,061 26,119 Z All others gainfully 299,547 705,757 occupied and unknown Total 1,654,208 4,510,409 Population aged 15 years and over whose Population aged 15 years and over by Population aged 15 years and over by sex and education has not ceased field of study highest level of education completed Education Males Females Total Qualification Males Females Total Education Level Males Females Total Still at school 201,203 207,635 408,838 Education and No Formal Education 23,086 19,301 42,387 24,209 88,229 112,438 Other 96,824 99,510 196,334 teacher training Primary Education 216,530 197,979 414,509 Arts 24,969 31,206 56,175 Lower Secondary 268,192 231,297 499,489 Humanities 22,326 33,099 55,425 Upper Secondary 274,842 326,656 601,498 Social sciences, Technical or Business and 152,729 261,230 413,959 Vocational 120,366 138,331 258,697 Law qualification Science, Advanced Mathematics 70,825 59,738 130,563 Certificate/Completed 116,900 55,025 171,925 and Computing Apprenticeship Engineering, Higher Certificate 59,359 75,763 135,122 Manufacturing 260,892 24,033 284,925 Ordinary Bachelor and Construction Degree or National 98,460 123,517 221,977 Diploma Agriculture and 70,015 12,927 82,942 Honours Bachelor Veterinary Degree, Professional 120,962 150,339 271,301 Health and qualification or both 29,961 172,998 202,959 Welfare Postgraduate Diploma Services 50,229 83,171 133,400 94,295 130,449 224,744 or Degree Other subjects 1,264 1,884 3,148 Doctorate(Ph.D) or 13,018 8,952 21,970 Not Stated higher (including 766,064 761,492 1,527,556 Not stated 67,473 72,398 139,871 unknown) Total 1,473,483 1,530,007 3,003,490 Total 1,473,483 1,530,007 3,003,490
- 4. Population aged 5 years and over by Population aged 5 years and over by time Population aged 5 years and over by means of travel to work, school or leaving home to travel to work, school or journey time to work, school or college college college Under 15 mins 921,724 On foot 414,938 Before 06:30 122,056 1/4 hour - under 1/2 hour 812,773 Bicycle 61,177 06:30-07:00 161,594 1/2 hour - under 3/4 hour 463,182 Bus, minibus or coach 288,562 07:01-07:30 228,595 3/4 hour - under 1 hour 152,894 Train, DART or LUAS 70,976 07:31-08:00 391,908 1 hour - under 1 1/2 hours 140,545 Motorcycle or scooter 9,312 08:01-08:30 560,748 1 1/2 hours and over 51,038 Car driver 1,127,396 08:31-09:00 656,371 Not stated 162,248 Car passenger 508,338 09:01-09:30 262,469 Total 2,704,404 Van 118,991 After 09:30 216,043 Other 104,853 Not stated 104,620 Not stated 89,590 Total 2,704,404 Total 2,794,133 Persons with disability by age group Carers by sex and number of unpaid Population by general health and sex 00-14 53,058 hours per week Health Males Females Total 15-24 44,513 Number of hours Males Females Very Good 1,376,303 1,391,378 2,767,681 25-44 120,426 1-14 33,359 47,532 Good 635,037 647,919 1,282,956 45-64 173,269 15-28 10,853 18,402 Fair 176,239 191,892 368,131 65+ 204,069 29-42 5,443 8,696 Bad 27,727 29,516 57,243 Total 595,335 43+ 13,375 26,607 Very bad 5,912 6,506 12,418 Not stated 9,969 12,876 Not stated 51,481 48,342 99,823 Total 72,999 114,113 Total 2,272,699 2,315,553 4,588,252 Persons at work or unemployed by Persons at work by industry and sex Number of households with cars occupation and sex Industry Males Females No motor car 289,722 Occupation Males Females Total Agriculture, forestry and One motor car 668,766 80,431 11,095 Managers, fishing Two motor cars 556,036 Directors and 109,849 61,560 171,409 Building and construction 80,174 7,197 Three motor cars Senior Officials 101,264 Manufacturing industries 147,913 61,890 Four or more motor cars 33,620 Professional 151,159 202,622 353,781 Commerce and trade 228,535 227,754 Occupations Associate Transport and 108,269 38,261 Professional and communications 138,244 92,916 231,160 Technical Public administration 59,942 53,918 Occupations Professional services 113,988 311,361 Administrative Other 135,289 141,343 and Secretarial 43,974 182,678 226,652 Total 954,541 852,819 Occupations Skilled Trades 317,029 31,075 348,104 Occupations Caring, Leisure and Other 22,372 122,217 144,589 Service Occupations Sales and Customer 52,276 103,004 155,280 Service Occupations Process, Plant and Machine 140,140 27,596 167,736 Operatives Elementary 122,330 79,400 201,730 Occupations Not stated 111,983 85,613 197,596 Total 1,209,356 988,681 2,198,037 Number of households with a personal Number of households with internet computer access Yes 1,199,298 Broadband 1,051,942 No 414,597 Other 132,973 Not stated 35,513 No 426,096 Total 1,649,408 Not stated 38,397 Total 1,649,408 Contact Census Enquiries : Tel: 353-1-8951460 | e-mail: census@cso.ie Central Statistics Office, Swords Business Campus, Balheary Rd, Swords, Co. Dublin, Ireland. Fax: 353-1-8951399 | LoCall: 1890 236 787 | e-mail: census@cso.ie