India's Gross Domestic Product GDP for 4th Quarter 2013-14
•Descargar como DOCX, PDF•
0 recomendaciones•439 vistas

India Story ….. An Opportunity in Adversity . . . #IndiaEconomicGrowth #IndiaGDP growth rate for 4 Quarters with averages copmared with previous financial year's GDP Data. . . Latest India GDP for Q4 2013-14 released on 30th May 2014 and next release on 29th August 2014 for Q1 2014-15 . . #IndiaGrossDomesticProduct #IndiaGrowthRates #yoy #YearOnYearGrowth #IndiaEconomicData #IndiaGDPrelease #GrossDomesticProduct

Recomendados
Más contenido relacionado
La actualidad más candente
La actualidad más candente (18)
Destacado
Destacado (13)
Similar a India's Gross Domestic Product GDP for 4th Quarter 2013-14
Similar a India's Gross Domestic Product GDP for 4th Quarter 2013-14 (20)
Más de Jhunjhunwalas
Más de Jhunjhunwalas (20)
Último
Último (20)
India's Gross Domestic Product GDP for 4th Quarter 2013-14
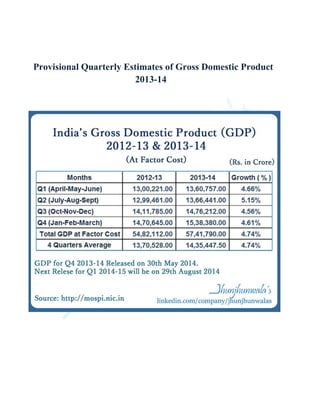
- 1. Provisional Quarterly Estimates of Gross Domestic Product 2013-14
- 2. PRESS INFORMATION BUREAU GOVERNMENT OF INDIA Dated the 9 Jyaistha, 1936 Saka 30th May, 2014 PRESS NOTE PROVISIONAL ESTIMATES OF ANNUAL NATIONALINCOME, 2013-14 AND QUARTERLY ESTIMATES OF GROSS DOMESTIC PRODUCT, 2013-14 The Central Statistics Office (CSO), Ministry of Statistics and Programme Implementation, has released the provisional estimates of national income for the financial year 2013-14 and the quarterly estimates of Gross Domestic Product (GDP) for the fourth quarter (January-March) of 2013-14, both at constant (2004-05) and current prices. 2. The CSO has also released the corresponding annual and quarterly estimates of Expenditure components of the GDP in current and constant (2004-05) prices, namely the private final consumption expenditure, government final consumption expenditure, gross fixed capital formation, change in stocks, valuables, and net exports. 3. GDP growth rates for 2013-14 and Q1,Q2,Q3 and Q4 of 2013-14 at constant (2004-05) and current prices are given below: Constant prices Current prices At Factor cost Market price At Factor cost Market price Annual 2013-14 4.7 5.0 11.5 12.3 Q12013-14(April-June) 4.7 4.2 10.6 10.3 Q22013-14(July-Sep) 5.2 5.2 12.7 13.6 Q32013-14(Oct-Dec) 4.6 4.4 12.8 13.0 Q42013-14 (Jan-Mar) 4.6 6.1 10.2 12.2 Estimates including growth rates for Q1, Q2 and Q3 released earlier have been revised according to the revision policy of this Ministry.
- 3. I PROVISIONAL ESTIMATES OF NATIONAL INCOME, 2013-14 4. The advance estimates of national income for the year 2013-14 were released on 7th February, 2014. These estimates have now been revised incorporating latest estimates of agricultural production, index of industrial production and performance of key sectors like, railways, transport other than railways, communication, banking, insurance and government expenditure. 5. The salient features of these estimates are detailed below: (a) Estimates at constant (2004-05) prices Gross Domestic Product 6. GDP at factor cost at constant (2004-05) prices in the year 2013-14 is now estimated at ` 57.42 lakh crore (as against ` 57.49 lakh crore estimated earlier on 7th February, 2014), showing a growth rate of 4.7 percent (as against 4.9 percent estimated earlier) over the First Revised Estimates of GDP for the year 2012-13 of ` 54.82 lakh crore, released on 31th January 2014. 14 In the agriculture sector, the third advance estimates of crop production released by the Ministry of Agriculture showed a slight upward revision as compared to their second advance estimates in the production of rice (106.29 million Tonnes from 106.19 million Tonnes), wheat (95.85 million Tonnes from 95.60 million Tonnes) and sugarcane (348.38 million Tonnes from 345.92 million Tonnes) for the year 2013-14. Due to this revision in the production, ‘agriculture, forestry and fishing’ sector in 2013-14 has shown a growth rate of 4.7 percent, as against the growth rate of 4.6 percent in the Advance Estimates. 8. In the case of ‘mining and quarrying’, the Index of Industrial Production of Mining registered a decline of 0.8 percent during 2013-14, as against the decline of 2.2 percent during April-November, 2013, which was used in the Advance Estimates. Production of coal and crude oil registered growth rates of 0.8 percent and (-) 0.2 percent in 2013-14 as compared to growth rates of 1.2 percent and (-) 0.6 percent during April to December, 2013. The growth of ‘mining &quarrying’ is now estimated at (-) 1.4 percent, as against the Advance Estimate growth of (-) 1.9 percent. 9. Similarly, the IIP of manufacturing registered a growth rate of (-) 0.8 percent during 2013-14, as against the projected growth rate of (-) 0.3 percent for April- March 2013-14 used for compiling the Advance Estimates. Due to this, the growth of ‘manufacturing’ sector is now estimated at (-) 0.7 percent, as against the Advance Estimate growth of (-) 0.2 percent. 10. The key indicators of construction sector, namely, cement and consumption of finished steel registered growth of 3.0 percent and 0.6 percent, respectively in 2013-14 as against 3.7 percent and 0.5 percent, respectively during April-December 2013. Consequently, the growth of the sector is revised to 1.6 percent as against 1.7 percent in the Advance Estimates.
- 4. 11. The key indicators of banking, namely, aggregate bank deposits and bank credits have shown growth of 14.6 percent and 14.3 percent, respectively during 2013-14 over the corresponding period in 2012-13, as compared to growth of 15.9 percent and 14.5 percent as on December 2013. In the transport and communication sectors, the sale of commercial vehicles, cargo handled at major ports, cargo handled by the civil aviation and passengers handled by the civil aviation registered growth rates of (-) 20.2 per cent, 1.8 percent, 2.6 per cent and 6.6 per cent respectively during April-March of 2013-14. Indicators of Railways sector, namely, Net Tonne Kilometers and Passenger Kilometers have shown growth of 1.6 and (-) 1.9 percent respectively during 2013-14 . The Trade, hotels and transport sector have registered a growth of 3.0 percent in 2013-14 as against 3.5 percent in the advance estimate released in February, 2014. 12. The sector 'community, social and personal services' has shown a growth rate of 5.6 per cent in the provisional estimates, as against the growth rate of 7.4 per cent in the advance estimates, mainly due to fall in total expenditure of Central Government than anticipated (during April-December 2013). The total expenditure of Central Government showed a rise of 17.4 per cent which was extrapolated in the advance estimates, whereas the Revised Estimates (RE) 2013-14 of Central Government expenditure showed a rise of only 12.8 per cent. Gross National Income 13. The Gross National Income (GNI) at factor cost at 2004-05 prices is now estimated at ` 56.74 lakh crore (as compared to ` 56.81 lakh crore estimated on 7th February 2014), during 2013-14, as against the previous year’s First Revised Estimate of ` 54.17 lakh crore. In terms of growth rates, the gross national income is estimated to have risen by 4.7 percent during 2013-14, in comparison to the growth rate of 4.1 percent in 2012-13. Per Capita Net National Income 14. The per capita net national income in real terms (at 2004-05 prices) during 2013-14 is estimated to have attained a level of ` 39,904 (as against ` 39,961 estimated on 7th February, 2014), as compared to the First Revised Estimates for the year 2012-13 of ` 38,856. The growth rate in per capita income is estimated at 2.7 percent during 2013-14 as against 2.1 percent during 2012-13. (b) Estimates at current prices Gross Domestic Product 15. GDP at factor cost at current prices in the year 2013-14 is estimated at `104.73 lakh crore, showing a growth rate of 11.5 percent over the First Revised Estimates of GDP for the year 2012-13 of ` 93.89 lakh crore, released on 31th January 2014.
- 5. Gross National Income 16. The GNI at factor cost at current prices is now estimated at ` 103.45 lakh crore during 2013-14, as compared to ` 92.72 lakh crore during 2012-13, showing a rise of 11.6 percent. Per Capita Net National Income 17. The per capita income at current prices during 2013-14 is estimated to have attained a level of ` 74,380 as compared to the First Revised Estimates for the year 2012-13 of ` 67,839 showing a rise of 9.6 percent. II ESTIMATES OF GDP AT MARKET PRICES, 2013-14 18. GDP at current market price is estimated at ` 113.55 lakh crore in the year 2013-14 (` 113.20 lakh crore in advance estimates) as against ` 101.13 lakh crore in the year 2012-13 showing an increase of 12.3 per cent. At constant (2004-05) prices, the GDP at market price is estimated at ` 61.96 lakh crore in the year 2013-14 (` 61.74 lakh crore in the advance estimates) as against ` 59.0 lakh crore in 2012-13 showing an increase of 5.0 percent over the previous year. The estimates of GDP at market prices are derived at by adding net indirect taxes( indirect taxes – subsidies) to GDP at factor cost. The indirect taxes and subsidies have been compiled using the Revised Estimates of Central Government. Growth in major subsidies for RE 2013-14 over 2012-13 is -1.0 percent. Growth in indirect tax revenue of the Central Government including Customs, excise and service tax is 5.6 per cent, 2.1 percent and 24.5 percent respectively for RE 2013-14 over 2012-13. III ANNUAL ESTIMATES OF EXPENDITURES ON GDP, 2013-14 19. Along with the Provisional Estimates of GDP by economic activity, the CSO is also releasing the estimates of expenditures of the GDP at current and constant (2004-05) prices. These estimates have been compiled using the data on indicators available from the same sources as those used for compiling GDP estimates by economic activity, detailed data available on merchandise trade in respect of imports and exports, balance of payments, and monthly expenditure of Central Government. As various components of expenditure on gross domestic product, namely, consumption expenditure and capital formation, are normally measured at market prices, the discussion in the following paragraphs is in terms of market prices only. Private Final Consumption Expenditure 20. Private Final Consumption Expenditure (PFCE) at current prices is estimated at ` 64.85 lakh crore in 2013-14 as against ` 57.72 lakh crore in 2012-13. At constant (2004-05) prices, the PFCE is estimated at ` 37.20 lakh crore in 2013-14 as against ` 35.48 lakh crore in 2012-13. In terms of GDP at market prices, the rates of PFCE at current and constant (2004-05) prices during 2013-14 are estimated at 57.1 percent and 60.0 percent, respectively, as against the corresponding rates of 57.1 percent and 60.1 percent, respectively in 2012-13.
- 6. Government Final Consumption Expenditure 21. Government Final Consumption Expenditure (GFCE) at current prices is estimated at ` 13.41 lakh crore in 2013-14 as against ` 11.89 lakh crore in 2012-13. At constant (2004-05) prices, the GFCE is estimated at ` 6.87 lakh crore in 2013-14 as against ` 6.62 lakh crore in 2012-13. In terms of GDP at market prices, the rates of GFCE at current and constant (2004-05) prices during 2013-14 are estimated at 11.8 percent and 11.1 percent, respectively, as against the corresponding rates of 11.8 percent and 11.2 percent, respectively in 2012-13. Gross Fixed Capital Formation 22. Gross Fixed Capital Formation (GFCF) at current prices is estimated at ` 32.11 lakh crore in 2013-14 as against ` 30.72 lakh crore in 2012-13. At constant (2004-05) prices, the GFCF is estimated at ` 20.00 lakh crore in 2013-14 as against ` 20.02 lakh crore in 2012-13. In terms of GDP at market prices, the rates of GFCF at current and constant (2004-05) prices during 2013-14 are estimated at 28.3 percent and 32.3 percent, respectively, as against the corresponding rates of 30.4 percent and 33.9 percent, respectively in 2012-13. The rates of Change in Stocks and Valuables at current prices during 2013-14 are estimated at 1.6 percent and 1.5 percent, respectively. 23. The discrepancies at current and constant (2004-05) prices during 2013-14 are estimated at 3.2 percent and (-)1.2 percent, respectively of the GDP at market prices, as against the corresponding rate of 3.2 percent and (-)1.0 percent respectively in 2012-13. 24. Estimates of gross/net national income and per capita income, along with GDP at factor cost by kind of economic activity and the Expenditures on GDP for the years 2011-12, 2012-13 and 2013-14 at constant (2004-05) and current prices are given in Statements 1 to 6. IV QUARTERLY ESTIMATES OF GDP FOR Q4 (JANUARY-MARCH), 2013-14 (a) Estimates at constant (2004-05) prices 25. The four quarters of a financial year are denoted by Q1, Q2, Q3 and Q4. GDP at factor cost at constant (2004-05) prices in Q4 of 2013-14 is estimated at ` 15.38 lakh crore, as against ` 14.71 lakh crore in Q4 of 2012-13, showing a growth rate of 4.6 percent. 26. Growth rates in various sectors are as follows: ‘agriculture, forestry and fishing’ (6.3 percent), ‘mining and quarrying’ (-0.4 percent), ‘manufacturing’ (-1.4 percent), ‘electricity, gas and water supply’ (7.2 percent) ‘construction’ (0.7 percent), 'trade, hotels, transport and communication' (3.9 percent), 'financing, insurance, real estate and business services' (12.4 percent), and 'community, social and personal services' (3.3 percent).
- 7. 27. According to the latest estimates available on the IIP, the index of mining, manufacturing and electricity registered growth rates of 1.1 percent, (-)1.6 percent and 7.6 percent respectively, in Q4 of 2013-14, as compared to the growth rates of (-) 3.8 percent, 3.1 percent and 2.3 percent respectively in these sectors in Q4, 2012-13. 28. The key indicators of railways, namely, the net tonne kilometers and passenger kilometers have shown decline in growth rates of 1.2 percent and 0.8 percent, respectively in Q4 of 2013-14, as against the growth rates of (-)1.2 percent and (-)2.8 percent, in the corresponding period of previous year. In the transport and communication sectors, the sale of commercial vehicles and cargo handled at major ports, registered growth rates of (-)24.1 percent and 1.4 percent respectively in Q4 of 2013-14. The Trade, hotels and transport sector have registered a growth of 3.9 percent in 2013-14 as against 4.8 percent in Q4 of 2012-13. 29. The PFCE and GFCF at constant (2004-05) market prices in Q4 of 2013-14 are estimated at ` 9.78 lakh crore and ` 5.36 lakh crore, respectively. The rates of PFCE and GFCF as percentage of GDP at market prices in Q4 of 2013-14 were 57.0 percent and 31.2 percent, respectively, as against the corresponding rates of 55.9 percent and 33.4 percent, respectively in Q4 of 2012-13. (b) Estimates at current prices 30. GDP at factor cost at current prices in Q4 of 2013-14 is estimated at ` 28.01 lakh crore, as against ` 25.42 lakh crore in Q4 of 2012-13, showing a growth of 10.2 percent. 31. The PFCE and GFCF at current market prices in Q4 of 2013-14 are estimated at ` 17.22 lakh crore and ` 8.68 lakh crore, respectively. The rates of PFCE and GFCF at current prices as percentage of GDP at market prices in Q4 of 2013-14 are estimated at 54.7 percent and 27.6 percent, respectively, as against the corresponding rates of 53.6 percent and 30.3 percent, respectively in Q4 of 2012-13. 32. Estimates of GDP at factor cost by kind of economic activity and the Expenditures on GDP for the four quarters of 2011-12, 2012-13 and 2013-14 at constant (2004-05) and current prices, are given in Statements 7 to 10. 33. The next release of quarterly GDP estimate for the quarter April-June, 2014 (Q1 of 2014-15) will be on 29.08.2014.
- 8. STATEMENT 1: Provisional Estimates of National Income and Expenditures on GDP, 2013-14 (At 2004-05 prices) Item 2011-12 2012-13 2013-14 (2nd RE) (1st RE) (PE) A. ESTIMATES AT AGGREGATE LEVEL 1. NATIONAL PRODUCT (Rs. Crore) 1.1 Gross National Income (GNI) at factor cost 5201163 5416659 5673857 (4.1) (4.7) 1.2 Net National Income (NNI) at factor cost 4573328 4728776 4920183 (3.4) (4.0) 2. DOMESTIC PRODUCT (Rs. Crore) 2.1 Gross domestic product (GDP) at factor cost 5247530 5482111 5741791 (4.5) (4.7) 2.2 Gross domestic product (GDP) at market prices 5633050 5899847 6195842 (4.7) (5.0) 2.3 Net domestic product (NDP) at factor cost 4619695 4794228 4988116 (3.8) (4.0) B. ESTIMATES AT PER CAPITA LEVEL Population (million) 1,202 1,217 1,233 Per capita NNI at factor cost (Rs.) 38,048 38,856 39,904 (2.1) (2.7) Per capita GDP at factor cost (Rs.) 43,657 45,046 46,568 ( 3.2 ) (3.4) STATEMENT 2: Provisional Estimates of National Income for the year 2013-14 (At current prices) 2011-12 2012-13 2013-14 Item (2nd RE) (1st RE) (PE) A. ESTIMATES AT AGGREGATE LEVEL 1. NATIONAL PRODUCT (Rs. Crore) 1.1 Gross National Income (GNI) at factor cost 8,314,861 9,272,110 10,344,507 (11.5) (11.6) 1.2 Net National Income (NNI) at factor cost 7,434,965 8,255,978 9,171,045 (11.0) (11.1) 2. DOMESTIC PRODUCT (Rs. Crore) 2.1 Gross domestic product (GDP) at factor cost 8,391,691 9,388,876 10,472,807 (11.9) (11.5) 2.2 Gross domestic product (GDP) at market prices 9,009,722 10,113,281 11,355,073 (12.2) (12.3) 2.3 Net domestic product (NDP) at factor cost 7,511,795 8,372,744 9,299,345 (11.5) (11.1) 2.4 Gross National Disposable Income 9,237,794 10,346,596 11,608,073 B. ESTIMATES AT PER CAPITA LEVEL Population (million) 1,202 1,217 1,233 Per capita NNI at factor cost (Rs.) 61,855 67,839 74,380 (9.7) (9.6) Per capita GDP at factor cost (Rs.) 69,814 77,148 84,938 (10.5) (10.1) Note: The figures in parenthesis show the percentage change over previous year 2nd RE: Second Revised Estimate;1st RE: First Revised Estimate; PE: Provisional estimate
- 9. STATEMENT 3: Provisional Estimates of GDP at Factor Cost by Economic Activity (At 2004-05 prices) Rs. Crore 2011-12 2012-13 2013-14 Percentage change over (2nd RE) (1st RE) (PE) previous year Industry 2012-13 2013-14 1. agriculture, forestry & fishing 753,832 764,510 800,548 1.4 4.7 2. mining & quarrying 110,725 108,328 106,838 -2.2 -1.4 3. manufacturing 854,098 863,876 857,705 1.1 -0.7 4. electricity, gas & water supply 100,646 102,922 109,018 2.3 5.9 5. construction 415,188 419,795 426,664 1.1 1.6 6. trade, hotels, transport and 1,402,261 1,473,353 1,517,826 5.1 3.0 communication 7. financing, insurance, real estate 945,534 1,048,748 1,183,714 10.9 12.9 & business services 8. community, social & personal 665,246 700,579 739,477 5.3 5.6 Services 9. GDP at factor cost 5,247,530 5,482,111 5,741,791 4.5 4.7 2nd RE: Second Revised Estimate; 1st RE: First Revised Estimate; PE: Provisional Estimate STATEMENT 4: Provisional Estimates of GDP at Factor Cost by Economic Activity (At current prices) Rs. Crore 2011-12 2012-13 2013-14 Percentage change (2nd RE) (1st RE) (PE) over previous year Industry 2012-13 2013-14 1. agriculture, forestry & fishing 1,499,098 1,644,926 1,906,348 9.7 15.9 2. mining & quarrying 222,716 222,416 222,652 -0.1 0.1 3. manufacturing 1,236,182 1,320,907 1,350,039 6.9 2.2 4. electricity, gas & water supply 135,670 157,132 203,049 15.8 29.2 5. construction 689,798 759,990 818,432 10.2 7.7 6. trade, hotels, transport and communication 2,072,272 2,324,695 2,509,907 12.2 8.0 7. financing, insurance, real estate & business 1,381,524 1,617,076 1,939,482 17.1 19.9 Services 8. community, social & personal services 1,154,431 1,341,734 1,522,898 16.2 13.5 9. GDP at factor cost 8,391,691 9,388,876 10,472,807 11.9 11.5 2nd RE: Second Revised Estimate; 1st RE: First Revised Estimate; PE: Provisional Estimate
- 10. STATEMENT 5: EXPENDITURES OF GDP AT MARKET PRICES IN 2013- 14 (at 2004-05 prices) Item (Rs. in crore) Expenditures of Gross Domestic RATES OF GDP AT Product MARKET PRICES (%) 2011-12 2012-13 2013-14 2012-13 2013-14 (2nd RE) (1st RE) (PE) 1. Private Final Consumption Expenditure 3,378,506 3,547,584 3,719,568 60.1 60.0 (PFCE) 2. Government Final Consumption 623,574 662,032 687,388 11.2 11.1 Expenditure 3. Gross Fixed Capital Formation (GFCF) 1,986,645 2,002,047 1,999,938 33.9 32.3 4. Change in Stocks 117,111 106,607 108,349 1.8 1.7 5. Valuables 133,454 181,206 123,941 3.1 2.0 6. Exports 1,381,129 1,449,803 1,572,221 24.6 25.4 7. Less Imports 1,867,249 1,989,578 1,938,861 33.7 31.3 8. Discrepancies -120,121 -59,854 -76,702 -1.0 -1.2 GDP at market prices 5,633,050 5,899,847 6,195,842 100.0 100.0 2nd RE: Second Revised Estimate; 1st RE: First Revised Estimate; PE: Provisional Estimate STATEMENT 6: EXPENDITURES OF GDP AT MARKET PRICES IN 2013- 14 (at current prices) (Rs. in crore) RATES OF GDP AT MARKET Expenditures of Gross Domestic Product PRICES (%) Item 2011-12 2012-13 2013-14 2012-13 2013-14 (2nd RE) (1st RE) (PE) 1. Private Final Consumption Expenditure 5,141,896 5,772,059 6,485,037 57.1 57.1 (PFCE) 2. Government Final Consumption 1,025,895 1,189,132 1,341,341 11.8 11.8 Expenditure 3. Gross Fixed Capital Formation (GFCF) 2,861,062 3,071,543 3,211,114 30.4 28.3 4. Change in Stocks 170,596 171,184 186,797 1.7 1.6 5. Valuables 246,673 266,482 170,548 2.6 1.5 6. Exports 2,150,326 2,426,807 2,817,773 24.0 24.8 7. Less Imports 2,721,947 3,108,430 3,226,089 30.7 28.4 8. Discrepancies 135,220 324,505 368,552 3.2 3.2 GDP at market prices 9,009,722 10,113,281 11,355,073 100.0 100.0 2nd RE: Second Revised Estimate; 1st RE: First Revised Estimate; PE: Provisional Estimate
- 11. STATEMENT 7: Quarterly Estimates of GDP for 2013-14 (at 2004-05 prices) GDP AT FACTOR COST (Rs. in crore) PERCENTAGE CHANGE OVER PREVIOUS YEAR 2011-12 2012-13 2013-14 2012-13 2013-14 industry Q1 Q2 Q3 Q4 Q1 Q2 Q3 Q4 Q1 Q2 Q3 Q4 Q1 Q2 Q3 Q4 Q1 Q2 Q3 Q4 1. agriculture, forestry & fishing 174,763 141,096 239,720 198,252 177,947 143,596 241,556 201,410 185,084 150,822 250,477 214,165 1.8 1.8 0.8 1.6 4.0 5.0 3.7 6.3 2. mining & quarrying 26,808 24,516 27,970 31,431 26,519 24,484 27,400 29,924 25,490 24,484 27,075 29,790 -1.1 -0.1 -2.0 -4.8 -3.9 0.0 -1.2 -0.4 3. manufacturing 211,032 207,492 210,325 225,249 208,756 207,437 215,582 232,101 206,340 210,211 212,319 228,835 -1.1 0.0 2.5 3.0 -1.2 1.3 -1.5 -1.4 4. electricity, gas & water supply 24,964 25,056 25,144 25,482 26,018 25,389 25,799 25,717 26,999 27,369 27,090 27,560 4.2 1.3 2.6 0.9 3.8 7.8 5.0 7.2 5. construction 99,064 99,881 105,047 111,195 101,803 98,031 106,094 113,867 102,875 102,378 106,759 114,652 2.8 -1.9 1.0 2.4 1.1 4.4 0.6 0.7 6. trade, hotels, transport 336,005 338,531 346,963 380,762 349,478 357,377 367,320 399,178 355,018 370,210 377,915 414,683 4.0 5.6 5.9 4.8 1.6 3.6 2.9 3.9 &commn. 7. financing, ins., real est. & bus. 228,843 233,651 237,752 245,288 255,560 258,524 261,960 272,704 288,494 289,762 298,968 306,489 11.7 10.6 10.2 11.2 12.9 12.1 14.1 12.4 Services 8. community, social & personal 143,228 171,912 159,630 190,477 154,140 184,624 166,072 195,743 170,458 191,205 175,609 202,205 7.6 7.4 4.0 2.8 10.6 3.6 5.7 3.3 Services GDP at factor cost 1,244,706 1,242,135 1,352,551 1,408,136 1,300,221 1,299,461 1,411,785 1,470,645 1,360,757 1,366,441 1,476,212 1,538,380 4.5 4.6 4.4 4.4 4.7 5.2 4.6 4.6 STATEMENT 8: Quarterly Estimates of GDP for 2013-14 (at current prices) GDP AT FACTOR COST (Rs. in crore) PERCENTAGE CHANGE OVER PREVIOUS YEAR 2011-12 2012-13 2013-14 2012-13 2013-14 industry Q1 Q2 Q3 Q4 Q1 Q2 Q3 Q4 Q1 Q2 Q3 Q4 Q1 Q2 Q3 Q4 Q1 Q2 Q3 Q4 1. agriculture, forestry & fishing 339020 279526 480461 400091 376011 307495 521337 440083 423712 363305 615644 503687 10.9 10.0 8.5 10.0 12.7 18.1 18.1 14.5 2. mining & quarrying 51147 47836 55985 67748 53419 49830 56595 62573 50724 51335 57363 63230 4.4 4.2 1.1 -7.6 -5.0 3.0 1.4 1.1 3. manufacturing 300511 298014 306048 331609 313696 317223 331588 358400 320159 329211 336106 364563 4.4 6.4 8.3 8.1 2.1 3.8 1.4 1.7 4. electricity, gas & water supply 32906 33361 34470 34933 37374 39536 40175 40047 47487 50529 51958 53075 13.6 18.5 16.6 14.6 27.1 27.8 29.3 32.5 5. construction 160670 164722 175625 188780 180261 177038 193203 209488 190993 197182 208155 222101 12.2 7.5 10.0 11.0 6.0 11.4 7.7 6.0 6. trade, hotels, transport 492924 499664 520682 559002 544027 564291 589597 626781 576810 620129 640537 672432 10.4 12.9 13.2 12.1 6.0 9.9 8.6 7.3 &commn. 7. financing, ins., real est. & bus. 329595 340147 349152 362630 388606 399509 406551 422410 461234 479931 496457 501860 17.9 17.5 16.4 16.5 18.7 20.1 22.1 18.8 Services 8. community, social & personal 241157 296508 279642 337125 286491 351389 321425 382429 339598 395012 368175 420114 18.8 18.5 14.9 13.4 18.5 12.4 14.5 9.9 Services GDP at factor cost 1947931 1959778 2202066 2281917 2179885 2206309 2460471 2542211 2410718 2486633 2774395 2801061 11.9 12.6 11.7 11.4 10.6 12.7 12.8 10.2
- 12. STATEMENT 9: Quarterly Estimates of Expenditures of GDP for 2013-14 (at 2004-05 prices) Item AT MARKET PRICES (Rs. in crore) RATES of GDP AT MARKET PRICES (%) 2012-13 2013-14 2012-13 2013-14 Q1 Q2 Q3 Q4 Q1 Q2 Q3 Q4 Q1 Q Q3 Q4 Q1 Q2 Q3 Q4 1. Private Final Consumption 837,828 848,639 957,061 904,055 885,067 872,663 983,386 978,452 61.0 61.4 62.7 55.9 61.8 60.0 61.7 57.0 Expenditure (PFCE) 2. Government Final 152,505 148,081 183,310 178,137 172,143 147,863 189,951 177,432 11.1 10.7 12.0 11.0 12.0 10.2 11.9 10.3 Consumption Expenditure 3. Gross Fixed Capital Formation 476,521 482,447 502,823 540,256 463,173 497,432 503,710 535,622 34.7 34.9 33.0 33.4 32.3 34.2 31.6 31.2 (GFCF) 4. Change in Stocks 25,762 25,599 26,604 28,643 26,066 26,555 26,821 28,907 1.9 1.9 1.7 1.8 1.8 1.8 1.7 1.7 5. Valuables 45,124 45,594 46,984 43,505 30,420 31,423 27,677 34,421 3.3 3.3 3.1 2.7 2.1 2.2 1.7 2.0 6. Exports 361,798 353,119 349,919 384,967 351,497 405,987 389,292 425,446 26.3 25.5 22.9 23.8 24.5 27.9 24.4 24.8 7. Less Imports 484,435 491,981 503,434 509,728 492,476 493,917 461,543 490,925 35.2 35.6 33.0 31.5 34.4 34.0 29.0 28.6 8. Discrepancies -40,756 -28,632 -38,009 47,545 -3,650 -33,659 -66,656 27,263 -3.0 -2.1 -2.5 2.9 -0.3 -2.3 -4.2 1.6 GDP at market prices 1,374,346 1,382,866 1,525,258 1,617,379 1,432,240 1,454,346 1,592,637 1,716,618 100.0 100.0 100.0 100.0 100.0 100.0 100.0 100.0 STATEMENT 10: Quarterly Estimates of Expenditures of GDP for 2013-14 (at current prices) Item AT MARKET PRICES (Rs. in crore) - RATES of GDP AT MARKET PRICES (%) 2012-13 2013-14 2012-13 2013-14 Q1 Q2 Q3 Q4 Q1 Q2 Q3 Q4 Q1 Q2 Q3 Q4 Q1 Q2 Q3 Q4 1. Private Final Consumption 1,330,747 1,372,438 1,564,216 1,504,659 1,491,773 1,526,178 1,745,000 1,722,086 57.6 58.6 58.9 53.6 58.6 57.4 58.1 54.7 Expenditure (PFCE) 2. Government Final Consumption 266,715 268,590 334,235 319,592 328,541 294,143 379,719 338,938 11.6 11.5 12.6 11.4 12.9 11.1 12.6 10.8 Expenditure 3. Gross Fixed Capital Formation 711,628 734,936 775,412 849,566 731,957 793,692 817,256 868,210 30.8 31.4 29.2 30.3 28.7 29.9 27.2 27.6 (GFCF) 4. Change in Stocks 40,654 41,111 42,972 46,447 44,299 45,551 46,505 50,442 1.8 1.8 1.6 1.7 1.7 1.7 1.5 1.6 5. Valuables 66,359 67,051 69,094 63,978 41,860 43,239 38,085 47,365 2.9 2.9 2.6 2.3 1.6 1.6 1.3 1.5 6. Exports 592,964 587,420 595,943 650,480 610,753 725,464 720,495 761,062 25.7 25.1 22.4 23.2 24.0 27.3 24.0 24.2 7. Less Imports 740,894 763,722 800,088 803,726 789,793 817,182 793,688 825,426 32.1 32.6 30.1 28.7 31.0 30.7 26.4 26.2 8. Discrepancies 40,560 33,469 76,151 174,325 87,546 47,538 49,312 184,157 1.8 1.4 2.9 6.2 3.4 1.8 1.6 5.9 GDP at market prices 2,308,732 2,341,294 2,657,935 2,805,321 2,546,935 2,658,622 3,002,683 3,146,833 100.0 100.0 100.0 100.0 100.0 100.0 100.0 100.0