Dania Beach Fire Department Monthly Report Highlights September 2010 Data
•
1 recomendación•261 vistas

The monthly report from September 2010 provides data on emergency responses, automatic aid, training hours, EMS transports, and collections for the Dania Beach Fire-Rescue Department over the previous years for comparison, with highlights including 583 total calls for service, 122 automatic aid responses given, and over 1300 training hours completed.

Recomendados
Más contenido relacionado
Destacado
Destacado (19)
Similar a Dania Beach Fire Department Monthly Report Highlights September 2010 Data
Similar a Dania Beach Fire Department Monthly Report Highlights September 2010 Data (9)
Más de city of dania beach
Más de city of dania beach (20)
Dania Beach Fire Department Monthly Report Highlights September 2010 Data
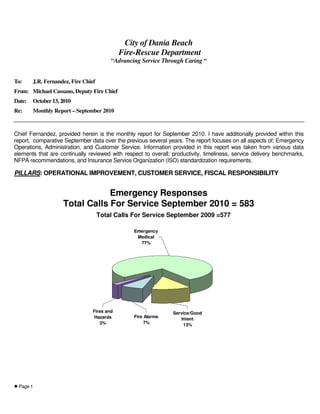
- 1. City of Dania Beach Fire-Rescue Department “Advancing Service Through Caring “ To: J.R. Fernandez, Fire Chief From: Michael Cassano, Deputy Fire Chief Date: October 13, 2010 Re: Monthly Report – September 2010 Chief Fernandez, provided herein is the monthly report for September 2010. I have additionally provided within this report, comparative September data over the previous several years. The report focuses on all aspects of; Emergency Operations, Administration, and Customer Service. Information provided in this report was taken from various data elements that are continually reviewed with respect to overall; productivity, timeliness, service delivery benchmarks, NFPA recommendations, and Insurance Service Organization (ISO) standardization requirements. PILLARS: OPERATIONAL IMPROVEMENT, CUSTOMER SERVICE, FISCAL RESPONSIBILITY Emergency Responses Total Calls For Service September 2010 = 583 Total Calls For Service September 2009 =577 Emergency Medical 77% Fires and Service/Good Hazards Fire Alarms Intent 3% 7% 13% Page 1
- 2. PILLARS: OPERATIONAL IMPROVEMENT, CUSTOMER SERVICE, FISCAL RESPONSIBILITY The continuation of automatic aid assessments shows a ”trending up” of given aid from year to year and remains off balanced as far as reciprocal totals, keeping in mind however that the need for multiple units and additional personnel minimally assigned (NFPA / ISO recommendations) to every fire response can only be made with the assistance of Hollywood Fire Rescue. Automatic Aid September 2010 Given 122 Received 85 September 2009 Given 95 Received 112 160 140 120 100 Given 80 Received 60 40 20 0 Jan Feb Mar Apr May Jun Jul Aug Sep Oct Nov PILLAR: FISCAL RESPONSIBILITY, HEALTH WELLNESS, & SAFETY FIRE PREVENTION & LIFE SAFETY DIVISION: Presented below are the Fire Prevention Division productivity figures for September 2010, with previous year comparatives for trending assessment purposes. The report which tracks a current “turn-around-time” for plan reviews, has reached a “customer friendly” processing rate of a plan review done in just one day! Inspected Properties: 2010: 266 2009: 359 2008: 243 2 Page
- 3. Square Footage Reviewed # Plans Time Spent Turn-around Time Back to Customer 2010: 893,693 39 39 hrs 1.1 Days 2009: 1,113,067 51 34 hrs 2.7 Days 2008: 1,269,884 51 65 hrs 2.1 Days Fees: Submitted September to Finance (without impact fees / matches H.T.E.): 2010: $24,000.00 2009: $23,000.00 2008: $19,000.00 GRANT AWARD STATUS: SAFER GRANT: Human Resource Department processed offer letters for a starting date of October 11th 2010. In all 9 SAFER Grant employees hired, 3 employees hired as replacements for personnel who had retired during the past budget year. MEDICAL CARTS: The manufacturing of both medical carts will be completed over the next two months. Video Laryngoscopes: Completed “Competency Based Training” (CBT) for all paramedic personnel through the regional training representative, Ambu. The equipment is designed to allow for full visualization of upper airway anatomic structures, thereby improving overall success rates for oral intubation, equipment has now been placed into service on both first out rescue units. 3 Page
- 4. PILLARS: OPERATIONAL IMPROVEMENT, PROFESSIONAL DEVELOPMENT The total training hours for personnel, continues to track at three to five times the hours seen for the same number of personnel during calendar year 2005. TRAINING Operational Improvement Pillar: Professional Development Customer Service / Community Outreach September 2009 Total Hours: 1420 September 2010 Total Hours: 1313 Fire/ISO 84% Fire/ISO 83% EMS Other 9% 6% Other EMS 8% 10% Fire EMS Other Fire EMS Other Probationary Crime Scene Officer Training Medical CEU Training Officer Training Staff Meeting Awareness Trip Tix Course and Haz Mat Training Auto Pulse Equipment Airway Training Design Class Training Management Premise Survey’s Equipment Night Rit Drill Maintenance Staff Meeting EO Training Fire Preplans Saw Training SOG Review 4 Page
- 5. PILLAR: FISCAL RESPONSIBILITY EMERGENCY MEDICAL SERVICES TRANSPORT FIGURES REPORT Transport Totals 4,000 3,462 3,283 3,377 3,316 3,286 3,021 3,073 3,000 2,000 1,000 - FY 2005 FY 2006 FY 2007 FY 2008 FY 2009 FYTD FYTD 2009 2010 Collections/Deposits Analysis $900,000 $808,781 $789,756 $798,741 $820,252 $800,000 $734,236 $720,545 $700,000 $608,137 $600,000 $500,000 $400,000 $300,000 $200,000 $100,000 $- FY FY FY FY FY FY FYTD 2004 2005 2006 2007 2008 2009 2010 Transport Comparison by M onth 350 300 250 200 150 100 50 0 v n n l c g r ar b pt ct ay Ju Ap No Ja Ju De Au Fe Se O M M FY 2007 FY 2008 FY 2009 FY 2010 5 Page
- 6. Fiscal Year Comparison $900,000 $764,587 $800,000 $720,545 $700,000 $600,000 $500,000 $400,000 $300,000 $200,000 $100,000 $- FYTD 2010 FYTD 2009 Monthly Collection Comparison for FY05 - Present $120,000 $100,000 $80,000 $60,000 $40,000 $20,000 $0 ay n n l ov ec g ct ar pt r b Ju Ap Ja Ju Fe Au O Se M N D M FY 2005 FY 2006 FY 2007 FY 2008 FY 2009 FY 2010 BLS & ALS Ratios 100% 73% 77% 80% 66% 65% 66% 64% 60% 35% 33% 34% 32% 40% 26% 21% 20% 1% 1% 1% 2% 1% 2% 0% FY 2005 FY 2006 FY 2007 FY 2008 FY 2009 FY 2010 BLS ALS1 ALS2 6 Page
- 7. Charge Mix Medicare Self Pay 25% 32% Medicaid Insurance 21% 22% Payor Mix Self Pay 6% Medicare 30% Insurance 53% Medicaid 11% The September 2010 Report is submitted herein for your review and comment. Respectfully submitted, Michael Cassano, Deputy Fire Chief 7 Page