The saturday economist 28th july
•
0 likes•191 views

The Saturday Economist, UK Economics News and Updates including a review of UK GDP Q2 data.

Recommended
Recommended
More Related Content
What's hot
What's hot (18)
Viewers also liked
Viewers also liked (15)
Similar to The saturday economist 28th july
Similar to The saturday economist 28th july (20)
More from John Ashcroft
More from John Ashcroft (20)
Recently uploaded
Recently uploaded (20)
The saturday economist 28th july
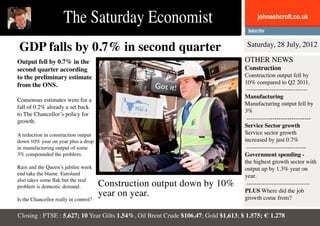
- 1. The Saturday Economist johnashcroft.co.uk GDP falls by 0.7% in second quarter Saturday, 28 July, 2012 Output fell by 0.7% in the OTHER NEWS second quarter according Construction to the preliminary estimate Construction output fell by from the ONS. 10% compared to Q2 2011. ------------------------------- Manufacturing Consensus estimates were for a Manufacturing output fell by fall of 0.2% already a set back 3% to The Chancellor’s policy for growth. ------------------------------- Service Sector growth A reduction in construction output Service sector growth down 10% year on year plus a drop increased by just 0.7% in manufacturing output of some ------------------------------ 3% compounded the problem. Government spending - the highest growth sector with Rain and the Queen’s jubilee week output up by 1.3% year on end take the blame. Euroland year. also takes some flak but the real problem is domestic demand. Construction output down by 10% -------------------------------- year on year. PLUS Where did the job growth come from? Is the Chancellor really in control? Closing : FTSE : 5,627; 10 Year Gilts 1.54%, Oil Brent Crude $106.47; Gold $1,613; $ 1.575; € 1.278
- 2. The Saturday Economist johnashcroft.co.uk GDP figures shock policy makers Saturday, 28 July, 2012 The prelimnary estimate for Service sector output was GDP in the second quarter up by 0.7%. Distribution, surprised all analysts. hotels, restaurants, The consensus forecast was pubs, clubs, transport, for a fall of 0.2% quarter on communication were pretty quarter and year on year. flat. The NIESR monthly GDP Bright spots in the gloom estimate was for a slightly were business and financial higher fall of 0.3%. services up by 0.8%. Construction output was Government and other down by almost 10% year services - the highest on year. Manufacturing growth sector up by 1.3%. output fell by 3%, extractives (mining) fell Overall GDP fell by 0.8% by 12%. Despite a surge compared to the second The promise of a classic “A classic recovery in utilities growth of 5%, quarter of 2011. The trend recovery from the depths of overall production (IOP) is heading in the wrong hits the skids as policy 2009 has been dashed by an was down by 3.2%. direction. ill conceived domestic policy. founders”
- 3. The Saturday Economist johnashcroft.co.uk So what happened to construction? Saturday, 28 July, 2012 Construction output fell by into the first quarter of 2013 by a significant 9.7% compared to the second unless activity increases shortfall in public quarter of 2011. significantly. sector activity including housing, There has been a great deal It is worth bearing in mind infrastructure and of scepticism surrounding the overall weighting of other investment the data on the construction construction in GDP is just 68 projects ( down sector, not least the strength / 1000, less than 7% of total 20%). of the recovery in 2011 when output. In a recession every growth appeared to be up by little helps including activity Private sector over 12% in the third quarter in housing and infrastructure. investment in of 2010. commercial and One third of construction industrial property Nevertheless, the latest activity is repair and is steady compared data suggest output fell maintenance, the balance in to 2011. in the second quarter by new work including housing, 10% year on year. This in infrastructure, commercial, The prospects for effect means construction industrial and government the rest of the year output has returned to the investment projects. and into the first levels of recession in 2009. quarter of 2013 are Furthermore, the 10% In the second quarter, the for the 10% drop to shortfall is likely to persist drop in output is explained continue.
- 4. The Saturday Economist johnashcroft.co.uk Does the GDP drop make sense? Saturday, 28 July, 2012 For many analysts, the Since the end of 2011, the fall in GDP output does economy appears to have not correlate with the slowed but the claimant trends in employment and count does not reflect the unemployment. slow down. The claimaint count for Indeed the unemplpyment example provides a very data is more consistent good co-incident index of with an economy growing growth and recession. at a modest rate of around 1%. In 2009, the quarterly change in unemployment So how do we explain increased by over 250,000 the separation of the data as GDP fell by over 6%. series? Some argue that There are some who assume Either way, the GDP data labour hoarding explains the separation reflects a lower does not look correct. But if As the economy recovered in part the difference but level of productivity in the negative growth means more in 2010 the claimant this is not reflected in the economy as a whole. Perhaps jobs in the new paradigm, count began to fall before data since new jobs are explained by growth in the why worry about it over the recovery petered out being created in the private self employed sector. much, wait for the inevitable through 2011. sector. revisions to the information.
- 5. The Saturday Economist johnashcroft.co.uk Where did the jobs come from? Saturday, 28 July, 2012 Over the last two years Wholesale, retail approximately 800, 000 and distribution, new jobs have been created accomodation, in the private sector. hotels and the information sector The public sector has shed particularly strong. jobs in administration and education. Financial, professional, The construction sector sciences, has also shed jobs with the healthcare, arts, labour force down by 2%, and other services a drop of 40,000. have also shown growth. Manufacturing employment has also Two thirds of the new jobs “Overall employment Is this evidence of re have been employee jobs continued to fall, in line growth has been in balancing, of course not. the balance have been in with long term trends. self employment. the service sector”. Economic growth and job creation is a function So where have the new of domestic demand and jobs come from? service sector growth.
- 6. The Saturday Economist johnashcroft.co.uk What happened in the world this week Saturday, 28 July, 2012 US growth in the second Speaking at a conference Ten year bond rates hit quarter up by 2.1% year in London, Mario Draghi 7.75% in Madrid prior on year. said that the ECB would to the Draghi statement. do “whatever it takes” News - the reality of a to support the single bail out of the Spanish currency. “Believe me, it economy could cost €385 will be enough,” he said billion. So what! emphatically. US Growth slows Gross domestic product, “The euro is like a grew at a weak 1.5% bumblebee. This is annual rate, the Commerce Euro hopes rally : a mystery of nature Department said Friday -- a Mario Draghi - the because it shouldn’t sharp slowing from the first President of the European quarter’s 2% pace and the fly but it does” Mario Central Bank triggered a fourth quarter’s 4.1%. rally on global markets Draghi. after hinting that it could OK but as we overlay our intervene to quell soaring Just as well as Spain preferred year on year borrowing costs in the entered the ring with the rate growth chart, the US eurozone periphery. Matador’s collecting bowl. recovery looks pretty solid.
- 7. The Saturday Economist johnashcroft.co.uk Markets : FTSE 5,627 : DOW 13,076 : Nasdaq 2,950 : DAX 6,600 Saturday, 28 July, 2012 FTSE 5,627 £:$ 1.575 DJIA 13,076 £:€ 1.278 NASDAQ 2,950 $:€ 1.232 DAX 6,600 $:¥ 78.74 CAC 3,250 Base Rate 0.50% Nikkei 10 yr UK 1.54% Hang Seng 19,250 10 yr US 1.54% 10 yr Euro 1.43% Brent Crude $ 106.47 Copper 343 WTI Crude $ 90.26 Corn 798 Gold $ 1.613.4 Wheat 898 Silver 5000 $ 2,743.1 Platinum $ 1,411.5
- 8. The Saturday Economist johnashcroft.co.uk Growth Inflation Unemployment Government Borrowing GDP in the second quarter Inflation CPI basis fell to Claimant count in June In the first four months to fell by 0.8% year on year as 2.4% in June. Inflation RPI increased slightly by 6,000 to June, Government was up the recovery of 2010 petered and RPIX fell to 2.8% from a level of just over 1.6 million by £4.5 billion. Borrowing out in 2011. 3.1%. and a rate of 4.9%. is likely to exceed the levels achieved in 2011/12. Growth in Q1 fell by 02%. In Manufacturing price inflation The LFS count fell slightly 2011 UK growth was up by fell to 2.3% in June, latest (three months to May) to a 0.8% and 1.8% in 2010 . earnings up by 1.8% in May. level of 2.58 million. 8.1%
- 9. The Saturday Economist johnashcroft.co.uk Indicator Period Latest Notes Source Inflation CPI June 2.4% ONS Inflation RPI June 2.8% .. ONS Inflation RPIX June 2.8% .. ONS Earnings May 1.8% ONS Retail Sales volume June 1.6% ONS Retail Sales value June 1.8% ONS Unemployment May 2.58 LFS Million trailing 3 months ONS Unemployment % May 8.1% LFS % trailing 3 month ONS Claimant count June 1.604m Million ONS PPIs output June 2.3% Manufacturing prices (output) ONS PPIs input June -2.3% Manufacturing prices ( input) ONS GDP growth Q2 2012 -0.8% year on year comparison ONS Manufacturing May -1.7% year on year growth ONS
- 10. The Saturday Economist johnashcroft.co.uk The Saturday Economist is a round up of the The publication of this document should not be week’s economics news for the UK published construed as the giving of investment advice. on the web site johnashcroft.co.uk. Forecasting is subject to frequent revision The information is also available as a PDF Please remember we are forecasting the output download. of the Office for National Statistics which may, of itself, be subject to revision. The information was originally published in short form in the Sunday Times and Croissants All views expressed in the Saturday Economist weekly blog post and has been expanded are my own. Information is intended to provide following requests for more information. a general outline of the subjects covered. It should neither be regarded as comprehensive The material in the Saturday Economist is nor sufficient for making decisions, nor should based upon information which we consider to it be used in place of professional advice. be reliable but we do not represent that it is accurate or complete and it should not be relied Neither the Saturday Economist or any upon as such. We accept no liability for errors, representative accept any responsibility for any or omissions of opinion or fact. loss arising from any action taken or not taken by anyone using this material. In particular, no reliance should be placed on Data adapted from the Office for the comments or trends in financial markets. John K Ashcroft National Statistics licensed under Open Government Licence .v.1.0.
- 11. The Saturday Economist johnashcroft.co.uk