SlideShare una empresa de Scribd logo
1 de 16
Descargar para leer sin conexión
SINGLE FAMILY RESIDENTIAL BREAKDOWN


January 2010                                                                                                                           1.3 % 7.4% %
                                                                                                            26.4 %                               0.3
                                                                                                                                                     0.1 %

Sales Start Off Strong in 2010
TORONTO - Wednesday, February 3, 2010                                                         7.4 %

Greater     Toronto    REALTORS®               The average home selling price in
reported      4,986     transactions           January 2010 climbed 19 per cent                  10.6 %                                                       46.4 %
through the Multiple Listing Service           to $409,058, compared to 343,632
(MLS®) in January 2010. This                   in the same month last year.
result represented a large increase
                                               “Expect strong annual 2.3 %
                                                                        growth rates                      Dwelling Type             Sales        %     Median
over the 2,670 sales in January                               21.5 %
                                                                           7.0 % %
                                                                                0.3
                                               for existing home sales and average  0.1 %               Single Detached 2,314
                                                                                                         Detached                               99     $445,000
2009 when the home sales were in
                                               price through the first quarter as we                    Semi Detached
                                                                                                         Semi-Detached                529 100          $345,500
a recessionary trough. Last month’s
                                               continue to make comparisons to                          Condo T.H.
                                                                                                         Condo Townhouse              370       99     $272,000
sales were slightly higher than the
                                               the weak market conditions at the
                                                  8.5 %
                                                                                                        Condo Apt.
                                                                                                         Condo Apt                  1,318 99           $270,000
January average in the five years                                                                       Link
                                               beginning of 2009,” said Jason                            Link                           67      99     $347,200
preceding 2009.                                                                                         Attached/Row
                                               Mercer, TREB’s Senior Manager of                          Att/Row/Twnhouse             370 100          $328,500
                                                                                                        Co-op Apt.
“The GTA housing market has                    Market Analysis. “The rate of sales %
                                                       12.0 %                          48.3
                                                                                                         Co-op Apt                      14      98     $178,500
                                                                                                        Detached Condo
                                                                                                         Det Condo                        4     97     $272,500
rebounded well from the lows in                and price growth will be lower in
sales experienced at the beginning             the second half of 2010.”
of 2009.       Sales climbed back                                                                           Housing Market Indicators
                                                                                                                        Jan. 2009             Jan. 2010     %Change
to healthy levels across the GTA
because the cost of home ownership                   Median Price                              Sales
                                                                                               New Listings
                                                                                                                            2,670
                                                                                                                           10,360
                                                                                                                                                 4,986
                                                                                                                                                10,021
                                                                                                                                                                (87%)
                                                                                                                                                                 (-3%)
remained affordable in the Toronto                                                             Active Listings*            20,450               12,052         (-41%)
                                                    In January, the median price               Days on Market                  49                   28         (-43%)
area,” said TREB President Tom
                                                                                               * All figures for single-family dwellings.
Lebour.     “Increasingly confident                 was    $350,000,        from       the
consumers moved to take advantage                   $303,000 recorded during

                                                                                              Inside
of affordable home ownership.”                      January of 2009.       n

                                                                                              District Map ............................................................. 2
                          Annual Average and Median Price                                     Price Category Breakdown......................................2
                                                                                              East District ............................................................. 3
                                                                                              West District ............................................................ 6
                                                                                              Toronto District ......................................................10
   500000             Average         Median
                                                                                              North District..........................................................12
   400000                                                                                     Annual Summary ...................................................16
   300000                                                                                     Single Family Comparison ....................................16

   200000
   100000
       0
            2000   2001   2002 2003   2004   2005   2006   2007   2008   2009   2010
District Map


                              Price Category Breakdown - January 2010
         Price Range         Total S.F.D   %S.F.D   Condo Apt. %Condo Apt. Condo T.H. %Condo T.H.
    -           -    $90,000        30        0.6         18        1.4           3         0.8
    $90,001     -   $100,000         8        0.2          5        0.4           1         0.3
    $100,001    -   $110,000        12        0.2          9        0.7            -          -
    $110,001    -   $120,000        21        0.4         16        1.2           3         0.8
    $120,001    -   $130,000        22        0.4         12        0.9           7         1.9
    $130,001    -   $140,000        27        0.5         20        1.5           4         1.1
    $140,001    -   $150,000        47        0.9         34        2.6           9         2.4
    $150,001    -   $160,000        51        1.0         35        2.7           7         1.9
    $160,001    -   $170,000        57        1.1         39        3.0           6         1.6
    $170,001    -   $180,000        70        1.4         42        3.2           9         2.4
    $180,001    -   $190,000        79        1.6         41        3.1          11         3.0
    $190,001    -   $200,000        73        1.5         39        3.0          16         4.3
    $200,001    -   $225,000       205        4.1        109        8.3          34         9.2
    $225,001    -   $250,000       316        6.3        140       10.6          38        10.3
    $250,001    -   $300,000       720      14.4         264       20.0          86        23.2
    $300,001    -   $400,000     1,364      27.4         321       24.4          96        25.9
    $400,001    -   $500,000       855      17.2         117        8.9          21         5.7
    $500,001    -   $750,000       724      14.5          42        3.2          15         4.1
    $750,001    - $1,000,000       168       3.4           7        0.5           2         0.5
    $1,000,001 - $1,500,000         87       1.7           4        0.3           2         0.5
    $1,500,001 -           -        50       1.0           4        0.3            -          -
    Total:                       4,986       100       1,318       100          370        100

2   TORONTO REAL ESTATE BOARD
East District


                                  Current Month: January 2010
Area    Active     New    Sales      $ Volume           Avg Price      Med Price     Avg DOM   Avg %List
E01      52          70      36      $15,214,780        $422,633        $420,000          23         103
E02      55          76      44      $25,282,928        $574,612        $530,149          15         103
E03     117         122      67      $25,058,250        $374,004        $381,000          24         101
E04     143         114      52      $14,886,800        $286,285        $294,000          24          99
E05      92          87      58      $17,429,898        $300,515        $276,000          25         101
E06      72          60      32      $12,194,300        $381,072        $350,450          22         102
E07      78          78      56      $18,857,400        $336,739        $352,000          39         100
E08     150         115      50      $14,170,100        $283,402        $318,000          31          98
E09     201         172      94      $23,594,818        $251,009        $249,050          28          98
E10      62          59      41      $15,527,700        $378,724        $366,500          25         100
E11     188         138      61      $16,262,702        $266,602        $256,000          31          98
E12      35          30      12       $3,730,700        $310,892        $302,400          23          99
E13     121          95      50      $16,329,722        $326,594        $325,500          22          99
E14     198         203     104      $33,710,040        $324,135        $310,000          24          98
E15     166         171      97      $28,431,750        $293,111        $283,500          25          99
E16     421         313     132      $30,098,653        $228,020        $212,000          35          97
E17     206         144      73      $18,701,190        $256,181        $248,000          36          98
E18      21           9       1         $623,500        $623,500        $623,500          93          96
E19      66          62      22       $7,853,488        $356,977        $328,000          26          99
E20      71          34      20       $6,227,100        $311,355        $273,500          52          97
E21     118          59      21       $8,145,400        $387,876        $355,000          57          98
TOTAL 2,633       2,211   1,123     $352,331,219        $313,741        $291,000          29          99


                                   Year-to-Date: January 2010
Area     Listed   Sales       $ Volume             Avg Price        Med Price      Avg DOM     Avg %List
E01         70       36      $15,214,780            $422,633         $420,000            23         103
E02         75       44      $25,282,928            $574,612         $530,149            15         103
E03        121       67      $25,058,250            $374,004         $381,000            24         101
E04        112       52      $14,886,800            $286,285         $294,000            24          99
E05         87       58      $17,429,898            $300,515         $276,000            25         101
E06         58       32      $12,194,300            $381,072         $350,450            22         102
E07         78       56      $18,857,400            $336,739         $352,000            39         100
E08        115       50      $14,170,100            $283,402         $318,000            31          98
E09        171       94      $23,594,818            $251,009         $249,050            28          98
E10         59       41      $15,527,700            $378,724         $366,500            25         100
E11        136       61      $16,262,702            $266,602         $256,000            31          98
E12         30       12       $3,730,700            $310,892         $302,400            23          99
E13         95       50      $16,329,722            $326,594         $325,500            22          99
E14        203      104      $33,710,040            $324,135         $310,000            24          98
E15        170       97      $28,431,750            $293,111         $283,500            25          99
E16        312      132      $30,098,653            $228,020         $212,000            35          97
E17        144       73      $18,701,190            $256,181         $248,000            36          98
E18          9        1         $623,500            $623,500         $623,500            93          96
E19         62       22       $7,853,488            $356,977         $328,000            26          99
E20         34       20       $6,227,100            $311,355         $273,500            52          97
E21         57       21       $8,145,400            $387,876         $355,000            57          98
TOTAL    2,198    1,123     $352,331,219            $313,741         $291,000            29          99


                                                                       TORONTO REAL ESTATE BOARD       3
SINGLE FAMILY EAST BREAKDOWN - JANuARY 2010                             East District


                            East District                                                     East District
      80                   Days on Market                               80             Sales Active Listing Ratio

      60                                                                60


      40                                                                40


      20                                                                20


       0                                                                 0
            Jan Feb Mar Apr May Jun   Jul Aug Sep Oct Nov Dec Jan            Jan Feb Mar Apr May Jun   Jul Aug Sep Oct Nov Dec Jan

           2009                                            2010              2009                                           2010


     Detached Houses                                                  Semi-Detached Houses
Area Act Sales Av. Price               Med. Price % S-A Av. % List Area Act Sales Av. Price Med. Price % S-A Av. % List
E01         12     10     $558,700      $478,500 83.3           105   E01    25        12     $382,707       $376,050      48.0      102
E02         23     13     $801,602      $655,000 56.5           104   E02    16        18     $533,822       $530,149     112.5      104
E03         49     30     $501,142      $486,500 61.2           102   E03    18        11     $418,927       $435,000      61.1      102
E04         46     23     $350,739      $365,000 50.0           100   E04     6         3     $292,100       $285,300      50.0      101
E05         18     12     $467,042      $440,000 66.7           106   E05     1         4     $360,000       $352,000     400.0       99
E06         53     27     $391,385      $365,000 50.9           102   E06    12         2     $295,500       $295,500      16.7       98
E07         24     24     $440,604      $422,900 100.0          102   E07     3         6     $348,383       $346,500     200.0      105
E08         63     24     $369,163      $349,000 38.1            99   E08     5         3     $261,000       $265,000      60.0       95
E09         39     23     $310,522      $330,000 59.0           100   E09     2         5     $290,220       $281,000     250.0       98
E10         47     27     $410,533      $380,000 57.5           100   E10     3         6     $351,050       $357,450     200.0      101
E11         45     23     $370,670      $386,000 51.1            98   E11    22         6     $261,833       $262,000      27.3       99
E12         18      9     $321,556      $313,000 50.0            99   E12     1         -            -              -         -        -
E13         67     23     $413,761      $398,000 34.3            99   E13     5         3     $304,341       $355,000      60.0      100
E14        142     67     $365,574      $354,500 47.2            98   E14    10        11     $284,755       $285,000     110.0       98
E15        115     68     $318,151      $311,500 59.1            99   E15     3         2     $253,625       $253,625      66.7      101
E16        312     92     $253,639      $244,500 29.5            97   E16    40        23     $178,426       $175,000      57.5       98
E17        146     47     $284,855      $280,000 32.2            97   E17     3         2     $190,000       $190,000      66.7       99
E18         21      1     $623,500      $623,500   4.8           96   E18     -         -            -              -         -        -
E19         60     17     $383,271      $360,000 28.3            98   E19     -         -            -              -         -        -
E20         66     19     $315,900      $275,000 28.8            97   E20     -         -            -              -         -        -
E21        111     20     $397,445      $375,000 18.0            98   E21     4         1     $196,500       $196,500      25.0       98


4     TORONTO REAL ESTATE BOARD
SINGLE FAMILY EAST BREAKDOWN - JANuARY 2010                           East District


     Condo Apartment                                                     Link
Area Act Sales Av. Price    Med. Price % S-A Av. % List Area Act      Sales Av. Price      Med. Price % S-A Av. % List
E01    10    3   $339,933    $289,900 30.0      105    E01        -       -        -           -          -            -
E02     3    5   $327,200    $301,000 166.7     100    E02        -       -        -           -          -            -
E03    40   24   $188,054    $148,000 60.0       98    E03        -       -        -           -          -            -
E04    72   19   $189,211    $207,000 26.4       97    E04       1        -        -           -          -            -
E05    54   25   $217,048    $205,000 46.3       99    E05       4        4     $388,375    $400,250    100.0        100
E06     1    1   $296,000    $296,000 100.0     110    E06        -       1     $349,900    $349,900      -          100
E07    45   17   $195,082    $200,000 37.8       97    E07       1        2     $313,600    $313,600    200.0        91
E08    58   17   $177,476    $169,000 29.3       97    E08        -       -        -           -          -            -
E09   125   57   $230,556    $234,000 45.6       98    E09        -       -        -           -          -            -
E10     3    1   $120,000    $120,000 33.3       97    E10       1        -        -           -          -            -
E11    72   16   $118,707    $110,400 22.2       96    E11       4        2     $307,594    $307,594     50.0        100
E12     1    -          -           -     -       -    E12        -       -        -           -          -            -
E13    16    7   $196,071    $175,000 43.8       99    E13       1        -        -           -          -            -
E14     6    8   $183,563    $177,750 133.3      98    E14       6        -        -           -          -            -
E15    26    7   $236,857    $225,000 26.9       98    E15       5        4     $257,325    $261,500     80.0         96
E16    17    -          -           -     -       -    E16       6        3     $181,333    $180,000     50.0         93
E17    10    5   $158,080    $148,500 50.0       97    E17       20       8     $251,099    $249,000     40.0         99
E18     -    -          -           -     -       -    E18        -       -        -           -          -            -
E19     -    -          -           -     -       -    E19       1        2     $288,500    $288,500    200.0        100
E20     3    -          -           -     -       -    E20       1        1     $225,000    $225,000    100.0         98
E21     2    -          -           -     -       -    E21        -       -        -           -          -            -


     Condo Townhouse                                       Detached Condo
Area Act Sales Av. Price Med. Price % S-A Av. % List Area Act Sales Av. Price              Med. Price % S-A Av. % List
E01    -     5   $299,400   $295,000     -      100   E01    -        -              -          -        -       -
E02    8     4   $454,075   $485,950 50.0       100   E02    -        -              -          -        -       -
E03    7     -          -          -     -        -   E03    -        -              -          -        -       -
E04   11     6   $336,750   $328,750 54.6       100   E04    -        -              -          -        -       -
E05   14    12   $255,575   $247,400 85.7       101   E05    -        -              -          -        -       -
E06    1     -          -          -     -        -   E06    -        -              -          -        -       -
E07    2     5   $315,800   $298,000 250.0      101   E07    -        -              -          -        -       -
E08   19     5   $239,800   $232,000 26.3        98   E08    -        -              -          -        -       -
E09   29     8   $192,063   $202,500 27.6        97   E09    -        -              -          -        -       -
E10    5     2   $206,000   $206,000 40.0        97   E10    -        -              -          -        -       -
E11   33     3   $223,667   $195,000   9.1       98   E11    -        1       $201,000   $201,000        -      96
E12    9     3   $278,900   $298,900 33.3       100   E12    -        -              -          -        -       -
E13   19     9   $256,000   $283,000 47.4        98   E13    -        -              -          -        -       -
E14   18     3   $207,583   $229,000 16.7        97   E14    -        -              -          -        -       -
E15    9     6   $191,900   $196,000 66.7        98   E15    -        -              -          -        -       -
E16   36    11   $134,827   $127,500 30.6        97   E16    -        -              -          -        -       -
E17    6     2   $160,000   $160,000 33.3        98   E17    -        -              -          -        -       -
E18    -     -          -          -     -        -   E18    -        -              -          -        -       -
E19    -     -          -          -     -        -   E19    -        -              -          -        -       -
E20    1     -          -          -     -        -   E20    -        -              -          -        -       -
E21    1     -          -          -     -        -   E21    -        -              -          -        -       -


                                                                               TORONTO REAL ESTATE BOARD              5
SINGLE FAMILY EAST BREAKDOWN - JANuARY 2010                    East District
           Co-op Apartment                                     Attached/Row/Townhouse
Area Act Sales          Av. Price   Med. Price % S-A Av. % List Area Act Sales     Av. Price   Med. Price % S-A Av. % List
E01        -       -           -            -      -      -    E01    5       6   $419,750     $442,500   120.0      102
E02        -       1    $330,000     $330,000      -     97    E02    5       3   $490,333     $361,000    60.0      104
E03        -       -           -            -      -      -    E03    3       2   $451,250     $451,250    66.7       98
E04        -       -           -            -      -      -    E04    7       1   $328,000     $328,000    14.3       99
E05        -       -           -            -      -      -    E05    1       1   $338,800     $338,800   100.0      108
E06        -       -           -            -      -      -    E06    5       1   $390,000     $390,000    20.0       98
E07        -       -           -            -      -      -    E07    3       2   $335,000     $335,000    66.7      106
E08        -       -           -            -      -      -    E08    5       1   $311,100     $311,100    20.0      104
E09        1       -           -            -      -      -    E09    5       1   $323,500     $323,500    20.0       98
E10        -       -           -            -      -      -    E10    3       5   $361,000     $344,000   166.7      102
E11        -       -           -            -      -      -    E11   12      10   $277,980     $255,000    83.3       98
E12        -       -           -            -      -      -    E12    6       -          -            -       -        -
E13        -       -           -            -      -      -    E13   13       8   $277,963     $275,500    61.5       98
E14        -       -           -            -      -      -    E14   16      15   $266,200     $272,500    93.8       99
E15        -       -           -            -      -      -    E15    8      10   $245,150     $245,500   125.0      100
E16        1       -           -            -      -      -    E16    9       3   $211,000     $220,000    33.3       99
E17        -       -           -            -      -      -    E17   21       9   $201,533     $200,500    42.9       98
E18        -       -           -            -      -      -    E18    -       -          -            -       -        -
E19        -       -           -            -      -      -    E19    5       3   $253,629     $249,888    60.0       99
E20        -       -           -            -      -      -    E20    -       -          -            -       -        -
E21        -       -           -            -      -      -    E21    -       -          -            -       -        -


                                                                                                    West District
                                             Current Month: January 2010
    Area       Active      New       Sales       $ Volume        Avg Price         Med Price     Avg DOM    Avg %List
W01      52                  57         32       $15,493,767     $484,180           $385,635           26          102
W02      71                  72         46       $21,558,004     $468,652           $414,000           20          105
W03     117                  91         36       $11,559,000     $321,083           $325,000           24          101
W04     187                 114         62       $19,957,250     $321,891           $317,000           36           98
W05     314                 191         70       $20,293,200     $289,903           $302,500           34           97
W06     152                 106         63       $24,424,554     $387,691           $349,000           28           99
W07      65                  80         38       $17,613,013     $463,500           $476,500           17          101
W08     140                 121         66       $35,831,300     $542,898           $379,500           33           99
W09     118                  73         28        $8,214,578     $293,378           $272,000           29           96
W10     285                 177         59       $14,577,400     $247,075           $212,500           35           97
W12     158                 126         59       $26,961,686     $456,978           $370,500           38           97
W13     142                 108         33       $25,197,500     $763,561           $493,000           21           99
W14      68                  54         30       $10,744,599     $358,153           $352,500           33           98
W15     302                 286        140       $38,163,965     $272,600           $240,000           25           98
W16      83                  98         58       $24,171,360     $416,748           $389,500           30           99
W17       -                   -          -                 -            -                  -            -            -
W18      88                  42         30        $8,395,651     $279,855           $280,500           35           97
W19     243                 242        117       $45,907,815     $392,374           $375,000           19           99
W20     213                 263        138       $57,401,216     $415,951           $397,250           17           99
W21     270                 204        115       $70,357,887     $611,808           $539,999           28           98
W22      84                 124         91       $34,801,300     $382,432           $368,000           16           99
W23     532                 533        300      $100,624,975     $335,417           $327,625           28           98
W24     435                 384        199       $73,117,301     $367,424           $349,900           27           98
W25      78                  51         32       $12,176,350     $380,511           $326,000           38           98
W26      27                   9          5        $2,780,500     $556,100           $482,500          115           95
W27     129                  95         58       $23,451,100     $404,329           $392,950           33           98
W28     156                  84         43       $20,571,800     $478,414           $448,000           35           98
W29     105                  74         32        $9,717,513     $303,672           $255,450           33           97
TOTAL 4,614               3,859      1,979      $773,769,584     $390,990           $346,000           27           99


6      TORONTO REAL ESTATE BOARD
SINGLE FAMILY WEST BREAKDOWN - JANuARY 2010                            West District


                        West District                                                      West District
   80                  Days on Market                                80             Sales Active Listing Ratio

   60                                                                60


   40                                                                40


   20                                                                20


    0                                                                 0
        Jan Feb Mar Apr May Jun   Jul Aug Sep Oct Nov Dec Jan             Jan Feb Mar Apr May Jun   Jul Aug Sep Oct Nov Dec jan

        2009                                           2010               2009                                            2010


                                                Year-to-Date: January 2010
Area       Listed       Sales             $ Volume              Avg Price           Med Price         Avg DOM         Avg %List
W01      57                 32          $15,493,767              $484,180             $385,635                26                  102
W02      72                 46          $21,558,004              $468,652             $414,000                20                  105
W03      90                 36          $11,559,000              $321,083             $325,000                24                  101
W04    114                  62          $19,957,250              $321,891             $317,000                36                   98
W05    190                  70          $20,293,200              $289,903             $302,500                34                   97
W06    106                  63          $24,424,554              $387,691             $349,000                28                   99
W07      79                 38          $17,613,013              $463,500             $476,500                17                  101
W08    121                  66          $35,831,300              $542,898             $379,500                33                   99
W09      73                 28           $8,214,578              $293,378             $272,000                29                   96
W10    174                  59          $14,577,400              $247,075             $212,500                35                   97
W12    123                  59          $26,961,686              $456,978             $370,500                38                   97
W13    107                  33          $25,197,500              $763,561             $493,000                21                   99
W14      54                 30          $10,744,599              $358,153             $352,500                33                   98
W15    284                 140          $38,163,965              $272,600             $240,000                25                   98
W16      98                 58          $24,171,360              $416,748             $389,500                30                   99
W17       -                  -                    -                     -                    -                 -                    -
W18      42                 30           $8,395,651              $279,855             $280,500                35                   97
W19    242                 117          $45,907,815              $392,374             $375,000                19                   99
W20    262                 138          $57,401,216              $415,951             $397,250                17                   99
W21    203                 115          $70,357,887              $611,808             $539,999                28                   98
W22    124                  91          $34,801,300              $382,432             $368,000                16                   99
W23    530                 300         $100,624,975              $335,417             $327,625                28                   98
W24    379                 199          $73,117,301              $367,424             $349,900                27                   98
W25      51                 32          $12,176,350              $380,511             $326,000                38                   98
W26       9                  5           $2,780,500              $556,100             $482,500               115                   95
W27      95                 58          $23,451,100              $404,329             $392,950                33                   98
W28      84                 43          $20,571,800              $478,414             $448,000                35                   98
W29      73                 32           $9,717,513              $303,672             $255,450                33                   97
TOTAL 3,836              1,979         $773,769,584              $390,990             $346,000                27                   99


                                                                                        TORONTO REAL ESTATE BOARD                  7
SINGLE FAMILY WEST BREAKDOWN - JANuARY 2010                West District
     Detached Houses                                          Semi-Detached Houses
Area Act Sales Av. Price       Med. Price % S-A Av. % List Area Act Sales Av. Price Med. Price % S-A Av. % List
W01     20    11  $786,102    $761,000    55.0     101   W01    4      4    $410,348    $424,697   100.0    112
W02     28    14  $656,109    $527,294    50.0     103   W02   17     17    $406,937    $403,000   100.0    105
W03     67    23  $329,978    $329,000    34.3     102   W03   32      8    $367,438    $352,000    25.0    100
W04     70    28  $432,234    $437,500    40.0      99   W04   13      6    $359,917    $368,250    46.2     99
W05     59    16  $454,744    $430,500    27.1      99   W05   53     23    $328,174    $326,500    43.4     98
W06     35    15  $424,367    $435,000    42.9     100   W06    4      2    $414,000    $414,000    50.0    100
W07     31    14  $566,542    $537,350    45.2     104   W07    -      -           -           -       -      -
W08     85    25  $996,236    $761,200    29.4     100   W08    -      1    $429,000    $429,000       -    102
W09     30    11  $491,091    $460,000    36.7     100   W09    5      1    $328,800    $328,800    20.0    100
W10     63    22  $351,623    $347,500    34.9      97   W10    7      4    $329,250    $313,250    57.1     99
W12    104    25  $649,260    $565,000    24.0      97   W12    4      6    $374,798    $375,250   150.0     99
W13     90    18 $1,199,556 $1,015,000    20.0      99   W13    8      5    $336,500    $335,000    62.5     97
W14     12    11  $558,455    $526,500    91.7     100   W14    4      3    $417,467    $417,500    75.0     97
W15     12    10  $535,580    $505,000    83.3      99   W15    3      7    $382,214    $360,000   233.3     99
W16     40    29  $504,828    $451,000    72.5      99   W16   17     11    $345,236    $345,500    64.7    102
W17      -     -          -          -       -       -   W17    -      -           -           -       -      -
W18     29    13  $311,662    $325,000    44.8      96   W18   20     11    $273,705    $279,500    55.0     97
W19     79    39  $564,842    $515,000    49.4      99   W19   23     18    $388,100    $392,000    78.3    101
W20     71    56  $543,737    $515,750    78.9     100   W20   35     35    $380,186    $378,000   100.0    100
W21    172    83  $696,846    $615,000    48.3      98   W21    3      3    $410,633    $395,000   100.0    100
W22     52    42  $470,431    $456,500    80.8      98   W22   16     10    $338,950    $336,250    62.5    101
W23    325   170   $379,195   $370,000    52.3      98   W23   94     71    $294,357    $289,000    75.5     98
W24    270   115   $455,193   $451,000    42.6      98   W24   41     28    $303,214    $295,250    68.3     98
W25     44    12   $545,867   $431,250    27.3      98   W25    2      2    $349,500    $349,500   100.0    103
W26     27     5   $556,100   $482,500    18.5      95   W26    -      -           -           -       -      -
W27    110    48   $435,804   $423,250    43.6      99   W27    2      2    $320,500    $320,500   100.0     98
W28    145    35   $512,880   $465,000    24.1      98   W28    1      6    $336,667    $335,000   600.0     99
W29     75    22   $336,673   $298,000    29.3      97   W29    7      1    $231,900    $231,900    14.3     98


      Condo Apartment                                                 Link
Area Act Sales     Av. Price   Med. Price % S-A Av. % List Area Act Sales   Av. Price   Med. Price % S-A Av. % List
W01    20 10       $285,325    $269,000   50.0    98     W01    -      -            -          -        -       -
W02    16 10       $352,015    $348,950   62.5   105     W02    -      -            -          -        -       -
W03    13   5      $206,000    $220,000   38.5    99     W03    -      -            -          -        -       -
W04    71 17       $157,224    $157,000   23.9    96     W04    -      -            -          -        -       -
W05   111 16       $136,906    $139,000   14.4    96     W05    -      -            -          -        -       -
W06   103 41       $353,977    $333,888   39.8    99     W06    -      -            -          -        -       -
W07    28 15       $319,867    $282,000   53.6    99     W07    -      -            -          -        -       -
W08    48 36       $255,997    $221,750   75.0    98     W08    -      -            -          -        -       -
W09    70 14       $133,127    $117,000   20.0    93     W09    -      -            -          -        -       -
W10   156 29       $161,990    $158,000   18.6    97     W10    1      -            -          -        -       -
W12    35 19       $253,911    $240,000   54.3    97     W12    -      -            -          -        -       -
W13    12   2      $148,000    $148,000   16.7    96     W13    -      -            -          -        -       -
W14    23   3      $198,000    $205,000   13.0    97     W14    -      -            -          -        -       -
W15   253 107      $235,464    $230,000   42.3    98     W15    -      -            -          -        -       -
W16    15   5      $371,600    $338,500   33.3    98     W16    -      2     $407,000   $407,000        -     102
W17     -   -             -           -      -     -     W17    -      -            -          -        -       -
W18    18   3      $173,500    $156,500   16.7    98     W18    -      -            -          -        -       -
W19   100 30       $232,317    $205,501   30.0    97     W19    2      4     $411,500   $411,500    200.0      97
W20    38   9      $211,881    $232,000   23.7    97     W20    6      2     $414,000   $414,000     33.3     101
W21    60   6      $362,648    $272,495   10.0    97     W21    1      -            -          -        -       -
W22     2   1      $196,000    $196,000   50.0   100     W22    -      -            -          -        -       -
W23    31   8      $190,244    $186,000   25.8    96     W23    -      2     $358,950   $358,950        -      97
W24    44 20       $167,185    $171,000   45.5    97     W24    1      1     $268,000   $268,000    100.0      96
W25    12   7      $210,393    $214,000   58.3    98     W25    -      1     $312,000   $312,000        -      97
W26     -   -             -           -      -     -     W26    -      -            -          -        -       -
W27     -   4      $232,750    $256,000      -    98     W27    1      -            -          -        -       -
W28     3   -             -           -      -     -     W28    -      -            -          -        -       -
W29    14   1      $369,900    $369,900    7.1   100     W29    -      -            -          -        -       -
8     TORONTO REAL ESTATE BOARD
SINGLE FAMILY WEST BREAKDOWN - JANuARY 2010                West District
     Condo Townhouse                                       Detached Condo
Area Act Sales Av. Price Med. Price % S-A Av. % List Area Act Sales Av. Price       Med. Price % S-A Av. % List
W01    5    5    $365,600    $363,000 100.0    104     W01    -     -           -              -       -         -
W02    5    1    $357,900    $357,900 20.0      99     W02    -     -           -              -       -         -
W03    2    -           -           -     -      -     W03    -     -           -              -       -         -
W04   29    7    $249,843    $245,500 24.1      98     W04    -     -           -              -       -         -
W05   84   13    $224,215    $218,000 15.5      98     W05    -     -           -              -       -         -
W06    4    1    $482,000    $482,000 25.0      99     W06    -     -           -              -       -         -
W07    -    -           -           -     -      -     W07    -     -           -              -       -         -
W08    5    4    $320,125    $313,500 80.0     102     W08    -     -           -              -       -         -
W09    7    1    $289,000    $289,000 14.3     100     W09    -     -           -              -       -         -
W10   55    3    $153,000    $173,500   5.5     95     W10    -     -           -              -       -         -
W12   11    8    $414,638    $297,000 72.7      98     W12    1     -           -              -       -         -
W13   31    7    $196,714    $195,000 22.6      97     W13    -     -           -              -       -         -
W14   28   12    $194,600    $151,250 42.9      97     W14    -     -           -              -       -         -
W15   34   16    $308,624    $281,500 47.1      99     W15    -     -           -              -       -         -
W16   10   10    $270,176    $249,750 100.0     98     W16    -     -           -              -       -         -
W17    -    -           -           -     -      -     W17    -     -           -              -       -         -
W18   18    3    $270,933    $294,000 16.7      98     W18    -     -           -              -       -         -
W19   30   21    $306,645    $312,000 70.0      99     W19    -     -           -              -       -         -
W20   45   28    $283,411    $270,450 62.2     100     W20    -     -           -              -       -         -
W21   15    5    $277,400    $290,000 33.3      97     W21    -     -           -              -       -         -
W22    3    3    $210,333    $217,000 100.0     96     W22    -     -           -              -       -         -
W23   47   14    $228,507    $239,000 29.8      98     W23    -     -           -              -       -         -
W24   45   15    $197,633    $194,000 33.3      97     W24    4     -           -              -       -         -
W25   10    8    $302,813    $282,500 80.0      98     W25    -     -           -              -       -         -
W26    -    -           -           -     -      -     W26    -     -           -              -       -         -
W27   12    3    $225,167    $212,000 25.0      96     W27    -     -           -              -       -         -
W28    3    -           -           -     -      -     W28    -     -           -              -       -         -
W29    7    2    $189,250    $189,250 28.6      98     W29    -     -           -              -       -         -


      Co-op Apartment                                    Attached/Row/Townhouse
Area Act Sales Av. Price    Med. Price % S-A Av. % List Area Act Sales Av. Price Med. Price % S-A Av. % List
W01    -    1    $169,000    $169,000     -     97    W01     3     1   $355,000    $355,000        33.3    93
W02    -    -           -           -     -      -    W02     5     4   $394,125    $373,250        80.0   107
W03    -    -           -           -     -      -    W03     3     -          -           -           -     -
W04    -    -           -           -     -      -    W04     4     4   $318,375    $317,000       100.0   100
W05    3    1     $84,000     $84,000 33.3      93    W05     4     1   $280,000    $280,000        25.0    97
W06    2    -           -           -     -      -    W06     4     4   $559,000    $545,000       100.0   102
W07    1    1    $122,500    $122,500 100.0     98    W07     5     8   $595,116    $592,013       160.0   101
W08    2    -           -           -     -      -    W08     -     -          -           -           -     -
W09    5    -           -           -     -      -    W09     1     1   $331,000    $331,000       100.0    95
W10    2    -           -           -     -      -    W10     1     1   $368,000    $368,000       100.0    97
W12    -    -           -           -     -      -    W12     3     1   $340,000    $340,000        33.3    99
W13    -    -           -           -     -      -    W13     1     1   $250,000    $250,000       100.0   122
W14    -    -           -           -     -      -    W14     1     1   $419,999    $419,999       100.0    98
W15    -    -           -           -     -      -    W15     -     -          -           -           -     -
W16    -    -           -           -     -      -    W16     1     1   $360,000    $360,000       100.0   100
W17    -    -           -           -     -      -    W17     -     -          -           -           -     -
W18    -    -           -           -     -      -    W18     3     -          -           -           -     -
W19    1    -           -           -     -      -    W19     8     5   $367,630    $365,500        62.5   100
W20    -    -           -           -     -      -    W20    18     8   $371,875    $381,500        44.4    98
W21    -    -           -           -     -      -    W21    19    18   $429,161    $361,050        94.7    99
W22    -    -           -           -     -      -    W22    11    35   $309,334    $305,000       318.2   100
W23    -    -           -           -     -      -    W2 3   35    35   $280,671    $279,900       100.0    98
W24    -    -           -           -     -      -    W24    30    20   $285,195    $289,000        69.0    98
W25    2    -           -           -     -      -    W25     8     2   $359,850    $359,850        25.0   100
W26    -    -           -           -     -      -    W26     -     -          -           -           -     -
W27    -    -           -           -     -      -    W27     4     1   $285,000    $285,000        25.0    98
W28    -    -           -           -     -      -    W28     4     2   $300,500    $300,500        50.0   100
W29    -    -           -           -     -      -    W29     2     6   $221,733    $227,750       300.0    98
                                                                        TORONTO REAL ESTATE BOARD          9
Central District
                                               Current Month: January 2010
Area       Active          New         Sales         $ Volume           Avg Price            Med Price        Avg DOM         Avg%List
C01     484               479           210         $87,540,052          $416,857             $363,650                23               101
C02     142                97            34         $25,175,103          $740,444             $574,000                31               101
C03      87                58            32         $22,508,900          $703,403             $412,450                29                99
C04     139               145            63         $47,910,734          $760,488             $735,000                25               102
C06      49                38            18          $9,327,100          $518,172             $470,000                20                98
C07     182               179            91         $37,869,368          $416,147             $353,000                23               100
C08     201               210           100         $37,305,295          $373,053             $335,045                16               101
C09      55                44            13         $15,210,180        $1,170,014            $679,000                 16               101
C10     100               106            45         $29,993,000          $666,511             $580,000                17               104
C11      60                45            24         $12,259,400          $510,808             $430,500                20               100
C12      99                59            21         $29,984,850        $1,427,850           $1,250,000                44                98
C13      79                84            33         $12,720,914          $385,482             $325,000                25               100
C14     173               189           117         $53,306,588          $455,612             $342,000                22               101
C15     168               162            81         $35,628,350          $439,856             $333,000                25               100
TOTAL 2,018             1,895           882        $456,739,834          $517,846             $385,000                23               101


                         Central District                                                    Central District
     80                  Days on Market                                   80             Sales Active Listing Ratio

     60                                                                   60


     40                                                                   40


     20                                                                   20


                                                                           0
      0                                                                        Jan Feb Mar Apr May Jun   Jul Aug Sep Oct Nov Dec Jan
          Jan Feb Mar Apr May Jun   Jul Aug Sep Oct Nov Dec Jan

          2009                                            2010                 2009                                           2010


                                                  Year-to-Date: January 2010
Area         Listed       Sales               $ Volume             Avg Price           Med Price           Avg DOM           Avg%List
 C01            475         210              $87,540,052            $416,857            $363,650                23              101
 C02             97          34              $25,175,103            $740,444            $574,000                31              101
 C03             58          32              $22,508,900            $703,403            $412,450                29               99
 C04            143          63              $47,910,734            $760,488            $735,000                25              102
 C06             38          18               $9,327,100            $518,172            $470,000                20               98
 C07            179          91              $37,869,368            $416,147            $353,000                23              100
 C08            209         100              $37,305,295            $373,053            $335,045                16              101
 C09             44          13              $15,210,180          $1,170,014            $679,000                16              101
 C10            106          45              $29,993,000           $666,511            $580,000                 17              104
 C11             45          24              $12,259,400           $510,808            $430,500                 20              100
 C12             59          21              $29,984,850          $1,427,850          $1,250,000                44               98
 C13             83          33              $12,720,914           $385,482            $325,000                 25              100
 C14            189         117              $53,306,588           $455,612            $342,000                 22              101
 C15            162          81              $35,628,350           $439,856            $333,000                 25              100
 TOTAL        1,887         882             $456,739,834           $517,846            $385,000                 23              101


10   TORONTO REAL ESTATE BOARD
SINGLE FAMILY CENTRAL BREAKDOWN - JANuARY 2010                     Central District
     Detached Houses                                         Semi-Detached Houses
Area Act Sales Av. Price       Med. Price % S-A Av. % List Area Act Sales Av. Price Med. Price % S-A Av.% List
C01     9    -             -          -       -     -     C01   22       10      $620,150        $606,500  45.5         98
C02    25    7     $869,357   $630,000     28.0    98     C02   27        8      $667,263        $598,500  29.6        102
C03    49   19     $811,168   $575,000     38.8    99     C03   10        8      $494,588        $366,850  80.0        101
C04    95   43     $956,309   $918,600     45.3   103     C04    1        2      $675,875        $675,875 200.0        111
C06    32   10     $728,690   $608,450     31.3    98     C06    2        -             -               -     -          -
C07    55   21      $665,185   $565,000    38.2    99     C07    5        2     $456,000         $456,000  40.0        101
C08     5    -             -          -       -     -     C08    7        5     $631,000         $629,000  71.4         99
C09    30    4    $2,201,250 $2,152,500    13.3   100     C09    1        3    $1,050,060        $615,000 300.0        101
C10    37   17      $932,647   $735,000    46.0   105     C10    3        2     $679,000         $679,000  66.7        109
C11    12   10      $890,550   $877,500    83.3   103     C11    -        2     $610,000         $610,000     -        103
C12    76   13    $1,838,231 $1,650,000    17.1    97     C12    1        1     $562,000         $562,000 100.0        113
C13    13    7      $667,714   $655,000    53.9   101     C13    6        2     $450,000         $450,000  33.3        105
C14    55   25      $852,460   $725,000    45.5   101     C14    -        -             -               -     -          -
C15    32   17      $847,347   $818,000    53.1   101     C15   13        3     $438,333         $437,000  23.1        100


     Condo Apartment                                                        Link
Area Act Sales Av. Price       Med. Price % S-A Av. % List Area Act      Sales Av. Price        Med. Price % S-A Av.% List
C01   422   182    $397,402     $351,000   43.1   101     C01        -     -            -               -          -     -
C02    72    13    $629,500     $431,000   18.1   101     C02        -     -            -               -          -     -
C03    19     3    $941,000     $535,000   15.8    97     C03        -     -            -               -          -     -
C04    34    14    $295,364     $292,500   41.2    97     C04        -     -            -               -          -     -
C06    13     8    $255,025     $253,900   61.5    99     C06        -     -            -               -          -     -
C07   100    58    $325,724     $314,000   58.0   101     C07        -     -            -               -          -     -
C08   174    82    $347,644     $325,625   47.1   102     C08        -     -            -               -          -     -
C09    17     4    $488,750     $495,000   23.5   101     C09        -     -            -               -          -     -
C10    49    24    $438,583     $406,000   49.0   102     C10        -     -            -               -          -     -
C11    38    11    $181,627     $189,900   29.0    96     C11        -     -            -               -          -     -
C12    19     5    $871,370     $584,250   26.3    97     C12        -     -            -               -          -     -
C13    57    21    $266,495     $257,000   36.8    98     C13        -     -            -               -          -     -
C14   106    86    $332,321     $319,500   81.1   101     C14        -     -            -               -          -     -
C15   106    42    $335,964     $309,500   39.6   100     C15        -     3     $453,600        $455,300          -   103


      Condo Townhouse                                           Detached Condo
Area Act Sales     Av. Price   Med. Price % S-A Av. % List Area Act Sales       Av. Price       Med. Price % S-A Av.% List
C01   21    14     $492,021   $428,050     66.7    101    C01    -         -                -           -      -             -
C02    7     -             -          -       -      -    C02    -         -                -           -      -             -
C03    1     -             -          -       -      -    C03    -         -                -           -      -             -
C04    -     1     $605,100   $605,100        -    101    C04    -         -                -           -      -             -
C06    1     -             -          -       -      -    C06    -         -                -           -      -             -
C07   14     7     $348,811   $360,000     50.0    100    C07    -         -                -           -      -             -
C08    8     4     $281,000   $294,501     50.0    100    C08    -         -                -           -      -             -
C09    1     -             -          -       -      -    C09    -         -                -           -      -             -
C10    7     2    $1,127,000 $1,127,000    28.6     97    C10    1         -                -           -      -             -
C11   10     1      $136,000   $136,000    10.0     98    C11    -         -                -           -      -             -
C12    3     2      $584,500   $584,500    66.7     99    C12    -         -                -           -      -             -
C13    -     1      $478,513   $478,513       -    105    C13    -         -                -           -      -             -
C14    7     2      $542,500   $542,500    28.6     99    C14    -         -                -           -      -             -
C15   17    16      $277,324   $252,000    94.1     99    C15    -         -                -           -      -             -


                                                                                TORONTO REAL ESTATE BOARD               11
SINGLE FAMILY CENTRAL BREAKDOWN - JANuARY 2010               Central District


        Co-op Apartment                                     Attached/Row/Townhouse
Area Act Sales       Av. Price   Med. Price % S-A Av. % List Area Act Sales    Av. Price    Med. Price % S-A Av. % List
C01     -       -           -            -     -      -    C01     10       4 $530,750    $511,500 40.0          103
C02     4       1    $175,000     $175,000 25.0      96    C02      7       5 $1,078,600 $1,170,000 71.4         103
C03     7       2    $158,500     $158,500 28.6      96    C03      1       -          -          -    -           -
C04     8       2    $120,000     $120,000 25.0      95    C04      1       1 $457,500    $457,500 100.0         100
C06     -       -           -            -     -      -    C06      1       -          -          -    -           -
C07     -       -           -            -     -      -    C07      8       3 $551,600    $545,000 37.5           99
C08     1       3    $227,333     $250,000 300.0     97    C08      6       6 $639,583    $600,000 100.0          96
C09     6       1    $451,000     $451,000 16.7     116    C09      -       1 $849,000    $849,000     -         100
C10     1       -           -            -     -      -    C10      2       -          -          -    -           -
C11     -       -           -            -     -      -    C11      -       -          -          -    -           -
C12     -       -           -            -     -      -    C12      -       -          -          -    -           -
C13     1       -           -            -     -      -    C13      2       2 $536,000    $536,000 100.0         102
C14     1       1    $187,500     $187,500 100.0    104    C14      4       3 $714,333    $693,000 75.0          100
C15     -       -           -            -     -      -    C15      -       -          -          -    -           -


                                                                                                 North District

                                          Current Month: January 2010
 Area       Active      New       Sales       $ Volume        Avg Price         Med Price     Avg DOM     Avg %List
 N01      63             61         40       $22,447,250         $561,181        $491,250           24          100
 N02     143            132         57       $28,142,301         $493,725        $417,000           20          100
 N03     200            206        114       $50,142,300         $439,845        $384,250           22           99
 N04     112            122         66       $34,858,388         $528,157        $516,500           24          100
 N05     110             93         61       $32,414,391         $531,383        $511,500           27           99
 N06     119             91         39       $19,374,941         $496,793        $382,000           43          100
 N07     115            132         73       $27,585,490         $377,883        $350,000           25           98
 N08     346            298        146       $70,763,240         $484,680        $460,700           26           99
 N10      87             75         35       $16,441,000         $469,743        $475,000           20           99
 N11     247            232        140       $70,433,072         $503,093        $489,400           24          100
 N12      75             55         32       $14,779,000         $461,844        $414,000           44           98
 N13      76             30          8        $4,699,500         $587,438        $473,750           97           97
 N14     101             42         16        $8,886,800         $555,425        $538,450           54           97
 N15      66             46         19        $9,109,000         $479,421        $435,000           58           97
 N16     105             54         20        $7,821,100         $391,055        $384,500           59           97
 N17     194            100         45       $11,796,600         $262,147        $260,000           46           97
 N18     101             63         21        $6,777,755         $322,750        $295,000           87           98
 N19     131             60         29        $7,490,200         $258,283        $229,000           50           97
 N20      29              9          3        $1,395,000         $465,000        $485,000           89           94
 N21      36             11          1          $318,000         $318,000        $318,000           87           96
 N22      71             40         12        $5,653,400         $471,117        $369,950           79           96
 N23     166             74         19        $4,216,000         $221,895        $230,000           70           96
 N24      94             30          5          $884,150         $176,830        $159,650           77           92
 TOTAL 2,787          2,056      1,001      $456,428,878         $455,973        $422,000           33           99


12    TORONTO REAL ESTATE BOARD
North District


                       North District                                                    North District
   80                  Days on Market                                80             Sales Active Listing Ratio

   60                                                                60


   40                                                                40


   20                                                                20


    0                                                                 0
        Jan Feb Mar Apr May Jun   Jul Aug Sep Oct Nov Dec Jan             Jan Feb Mar Apr May Jun   Jul Aug Sep Oct Nov Dec Jan

        2009                                           2010               2009                                           2010


                                                Year-to-Date: January 2010
Area       Listed       Sales             $ Volume              Avg Price           Med Price         Avg DOM        Avg %List
N01      60                 40          $22,447,250             $561,181             $491,250                 24             100
N02     131                 57          $28,142,301             $493,725             $417,000                 20             100
N03     205                114          $50,142,300             $439,845             $384,250                 22              99
N04     121                 66          $34,858,388             $528,157             $516,500                 24             100
N05      93                 61          $32,414,391             $531,383             $511,500                 27              99
N06      90                 39          $19,374,941             $496,793             $382,000                 43             100
N07     132                 73          $27,585,490             $377,883             $350,000                 25              98
N08     296                146          $70,763,240             $484,680             $460,700                 26              99
N10      75                 35          $16,441,000             $469,743             $475,000                 20              99
N11     232                140          $70,433,072             $503,093             $489,400                 24             100
N12      55                 32          $14,779,000             $461,844             $414,000                 44              98
N13      30                  8           $4,699,500             $587,438             $473,750                 97              97
N14      42                 16           $8,886,800             $555,425             $538,450                 54              97
N15      46                 19           $9,109,000             $479,421             $435,000                 58              97
N16      53                 20           $7,821,100             $391,055             $384,500                 59              97
N17      96                 45          $11,796,600             $262,147             $260,000                 46              97
N18      63                 21           $6,777,755             $322,750             $295,000                 87              98
N19      60                 29           $7,490,200             $258,283             $229,000                 50              97
N20       9                  3           $1,395,000             $465,000             $485,000                 89              94
N21      10                  1             $318,000             $318,000             $318,000                 87              96
N22      40                 12           $5,653,400             $471,117             $369,950                 79              96
N23      72                 19           $4,216,000             $221,895             $230,000                 70              96
N24      30                  5             $884,150             $176,830             $159,650                 77              92
TOTAL 2,041              1,001         $456,428,878             $455,973             $422,000                 33              99


                                                                                        TORONTO REAL ESTATE BOARD                 13
SINGLE FAMILY NORTH BREAKDOWN - JANuARY 2010                   North District


     Detached Houses                                       Semi-Detached Houses
Area Act Sales Av. Price    Med. Price % S-A Av. % List Area Act Sales Av. Price Med. Price % S-A Av. % List
N01    37   22   $740,680    $624,500   59.5     99    N01     -     1       $400,000   $400,000       -      98
N02    73   23   $707,250    $574,250   31.5    100    N02     -     2       $399,000   $399,000       -     109
N03    93   36   $697,002    $639,500   38.7    100    N03     6     4       $459,950   $459,950    66.7      99
N04    78   47   $588,289    $591,200   60.3    100    N04     7     5       $411,500   $421,000    71.4      99
N05   103   45   $575,537    $545,000   43.7     98    N05     2     6       $405,750   $407,500   300.0     101
N06    81   21   $649,929    $549,000   25.9     98    N06     7     7       $311,786   $317,500   100.0     102
N07    83   47   $417,445    $403,000   56.6     98    N07     5    10       $307,819   $323,495   200.0      99
N08   230   83   $573,175    $535,000   36.1     99    N08    22    24       $404,878   $407,000   109.1     101
N10    44   22   $536,959    $526,000   50.0     98    N10     3     2       $380,500   $380,500    66.7     103
N11   122   78   $617,051    $579,450   63.9    101    N11    11     8       $399,188   $392,000    72.7     100
N12    63   22   $519,727    $461,500   34.9     97    N12     1     4       $358,500   $360,250   400.0     102
N13    76    8   $587,438    $473,750   10.5     97    N13     -     -              -          -       -       -
N14    97   15   $572,720    $566,900   15.5     97    N14     -     -              -          -       -       -
N15    61   17   $502,353    $448,000   27.9     97    N15     -     -              -          -       -       -
N16    84   17   $430,006    $409,000   20.2     98    N16     1     -              -          -       -       -
N17   186   39   $269,778    $275,000   21.0     97    N17     4     1       $231,000   $231,000    25.0      96
N18    86   15   $347,533    $310,500   17.4     98    N18     1     2       $263,750   $263,750   200.0      97
N19    78   17   $272,612    $278,000   21.8     98    N19     6     2       $213,500   $213,500    33.3      99
N20    29    3   $465,000    $485,000   10.3     94    N20     -     -              -          -       -       -
N21    36    1   $318,000    $318,000    2.8     96    N21     -     -              -          -       -       -
N22    62   11   $496,400    $449,900   17.7     96    N22     1     -              -          -       -       -
N23   160   17   $223,471    $230,000   10.6     96    N23     1     -              -          -       -       -
N24    88    4   $183,663    $188,325    4.6     90    N24     -     -              -          -       -       -


     Condo Apartment                                                  Link
Area Act Sales Av. Price    Med. Price % S-A Av. % List Area Act   Sales Av. Price      Med. Price % S-A Av. % List
N01    13   12   $326,192    $282,500   92.3    100    N01     3         -          -          -     -       -
N02    52   22   $310,911    $323,000   42.3    100    N02     6         3   $411,333   $412,000 50.0       99
N03    65   49   $268,602    $256,000   75.4     98    N03     3         2   $477,500   $477,500 66.7      106
N04    15    4   $257,000    $239,000   26.7     99    N04     -         -          -          -     -       -
N05     -    -          -           -      -      -    N05     -         -          -          -     -       -
N06    12    4   $273,448    $274,900   33.3    100    N06     2         -          -          -     -       -
N07     8    4   $260,375    $255,750   50.0     98    N07     -         -          -          -     -       -
N08    61   13   $293,385    $280,000   21.3     96    N08     3         3   $472,500   $500,000 100.0      99
N10    26    3   $239,333    $237,000   11.5     97    N10    13         6   $408,233   $407,500 46.2      101
N11    77   21   $305,152    $288,000   27.3     98    N11    10         4   $460,125   $466,500 40.0      102
N12     4    -          -           -      -      -    N12     -         -          -          -     -       -
N13     -    -          -           -      -      -    N13     -         -          -          -     -       -
N14     2    -          -           -      -      -    N14     -         -          -          -     -       -
N15     -    -          -           -      -      -    N15     -         -          -          -     -       -
N16    10    1   $120,000    $120,000   10.0     96    N16     -         1   $253,000   $253,000     -      97
N17     2    1   $140,000    $140,000   50.0     98    N17     -         -          -          -     -       -
N18     6    -          -           -      -      -    N18     3         4   $259,314   $263,000 133.3      99
N19    11    1   $191,000    $191,000    9.1     98    N19     2         2   $219,250   $219,250 100.0      97
N20     -    -          -           -      -      -    N20     -         -          -          -     -       -
N21     -    -          -           -      -      -    N21     -         -          -          -     -       -
N22     -    -          -           -      -      -    N22     5         -          -          -     -       -
N23     -    -          -           -      -      -    N23     2         -          -          -     -       -
N24     -    -          -           -      -      -    N24     -         -          -          -     -       -


14    TORONTO REAL ESTATE BOARD
SINGLE FAMILY NORTH BREAKDOWN - JANuARY 2010              North District


     Condo Townhouse                                       Detached Condo
Area Act Sales Av. Price Med. Price % S-A Av. % List Area Act Sales Av. Price         Med. Price % S-A Av. % List
N01   10    4    $340,750       $321,500 40.0      98    N01 -        -           -           -    -        -
N02    8    5    $392,300       $431,000 62.5      98    N02 1        -           -           -    -        -
N03   19    8    $318,688       $314,500 42.1     100    N03 -        -           -           -    -        -
N04    3    2    $326,250       $326,250 66.7      96    N04 -        -           -           -    -        -
N05    -    1    $335,000       $335,000     -     91    N05 -        -           -           -    -        -
N06    8    1    $315,000       $315,000 12.5     105    N06 -        -           -           -    -        -
N07   10    4    $300,150       $274,800 40.0      99    N07 -        -           -           -    -        -
N08    8    2    $276,500       $276,500 25.0     101    N08 -        -           -           -    -        -
N10    -    2    $349,750       $349,750     -    101    N10 -        -           -           -    -        -
N11    9   14    $345,829       $335,000 155.6     99    N11 1        -           -           -    -        -
N12    -    1    $290,000       $290,000     -     97    N12 1        -           -           -    -        -
N13    -    -           -              -     -      -    N13 -        -           -           -    -        -
N14    2    -           -              -     -      -    N14 -        -           -           -    -        -
N15    -    -           -              -     -      -    N15 -        -           -           -    -        -
N16    4    1    $138,000       $138,000 25.0      94    N16 -        -           -           -    -        -
N17    1    -           -              -     -      -    N17 1        -           -           -    -        -
N18    4    -           -              -     -      -    N18 -        -           -           -    -        -
N19    5    -           -              -     -      -    N19 22       3    $321,000    $315,000 13.6       97
N20    -    -           -              -     -      -    N20 -        -           -           -    -        -
N21    -    -           -              -     -      -    N21 -        -           -           -    -        -
N22    -    -           -              -     -      -    N22 -        -           -           -    -        -
N23    -    -           -              -     -      -    N23 -        -           -           -    -        -
N24    6    1    $149,500       $149,500 16.7      98    N24 -        -           -           -    -        -


     Co-op Apartment                                        Attached/Row/Townhouse
Area Act Sales Av. Price       Med. Price % S-A Av. % List Area Act Sales Av. Price Med. Price % S-A Av. % List
N01    -     -             -            -     -      -   N01 -       1     $475,000   $475,000     -      106
N02    -     -             -            -     -      -   N02 3       2     $521,000   $521,000 66.7        99
N03    -     -             -            -     -      -   N03 14     15     $436,295   $444,000 107.1      102
N04    -     -             -            -     -      -   N04 9       8     $433,850   $425,250 88.9       100
N05    -     -             -            -     -      -   N05 5       9     $416,190   $412,000 180.0      101
N06    -     -             -            -     -      -   N06 9       6     $355,859   $342,000 66.7       100
N07    -     -             -            -     -      -   N07 9       8     $330,663   $330,250 88.9       102
N08    -     -             -            -     -      -   N08 22     21     $366,102   $385,000 95.5       100
N10    -     -             -            -     -      -   N10 1       -            -          -     -        -
N11    -     -             -            -     -      -   N11 17     15     $401,286   $375,000 88.2       101
N12    -     -             -            -     -      -   N12 6       5     $324,200   $326,000 83.3        99
N13    -     -             -            -     -      -   N13 -       -            -          -     -        -
N14    -     -             -            -     -      -   N14 -       1     $296,000   $296,000     -       99
N15    -     -             -            -     -      -   N15 5       2     $284,500   $284,500 40.0        99
N16    -     -             -            -     -      -   N16 6       -            -          -     -        -
N17    -     -             -            -     -      -   N17 -       4     $226,063   $228,750     -       98
N18    -     -             -            -     -      -   N18 1       -            -          -     -        -
N19    -     -             -            -     -      -   N19 7       4     $209,075   $204,200 57.1        95
N20    -     -             -            -     -      -   N20 -       -            -          -     -        -
N21    -     -             -            -     -      -   N21 -       -            -          -     -        -
N22    -     -             -            -     -      -   N22 3       1     $193,000   $193,000 33.3        97
N23    -     -             -            -     -      -   N23 3       2     $208,500   $208,500 66.7        97
N24    -     -             -            -     -      -   N24 -       -            -          -     -        -


                                                                          TORONTO REAL ESTATE BOARD         15
District Totals
                                      New          Active        Listed               Sales                $ Volume           Avg Price            Med Price Avg DOM Avg Month
        Grand Total                10,021          12,052            N/A              4,986          2,039,564,515                 409,058            350,000                    28                 99
        Year                           N/A             N/A        9,962               4,986          2,039,564,515                 409,058            350,000                    28                 99


                                                                 Annual Summary - Single Family
               Year                *Number of Sales                 *Average Price                            Year                  *Number of Sales                      *Average Price
             1976                          19,025                     $61,389                                  2009
             1977                          20,512                     $64,559                                  January                            2,670                       $343,632
             1978                          21,184                     $67,333                                  February                           4,120                       $361,305
             1979                          23,466                     $70,830                                  March                              6,171                       $362,050
             1980                          26,017                     $75,694                                  April                              8,107                       $385,641
             1981                          29,625                     $90,203                                  May                                9,589                       $395,609
             1982                          25,336                     $95,496                                  June                              10,955                       $403,972
             1983                          30,046                    $101,626                                  July                               9,967                       $395,414
             1984                          31,905                    $102,318                                  August                             8,035                       $387,921
             1985                          45,509                    $109,094                                  September                          8,196                       $406,877
             1986                          52,919                    $138,925                                  October                            8,476                       $423,559
             1987                          43,475                    $189,105                                  November                           7,446                       $418,460
             1988                          49,381                    $229,635                                  December                           5,541                       $411,931
             1989                          38,960                    $273,698
             1990                          26,779                    $255,020                                  Total**                           87,308                       $395,460
             1991                          38,144                    $234,313
             1992                          41,703                    $214,971                                  2010
             1993                          38,990                    $206,490                                  January                           4,986                        $409,058
             1994                          44,237                    $208,921
             1995                          39,273                    $203,028                                  Year-to-Date**                    4,986                        $409,058
             1996                          55,779                    $198,150
             1997                          58,014                    $211,307
             1998                          55,344                    $216,815
             1999                          58,957                    $228,372
             2000                          58,343                    $243,255
             2001                          67,612                    $251,508
             2002                          74,759                    $275,231
             2003                          78,898                    $293,067
             2004                          83,501                    $315,231
             2005                          84,145                    $335,907
             2006                          83,084                    $351,941
             2007                          93,193                    $376,236
             2008                          74,552                    $379,347
             * Due to District revisions, caution should be exercised when undertaking historical comparisons. Please refer to appropriate maps.
             **This figure may not equal the sum of all monthly totals, as the year-to-date total reflects sales reported in error and deals that have fallen through since January 1st.


                                                           Single Family Dwelling Sales Comparison

                              Sales                                                          Active Listing                                                       Average Price
15000                                                                                                                                   500000
                                                                   35000
13500
                                                                   30000
12000
                                                                                                                                        425000
10500                                                              25000
9000
                                                                   20000
7500                                                                                                                                    350000

6000                                                               15000

4500                                                               10000                                                                275000
3000
                                                                    5000
 1500
   0                                                                  0                                                                 200000
        Jan Feb Mar Apr May Jun   Jul Aug Sep Oct Nov Dec Jan              Jan Feb Mar Apr May Jun   Jul Aug Sep Oct Nov Dec Jan                 2000 2001 2002 2003 2004 2005 2006 2007 2008 2009 2010

        2009                                            2010               2009                                            2010


        16     TORONTO REAL ESTATE BOARD

Más contenido relacionado

La actualidad más candente

Treb Market Watch August 2010
Treb Market Watch August 2010Treb Market Watch August 2010
Treb Market Watch August 2010James Metcalfe
 
Toronto real estate statistics may 2011
Toronto real estate statistics may 2011Toronto real estate statistics may 2011
Toronto real estate statistics may 2011John Helfrich
 
April Market Watch
April Market WatchApril Market Watch
April Market WatchLarrySage
 
Toronto Real Estate Statistics September 2010
Toronto Real Estate Statistics September 2010Toronto Real Estate Statistics September 2010
Toronto Real Estate Statistics September 2010John Helfrich
 
Annual Report Bdc
Annual Report BdcAnnual Report Bdc
Annual Report Bdcgineva
 
1428 Market Report November 2011
1428 Market Report November  20111428 Market Report November  2011
1428 Market Report November 2011Charter One Realty
 
Big_Lots_AR2004
Big_Lots_AR2004Big_Lots_AR2004
Big_Lots_AR2004finance50
 
The 1428 Report | December 2011
The 1428 Report  | December 2011The 1428 Report  | December 2011
The 1428 Report | December 2011Charter One Realty
 

La actualidad más candente (12)

Market watch march 2011
Market watch march 2011Market watch march 2011
Market watch march 2011
 
Treb Market Watch August 2010
Treb Market Watch August 2010Treb Market Watch August 2010
Treb Market Watch August 2010
 
Toronto real estate statistics may 2011
Toronto real estate statistics may 2011Toronto real estate statistics may 2011
Toronto real estate statistics may 2011
 
Market Watch April 2011
Market Watch April 2011Market Watch April 2011
Market Watch April 2011
 
April Market Watch
April Market WatchApril Market Watch
April Market Watch
 
Toronto Real Estate Statistics September 2010
Toronto Real Estate Statistics September 2010Toronto Real Estate Statistics September 2010
Toronto Real Estate Statistics September 2010
 
22152reportfeb2011
22152reportfeb201122152reportfeb2011
22152reportfeb2011
 
Annual Report Bdc
Annual Report BdcAnnual Report Bdc
Annual Report Bdc
 
1428 Market Report November 2011
1428 Market Report November  20111428 Market Report November  2011
1428 Market Report November 2011
 
Big_Lots_AR2004
Big_Lots_AR2004Big_Lots_AR2004
Big_Lots_AR2004
 
1428 Report October 2011
1428 Report October 20111428 Report October 2011
1428 Report October 2011
 
The 1428 Report | December 2011
The 1428 Report  | December 2011The 1428 Report  | December 2011
The 1428 Report | December 2011
 

Destacado

Toronto real estate statistics july 2011
Toronto real estate statistics july 2011Toronto real estate statistics july 2011
Toronto real estate statistics july 2011John Helfrich
 
Toronto condo market statistical report 2011
Toronto condo market statistical report 2011Toronto condo market statistical report 2011
Toronto condo market statistical report 2011John Helfrich
 
Toronto real estate statistics October 2011
Toronto real estate statistics October 2011Toronto real estate statistics October 2011
Toronto real estate statistics October 2011John Helfrich
 
Toronto real estate statistics December 2011
Toronto real estate statistics December 2011Toronto real estate statistics December 2011
Toronto real estate statistics December 2011John Helfrich
 
Toronto real estate statistics charts april 2011
Toronto real estate statistics charts april 2011Toronto real estate statistics charts april 2011
Toronto real estate statistics charts april 2011John Helfrich
 
Toronto real estate statistics charts january 2012
Toronto real estate statistics charts january 2012Toronto real estate statistics charts january 2012
Toronto real estate statistics charts january 2012John Helfrich
 
Toronto Real Estate Statistics October 2010
Toronto Real Estate Statistics October 2010Toronto Real Estate Statistics October 2010
Toronto Real Estate Statistics October 2010John Helfrich
 
Market Watch December 2010 Toronto Homes Resale Statistics
Market Watch December 2010 Toronto Homes Resale StatisticsMarket Watch December 2010 Toronto Homes Resale Statistics
Market Watch December 2010 Toronto Homes Resale StatisticsJohn Helfrich
 
Market watch august 2010
Market watch august 2010Market watch august 2010
Market watch august 2010John Helfrich
 
Toronto real estate statistics november 2010
Toronto real estate statistics november 2010Toronto real estate statistics november 2010
Toronto real estate statistics november 2010John Helfrich
 
Toronto real estate statistics november 2011
Toronto real estate statistics november 2011Toronto real estate statistics november 2011
Toronto real estate statistics november 2011John Helfrich
 

Destacado (11)

Toronto real estate statistics july 2011
Toronto real estate statistics july 2011Toronto real estate statistics july 2011
Toronto real estate statistics july 2011
 
Toronto condo market statistical report 2011
Toronto condo market statistical report 2011Toronto condo market statistical report 2011
Toronto condo market statistical report 2011
 
Toronto real estate statistics October 2011
Toronto real estate statistics October 2011Toronto real estate statistics October 2011
Toronto real estate statistics October 2011
 
Toronto real estate statistics December 2011
Toronto real estate statistics December 2011Toronto real estate statistics December 2011
Toronto real estate statistics December 2011
 
Toronto real estate statistics charts april 2011
Toronto real estate statistics charts april 2011Toronto real estate statistics charts april 2011
Toronto real estate statistics charts april 2011
 
Toronto real estate statistics charts january 2012
Toronto real estate statistics charts january 2012Toronto real estate statistics charts january 2012
Toronto real estate statistics charts january 2012
 
Toronto Real Estate Statistics October 2010
Toronto Real Estate Statistics October 2010Toronto Real Estate Statistics October 2010
Toronto Real Estate Statistics October 2010
 
Market Watch December 2010 Toronto Homes Resale Statistics
Market Watch December 2010 Toronto Homes Resale StatisticsMarket Watch December 2010 Toronto Homes Resale Statistics
Market Watch December 2010 Toronto Homes Resale Statistics
 
Market watch august 2010
Market watch august 2010Market watch august 2010
Market watch august 2010
 
Toronto real estate statistics november 2010
Toronto real estate statistics november 2010Toronto real estate statistics november 2010
Toronto real estate statistics november 2010
 
Toronto real estate statistics november 2011
Toronto real estate statistics november 2011Toronto real estate statistics november 2011
Toronto real estate statistics november 2011
 

Similar a T R E B Market Watch Jan2010

Toronto Market Trends
Toronto Market TrendsToronto Market Trends
Toronto Market TrendsLarrySage
 
February 2010 Toronto Mls Market Watch
February 2010 Toronto Mls Market WatchFebruary 2010 Toronto Mls Market Watch
February 2010 Toronto Mls Market WatchSteven Silva
 
Toronto housing stats market watch all neighbourhoods dec. 2010
Toronto housing stats market watch all neighbourhoods dec. 2010Toronto housing stats market watch all neighbourhoods dec. 2010
Toronto housing stats market watch all neighbourhoods dec. 2010James Metcalfe
 
Market watch december 2010
Market watch december 2010Market watch december 2010
Market watch december 2010Jennifer Backus
 
TREB Market Watch December 2010
TREB Market Watch December 2010TREB Market Watch December 2010
TREB Market Watch December 2010Harish Maraj
 
Toronto Market Trends
Toronto Market TrendsToronto Market Trends
Toronto Market TrendsLarrySage
 
Market Watch July 2010
Market Watch July 2010Market Watch July 2010
Market Watch July 2010Derek Cardona
 
Toronto real estate statistics july 2010
Toronto real estate statistics july 2010Toronto real estate statistics july 2010
Toronto real estate statistics july 2010John Helfrich
 
Market Watch for Toronto June 2011
Market Watch for Toronto June 2011Market Watch for Toronto June 2011
Market Watch for Toronto June 2011Brent Reid
 
Toronto real estate statistics june 2011
Toronto real estate statistics june 2011Toronto real estate statistics june 2011
Toronto real estate statistics june 2011John Helfrich
 
Toronto Real Estate Statistics February 2011
Toronto Real Estate Statistics February 2011Toronto Real Estate Statistics February 2011
Toronto Real Estate Statistics February 2011John Helfrich
 
Market watch january 2011
Market watch january 2011Market watch january 2011
Market watch january 2011Jennifer Backus
 
Toronto real estate statistics april 2011
Toronto real estate statistics april 2011Toronto real estate statistics april 2011
Toronto real estate statistics april 2011John Helfrich
 
Toronto real estate statistics march 2011
Toronto real estate statistics march 2011Toronto real estate statistics march 2011
Toronto real estate statistics march 2011John Helfrich
 
September's Newsletter
September's NewsletterSeptember's Newsletter
September's NewsletterFabio Recine
 
Toronto real estate statistics august 2011
Toronto real estate statistics august 2011Toronto real estate statistics august 2011
Toronto real estate statistics august 2011John Helfrich
 

Similar a T R E B Market Watch Jan2010 (20)

Toronto Market Trends
Toronto Market TrendsToronto Market Trends
Toronto Market Trends
 
February 2010 Toronto Mls Market Watch
February 2010 Toronto Mls Market WatchFebruary 2010 Toronto Mls Market Watch
February 2010 Toronto Mls Market Watch
 
Toronto housing stats market watch all neighbourhoods dec. 2010
Toronto housing stats market watch all neighbourhoods dec. 2010Toronto housing stats market watch all neighbourhoods dec. 2010
Toronto housing stats market watch all neighbourhoods dec. 2010
 
Market watch december 2010
Market watch december 2010Market watch december 2010
Market watch december 2010
 
TREB Market Watch December 2010
TREB Market Watch December 2010TREB Market Watch December 2010
TREB Market Watch December 2010
 
Toronto Market Trends
Toronto Market TrendsToronto Market Trends
Toronto Market Trends
 
MARKET WATCH FOR JUNE 2010
MARKET WATCH FOR JUNE 2010MARKET WATCH FOR JUNE 2010
MARKET WATCH FOR JUNE 2010
 
Toronto Real Estate Market Watch July 2010
Toronto Real Estate Market Watch July 2010Toronto Real Estate Market Watch July 2010
Toronto Real Estate Market Watch July 2010
 
Market Watch July 2010
Market Watch July 2010Market Watch July 2010
Market Watch July 2010
 
Toronto real estate statistics july 2010
Toronto real estate statistics july 2010Toronto real estate statistics july 2010
Toronto real estate statistics july 2010
 
Mw1007 pdf
Mw1007 pdfMw1007 pdf
Mw1007 pdf
 
Market Watch for Toronto June 2011
Market Watch for Toronto June 2011Market Watch for Toronto June 2011
Market Watch for Toronto June 2011
 
Toronto real estate statistics june 2011
Toronto real estate statistics june 2011Toronto real estate statistics june 2011
Toronto real estate statistics june 2011
 
Toronto Real Estate Statistics February 2011
Toronto Real Estate Statistics February 2011Toronto Real Estate Statistics February 2011
Toronto Real Estate Statistics February 2011
 
TREB
TREBTREB
TREB
 
Market watch january 2011
Market watch january 2011Market watch january 2011
Market watch january 2011
 
Toronto real estate statistics april 2011
Toronto real estate statistics april 2011Toronto real estate statistics april 2011
Toronto real estate statistics april 2011
 
Toronto real estate statistics march 2011
Toronto real estate statistics march 2011Toronto real estate statistics march 2011
Toronto real estate statistics march 2011
 
September's Newsletter
September's NewsletterSeptember's Newsletter
September's Newsletter
 
Toronto real estate statistics august 2011
Toronto real estate statistics august 2011Toronto real estate statistics august 2011
Toronto real estate statistics august 2011
 

Más de John Helfrich

Toronto real estate statistics january 2012
Toronto real estate statistics january 2012Toronto real estate statistics january 2012
Toronto real estate statistics january 2012John Helfrich
 
Toronto condo market statistical report Q4 2011
Toronto condo market statistical report Q4 2011Toronto condo market statistical report Q4 2011
Toronto condo market statistical report Q4 2011John Helfrich
 
John Helfrich Real Estate Newsletter January February 2012
John Helfrich Real Estate Newsletter January February 2012John Helfrich Real Estate Newsletter January February 2012
John Helfrich Real Estate Newsletter January February 2012John Helfrich
 
Toronto EAST Real Estate statistics september 2011
Toronto EAST Real Estate statistics september 2011Toronto EAST Real Estate statistics september 2011
Toronto EAST Real Estate statistics september 2011John Helfrich
 
Toronto Real Estate Statistics september 2011
Toronto Real Estate Statistics september 2011Toronto Real Estate Statistics september 2011
Toronto Real Estate Statistics september 2011John Helfrich
 
Toronto Air Quality Study - Toronto Environment Office
Toronto Air Quality Study - Toronto Environment OfficeToronto Air Quality Study - Toronto Environment Office
Toronto Air Quality Study - Toronto Environment OfficeJohn Helfrich
 
Toronto real estate statistics chart august 2011
Toronto real estate statistics chart august 2011Toronto real estate statistics chart august 2011
Toronto real estate statistics chart august 2011John Helfrich
 
Toronto real estate statistics charts july 2011
Toronto real estate statistics charts july 2011Toronto real estate statistics charts july 2011
Toronto real estate statistics charts july 2011John Helfrich
 

Más de John Helfrich (8)

Toronto real estate statistics january 2012
Toronto real estate statistics january 2012Toronto real estate statistics january 2012
Toronto real estate statistics january 2012
 
Toronto condo market statistical report Q4 2011
Toronto condo market statistical report Q4 2011Toronto condo market statistical report Q4 2011
Toronto condo market statistical report Q4 2011
 
John Helfrich Real Estate Newsletter January February 2012
John Helfrich Real Estate Newsletter January February 2012John Helfrich Real Estate Newsletter January February 2012
John Helfrich Real Estate Newsletter January February 2012
 
Toronto EAST Real Estate statistics september 2011
Toronto EAST Real Estate statistics september 2011Toronto EAST Real Estate statistics september 2011
Toronto EAST Real Estate statistics september 2011
 
Toronto Real Estate Statistics september 2011
Toronto Real Estate Statistics september 2011Toronto Real Estate Statistics september 2011
Toronto Real Estate Statistics september 2011
 
Toronto Air Quality Study - Toronto Environment Office
Toronto Air Quality Study - Toronto Environment OfficeToronto Air Quality Study - Toronto Environment Office
Toronto Air Quality Study - Toronto Environment Office
 
Toronto real estate statistics chart august 2011
Toronto real estate statistics chart august 2011Toronto real estate statistics chart august 2011
Toronto real estate statistics chart august 2011
 
Toronto real estate statistics charts july 2011
Toronto real estate statistics charts july 2011Toronto real estate statistics charts july 2011
Toronto real estate statistics charts july 2011
 

Último

Anandtara Iris Residences Mundhwa Pune Brochure.pdf
Anandtara Iris Residences Mundhwa Pune Brochure.pdfAnandtara Iris Residences Mundhwa Pune Brochure.pdf
Anandtara Iris Residences Mundhwa Pune Brochure.pdfabbu831446
 
Affordable and Quality Construction SVTN's Signature Blend of Cost-Efficiency...
Affordable and Quality Construction SVTN's Signature Blend of Cost-Efficiency...Affordable and Quality Construction SVTN's Signature Blend of Cost-Efficiency...
Affordable and Quality Construction SVTN's Signature Blend of Cost-Efficiency...AditiAlishetty
 
Provident Solitaire Park Square Kanakapura Road, Bangalore E- Brochure.pdf
Provident Solitaire Park Square Kanakapura Road, Bangalore E- Brochure.pdfProvident Solitaire Park Square Kanakapura Road, Bangalore E- Brochure.pdf
Provident Solitaire Park Square Kanakapura Road, Bangalore E- Brochure.pdffaheemali990101
 
Call Girls In Peeragarhi, Delhi↫8447779280↬Call Girls in Peeragarhi Delhi NCR
Call Girls In Peeragarhi, Delhi↫8447779280↬Call Girls in Peeragarhi Delhi NCRCall Girls In Peeragarhi, Delhi↫8447779280↬Call Girls in Peeragarhi Delhi NCR
Call Girls In Peeragarhi, Delhi↫8447779280↬Call Girls in Peeragarhi Delhi NCRasmaqueen5
 
Kumar Fireworks Hadapsar Link Road Pune Brochure.pdf
Kumar Fireworks Hadapsar Link Road Pune Brochure.pdfKumar Fireworks Hadapsar Link Road Pune Brochure.pdf
Kumar Fireworks Hadapsar Link Road Pune Brochure.pdfBabyrudram
 
Ebullient Investments Limited specializes in Building contractor
Ebullient Investments Limited specializes in Building contractorEbullient Investments Limited specializes in Building contractor
Ebullient Investments Limited specializes in Building contractorEbullient Investments Limited
 
Namrata 7 Plumeria Drive Pimpri Chinchwad Pune Brochure.pdf
Namrata 7 Plumeria Drive Pimpri Chinchwad Pune Brochure.pdfNamrata 7 Plumeria Drive Pimpri Chinchwad Pune Brochure.pdf
Namrata 7 Plumeria Drive Pimpri Chinchwad Pune Brochure.pdfPrachiRudram
 
Everything you ever Wanted to Know about Florida Property Tax Exemptions.pdf
Everything you ever Wanted to Know about Florida Property Tax Exemptions.pdfEverything you ever Wanted to Know about Florida Property Tax Exemptions.pdf
Everything you ever Wanted to Know about Florida Property Tax Exemptions.pdfTim Wilmath
 
Dynamic Netsoft A leader In Property management Software
Dynamic Netsoft A leader In Property management SoftwareDynamic Netsoft A leader In Property management Software
Dynamic Netsoft A leader In Property management SoftwareDynamic Netsoft
 
The Role of Mortgage Brokers in Retirement Housing: Key Considerations
The Role of Mortgage Brokers in Retirement Housing: Key ConsiderationsThe Role of Mortgage Brokers in Retirement Housing: Key Considerations
The Role of Mortgage Brokers in Retirement Housing: Key Considerationssunlite Mortgage
 
Managed Farmland Brochures to get more in
Managed Farmland Brochures to get more inManaged Farmland Brochures to get more in
Managed Farmland Brochures to get more inknoxdigital1
 
A Brief History of Intangibles in Ad Valorem Taxation.pdf
A Brief History of Intangibles in Ad Valorem Taxation.pdfA Brief History of Intangibles in Ad Valorem Taxation.pdf
A Brief History of Intangibles in Ad Valorem Taxation.pdfTim Wilmath
 
Shapoorji Pallonji Vanaha GolfLand 2 | A Space For You To Find Your Space
Shapoorji Pallonji Vanaha GolfLand 2 | A Space For You To Find Your SpaceShapoorji Pallonji Vanaha GolfLand 2 | A Space For You To Find Your Space
Shapoorji Pallonji Vanaha GolfLand 2 | A Space For You To Find Your Spaceaidasheikh47
 
How to Navigate the Eviction Process in Pennsylvania: A Landlord's Guide
How to Navigate the Eviction Process in Pennsylvania: A Landlord's GuideHow to Navigate the Eviction Process in Pennsylvania: A Landlord's Guide
How to Navigate the Eviction Process in Pennsylvania: A Landlord's GuideezLandlordForms
 
Ryan Mahoney - How Property Technology Is Altering the Real Estate Market
Ryan Mahoney - How Property Technology Is Altering the Real Estate MarketRyan Mahoney - How Property Technology Is Altering the Real Estate Market
Ryan Mahoney - How Property Technology Is Altering the Real Estate MarketRyan Mahoney
 
LCAR Unit 22 - Leasing and Property Management - 14th Edition Revised.pptx
LCAR Unit 22 - Leasing and Property Management - 14th Edition Revised.pptxLCAR Unit 22 - Leasing and Property Management - 14th Edition Revised.pptx
LCAR Unit 22 - Leasing and Property Management - 14th Edition Revised.pptxTom Blefko
 
SVN Live 4.22.24 Weekly Property Broadcast
SVN Live 4.22.24 Weekly Property BroadcastSVN Live 4.22.24 Weekly Property Broadcast
SVN Live 4.22.24 Weekly Property BroadcastSVN International Corp.
 
Prestige Rainbow Waters Raidurgam, Gachibowli Hyderabad E- Brochure.pdf
Prestige Rainbow Waters Raidurgam, Gachibowli Hyderabad E- Brochure.pdfPrestige Rainbow Waters Raidurgam, Gachibowli Hyderabad E- Brochure.pdf
Prestige Rainbow Waters Raidurgam, Gachibowli Hyderabad E- Brochure.pdffaheemali990101
 

Último (20)

Anandtara Iris Residences Mundhwa Pune Brochure.pdf
Anandtara Iris Residences Mundhwa Pune Brochure.pdfAnandtara Iris Residences Mundhwa Pune Brochure.pdf
Anandtara Iris Residences Mundhwa Pune Brochure.pdf
 
Affordable and Quality Construction SVTN's Signature Blend of Cost-Efficiency...
Affordable and Quality Construction SVTN's Signature Blend of Cost-Efficiency...Affordable and Quality Construction SVTN's Signature Blend of Cost-Efficiency...
Affordable and Quality Construction SVTN's Signature Blend of Cost-Efficiency...
 
Provident Solitaire Park Square Kanakapura Road, Bangalore E- Brochure.pdf
Provident Solitaire Park Square Kanakapura Road, Bangalore E- Brochure.pdfProvident Solitaire Park Square Kanakapura Road, Bangalore E- Brochure.pdf
Provident Solitaire Park Square Kanakapura Road, Bangalore E- Brochure.pdf
 
Call Girls In Peeragarhi, Delhi↫8447779280↬Call Girls in Peeragarhi Delhi NCR
Call Girls In Peeragarhi, Delhi↫8447779280↬Call Girls in Peeragarhi Delhi NCRCall Girls In Peeragarhi, Delhi↫8447779280↬Call Girls in Peeragarhi Delhi NCR
Call Girls In Peeragarhi, Delhi↫8447779280↬Call Girls in Peeragarhi Delhi NCR
 
Kumar Fireworks Hadapsar Link Road Pune Brochure.pdf
Kumar Fireworks Hadapsar Link Road Pune Brochure.pdfKumar Fireworks Hadapsar Link Road Pune Brochure.pdf
Kumar Fireworks Hadapsar Link Road Pune Brochure.pdf
 
Ebullient Investments Limited specializes in Building contractor
Ebullient Investments Limited specializes in Building contractorEbullient Investments Limited specializes in Building contractor
Ebullient Investments Limited specializes in Building contractor
 
Namrata 7 Plumeria Drive Pimpri Chinchwad Pune Brochure.pdf
Namrata 7 Plumeria Drive Pimpri Chinchwad Pune Brochure.pdfNamrata 7 Plumeria Drive Pimpri Chinchwad Pune Brochure.pdf
Namrata 7 Plumeria Drive Pimpri Chinchwad Pune Brochure.pdf
 
Everything you ever Wanted to Know about Florida Property Tax Exemptions.pdf
Everything you ever Wanted to Know about Florida Property Tax Exemptions.pdfEverything you ever Wanted to Know about Florida Property Tax Exemptions.pdf
Everything you ever Wanted to Know about Florida Property Tax Exemptions.pdf
 
Dynamic Netsoft A leader In Property management Software
Dynamic Netsoft A leader In Property management SoftwareDynamic Netsoft A leader In Property management Software
Dynamic Netsoft A leader In Property management Software
 
Call Girls in Mahavir Nagar whatsaap call US +919953056974
Call Girls in Mahavir Nagar  whatsaap call US  +919953056974Call Girls in Mahavir Nagar  whatsaap call US  +919953056974
Call Girls in Mahavir Nagar whatsaap call US +919953056974
 
The Role of Mortgage Brokers in Retirement Housing: Key Considerations
The Role of Mortgage Brokers in Retirement Housing: Key ConsiderationsThe Role of Mortgage Brokers in Retirement Housing: Key Considerations
The Role of Mortgage Brokers in Retirement Housing: Key Considerations
 
young call girls in Lajpat Nagar,🔝 9953056974 🔝 escort Service
young call girls in Lajpat Nagar,🔝 9953056974 🔝 escort Serviceyoung call girls in Lajpat Nagar,🔝 9953056974 🔝 escort Service
young call girls in Lajpat Nagar,🔝 9953056974 🔝 escort Service
 
Managed Farmland Brochures to get more in
Managed Farmland Brochures to get more inManaged Farmland Brochures to get more in
Managed Farmland Brochures to get more in
 
A Brief History of Intangibles in Ad Valorem Taxation.pdf
A Brief History of Intangibles in Ad Valorem Taxation.pdfA Brief History of Intangibles in Ad Valorem Taxation.pdf
A Brief History of Intangibles in Ad Valorem Taxation.pdf
 
Shapoorji Pallonji Vanaha GolfLand 2 | A Space For You To Find Your Space
Shapoorji Pallonji Vanaha GolfLand 2 | A Space For You To Find Your SpaceShapoorji Pallonji Vanaha GolfLand 2 | A Space For You To Find Your Space
Shapoorji Pallonji Vanaha GolfLand 2 | A Space For You To Find Your Space
 
How to Navigate the Eviction Process in Pennsylvania: A Landlord's Guide
How to Navigate the Eviction Process in Pennsylvania: A Landlord's GuideHow to Navigate the Eviction Process in Pennsylvania: A Landlord's Guide
How to Navigate the Eviction Process in Pennsylvania: A Landlord's Guide
 
Ryan Mahoney - How Property Technology Is Altering the Real Estate Market
Ryan Mahoney - How Property Technology Is Altering the Real Estate MarketRyan Mahoney - How Property Technology Is Altering the Real Estate Market
Ryan Mahoney - How Property Technology Is Altering the Real Estate Market
 
LCAR Unit 22 - Leasing and Property Management - 14th Edition Revised.pptx
LCAR Unit 22 - Leasing and Property Management - 14th Edition Revised.pptxLCAR Unit 22 - Leasing and Property Management - 14th Edition Revised.pptx
LCAR Unit 22 - Leasing and Property Management - 14th Edition Revised.pptx
 
SVN Live 4.22.24 Weekly Property Broadcast
SVN Live 4.22.24 Weekly Property BroadcastSVN Live 4.22.24 Weekly Property Broadcast
SVN Live 4.22.24 Weekly Property Broadcast
 
Prestige Rainbow Waters Raidurgam, Gachibowli Hyderabad E- Brochure.pdf
Prestige Rainbow Waters Raidurgam, Gachibowli Hyderabad E- Brochure.pdfPrestige Rainbow Waters Raidurgam, Gachibowli Hyderabad E- Brochure.pdf
Prestige Rainbow Waters Raidurgam, Gachibowli Hyderabad E- Brochure.pdf
 

T R E B Market Watch Jan2010

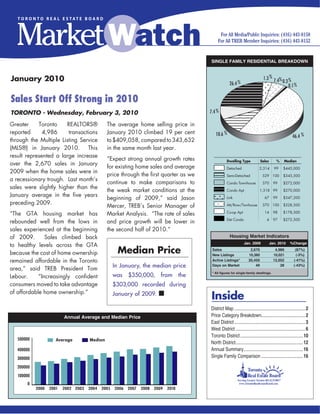
  • 1. SINGLE FAMILY RESIDENTIAL BREAKDOWN January 2010 1.3 % 7.4% % 26.4 % 0.3 0.1 % Sales Start Off Strong in 2010 TORONTO - Wednesday, February 3, 2010 7.4 % Greater Toronto REALTORS® The average home selling price in reported 4,986 transactions January 2010 climbed 19 per cent 10.6 % 46.4 % through the Multiple Listing Service to $409,058, compared to 343,632 (MLS®) in January 2010. This in the same month last year. result represented a large increase “Expect strong annual 2.3 % growth rates Dwelling Type Sales % Median over the 2,670 sales in January 21.5 % 7.0 % % 0.3 for existing home sales and average 0.1 % Single Detached 2,314 Detached 99 $445,000 2009 when the home sales were in price through the first quarter as we Semi Detached Semi-Detached 529 100 $345,500 a recessionary trough. Last month’s continue to make comparisons to Condo T.H. Condo Townhouse 370 99 $272,000 sales were slightly higher than the the weak market conditions at the 8.5 % Condo Apt. Condo Apt 1,318 99 $270,000 January average in the five years Link beginning of 2009,” said Jason Link 67 99 $347,200 preceding 2009. Attached/Row Mercer, TREB’s Senior Manager of Att/Row/Twnhouse 370 100 $328,500 Co-op Apt. “The GTA housing market has Market Analysis. “The rate of sales % 12.0 % 48.3 Co-op Apt 14 98 $178,500 Detached Condo Det Condo 4 97 $272,500 rebounded well from the lows in and price growth will be lower in sales experienced at the beginning the second half of 2010.” of 2009. Sales climbed back Housing Market Indicators Jan. 2009 Jan. 2010 %Change to healthy levels across the GTA because the cost of home ownership Median Price Sales New Listings 2,670 10,360 4,986 10,021 (87%) (-3%) remained affordable in the Toronto Active Listings* 20,450 12,052 (-41%) In January, the median price Days on Market 49 28 (-43%) area,” said TREB President Tom * All figures for single-family dwellings. Lebour. “Increasingly confident was $350,000, from the consumers moved to take advantage $303,000 recorded during Inside of affordable home ownership.” January of 2009. n District Map ............................................................. 2 Annual Average and Median Price Price Category Breakdown......................................2 East District ............................................................. 3 West District ............................................................ 6 Toronto District ......................................................10 500000 Average Median North District..........................................................12 400000 Annual Summary ...................................................16 300000 Single Family Comparison ....................................16 200000 100000 0 2000 2001 2002 2003 2004 2005 2006 2007 2008 2009 2010
  • 2. District Map Price Category Breakdown - January 2010 Price Range Total S.F.D %S.F.D Condo Apt. %Condo Apt. Condo T.H. %Condo T.H. - - $90,000 30 0.6 18 1.4 3 0.8 $90,001 - $100,000 8 0.2 5 0.4 1 0.3 $100,001 - $110,000 12 0.2 9 0.7 - - $110,001 - $120,000 21 0.4 16 1.2 3 0.8 $120,001 - $130,000 22 0.4 12 0.9 7 1.9 $130,001 - $140,000 27 0.5 20 1.5 4 1.1 $140,001 - $150,000 47 0.9 34 2.6 9 2.4 $150,001 - $160,000 51 1.0 35 2.7 7 1.9 $160,001 - $170,000 57 1.1 39 3.0 6 1.6 $170,001 - $180,000 70 1.4 42 3.2 9 2.4 $180,001 - $190,000 79 1.6 41 3.1 11 3.0 $190,001 - $200,000 73 1.5 39 3.0 16 4.3 $200,001 - $225,000 205 4.1 109 8.3 34 9.2 $225,001 - $250,000 316 6.3 140 10.6 38 10.3 $250,001 - $300,000 720 14.4 264 20.0 86 23.2 $300,001 - $400,000 1,364 27.4 321 24.4 96 25.9 $400,001 - $500,000 855 17.2 117 8.9 21 5.7 $500,001 - $750,000 724 14.5 42 3.2 15 4.1 $750,001 - $1,000,000 168 3.4 7 0.5 2 0.5 $1,000,001 - $1,500,000 87 1.7 4 0.3 2 0.5 $1,500,001 - - 50 1.0 4 0.3 - - Total: 4,986 100 1,318 100 370 100 2 TORONTO REAL ESTATE BOARD
  • 3. East District Current Month: January 2010 Area Active New Sales $ Volume Avg Price Med Price Avg DOM Avg %List E01 52 70 36 $15,214,780 $422,633 $420,000 23 103 E02 55 76 44 $25,282,928 $574,612 $530,149 15 103 E03 117 122 67 $25,058,250 $374,004 $381,000 24 101 E04 143 114 52 $14,886,800 $286,285 $294,000 24 99 E05 92 87 58 $17,429,898 $300,515 $276,000 25 101 E06 72 60 32 $12,194,300 $381,072 $350,450 22 102 E07 78 78 56 $18,857,400 $336,739 $352,000 39 100 E08 150 115 50 $14,170,100 $283,402 $318,000 31 98 E09 201 172 94 $23,594,818 $251,009 $249,050 28 98 E10 62 59 41 $15,527,700 $378,724 $366,500 25 100 E11 188 138 61 $16,262,702 $266,602 $256,000 31 98 E12 35 30 12 $3,730,700 $310,892 $302,400 23 99 E13 121 95 50 $16,329,722 $326,594 $325,500 22 99 E14 198 203 104 $33,710,040 $324,135 $310,000 24 98 E15 166 171 97 $28,431,750 $293,111 $283,500 25 99 E16 421 313 132 $30,098,653 $228,020 $212,000 35 97 E17 206 144 73 $18,701,190 $256,181 $248,000 36 98 E18 21 9 1 $623,500 $623,500 $623,500 93 96 E19 66 62 22 $7,853,488 $356,977 $328,000 26 99 E20 71 34 20 $6,227,100 $311,355 $273,500 52 97 E21 118 59 21 $8,145,400 $387,876 $355,000 57 98 TOTAL 2,633 2,211 1,123 $352,331,219 $313,741 $291,000 29 99 Year-to-Date: January 2010 Area Listed Sales $ Volume Avg Price Med Price Avg DOM Avg %List E01 70 36 $15,214,780 $422,633 $420,000 23 103 E02 75 44 $25,282,928 $574,612 $530,149 15 103 E03 121 67 $25,058,250 $374,004 $381,000 24 101 E04 112 52 $14,886,800 $286,285 $294,000 24 99 E05 87 58 $17,429,898 $300,515 $276,000 25 101 E06 58 32 $12,194,300 $381,072 $350,450 22 102 E07 78 56 $18,857,400 $336,739 $352,000 39 100 E08 115 50 $14,170,100 $283,402 $318,000 31 98 E09 171 94 $23,594,818 $251,009 $249,050 28 98 E10 59 41 $15,527,700 $378,724 $366,500 25 100 E11 136 61 $16,262,702 $266,602 $256,000 31 98 E12 30 12 $3,730,700 $310,892 $302,400 23 99 E13 95 50 $16,329,722 $326,594 $325,500 22 99 E14 203 104 $33,710,040 $324,135 $310,000 24 98 E15 170 97 $28,431,750 $293,111 $283,500 25 99 E16 312 132 $30,098,653 $228,020 $212,000 35 97 E17 144 73 $18,701,190 $256,181 $248,000 36 98 E18 9 1 $623,500 $623,500 $623,500 93 96 E19 62 22 $7,853,488 $356,977 $328,000 26 99 E20 34 20 $6,227,100 $311,355 $273,500 52 97 E21 57 21 $8,145,400 $387,876 $355,000 57 98 TOTAL 2,198 1,123 $352,331,219 $313,741 $291,000 29 99 TORONTO REAL ESTATE BOARD 3
  • 4. SINGLE FAMILY EAST BREAKDOWN - JANuARY 2010 East District East District East District 80 Days on Market 80 Sales Active Listing Ratio 60 60 40 40 20 20 0 0 Jan Feb Mar Apr May Jun Jul Aug Sep Oct Nov Dec Jan Jan Feb Mar Apr May Jun Jul Aug Sep Oct Nov Dec Jan 2009 2010 2009 2010 Detached Houses Semi-Detached Houses Area Act Sales Av. Price Med. Price % S-A Av. % List Area Act Sales Av. Price Med. Price % S-A Av. % List E01 12 10 $558,700 $478,500 83.3 105 E01 25 12 $382,707 $376,050 48.0 102 E02 23 13 $801,602 $655,000 56.5 104 E02 16 18 $533,822 $530,149 112.5 104 E03 49 30 $501,142 $486,500 61.2 102 E03 18 11 $418,927 $435,000 61.1 102 E04 46 23 $350,739 $365,000 50.0 100 E04 6 3 $292,100 $285,300 50.0 101 E05 18 12 $467,042 $440,000 66.7 106 E05 1 4 $360,000 $352,000 400.0 99 E06 53 27 $391,385 $365,000 50.9 102 E06 12 2 $295,500 $295,500 16.7 98 E07 24 24 $440,604 $422,900 100.0 102 E07 3 6 $348,383 $346,500 200.0 105 E08 63 24 $369,163 $349,000 38.1 99 E08 5 3 $261,000 $265,000 60.0 95 E09 39 23 $310,522 $330,000 59.0 100 E09 2 5 $290,220 $281,000 250.0 98 E10 47 27 $410,533 $380,000 57.5 100 E10 3 6 $351,050 $357,450 200.0 101 E11 45 23 $370,670 $386,000 51.1 98 E11 22 6 $261,833 $262,000 27.3 99 E12 18 9 $321,556 $313,000 50.0 99 E12 1 - - - - - E13 67 23 $413,761 $398,000 34.3 99 E13 5 3 $304,341 $355,000 60.0 100 E14 142 67 $365,574 $354,500 47.2 98 E14 10 11 $284,755 $285,000 110.0 98 E15 115 68 $318,151 $311,500 59.1 99 E15 3 2 $253,625 $253,625 66.7 101 E16 312 92 $253,639 $244,500 29.5 97 E16 40 23 $178,426 $175,000 57.5 98 E17 146 47 $284,855 $280,000 32.2 97 E17 3 2 $190,000 $190,000 66.7 99 E18 21 1 $623,500 $623,500 4.8 96 E18 - - - - - - E19 60 17 $383,271 $360,000 28.3 98 E19 - - - - - - E20 66 19 $315,900 $275,000 28.8 97 E20 - - - - - - E21 111 20 $397,445 $375,000 18.0 98 E21 4 1 $196,500 $196,500 25.0 98 4 TORONTO REAL ESTATE BOARD
  • 5. SINGLE FAMILY EAST BREAKDOWN - JANuARY 2010 East District Condo Apartment Link Area Act Sales Av. Price Med. Price % S-A Av. % List Area Act Sales Av. Price Med. Price % S-A Av. % List E01 10 3 $339,933 $289,900 30.0 105 E01 - - - - - - E02 3 5 $327,200 $301,000 166.7 100 E02 - - - - - - E03 40 24 $188,054 $148,000 60.0 98 E03 - - - - - - E04 72 19 $189,211 $207,000 26.4 97 E04 1 - - - - - E05 54 25 $217,048 $205,000 46.3 99 E05 4 4 $388,375 $400,250 100.0 100 E06 1 1 $296,000 $296,000 100.0 110 E06 - 1 $349,900 $349,900 - 100 E07 45 17 $195,082 $200,000 37.8 97 E07 1 2 $313,600 $313,600 200.0 91 E08 58 17 $177,476 $169,000 29.3 97 E08 - - - - - - E09 125 57 $230,556 $234,000 45.6 98 E09 - - - - - - E10 3 1 $120,000 $120,000 33.3 97 E10 1 - - - - - E11 72 16 $118,707 $110,400 22.2 96 E11 4 2 $307,594 $307,594 50.0 100 E12 1 - - - - - E12 - - - - - - E13 16 7 $196,071 $175,000 43.8 99 E13 1 - - - - - E14 6 8 $183,563 $177,750 133.3 98 E14 6 - - - - - E15 26 7 $236,857 $225,000 26.9 98 E15 5 4 $257,325 $261,500 80.0 96 E16 17 - - - - - E16 6 3 $181,333 $180,000 50.0 93 E17 10 5 $158,080 $148,500 50.0 97 E17 20 8 $251,099 $249,000 40.0 99 E18 - - - - - - E18 - - - - - - E19 - - - - - - E19 1 2 $288,500 $288,500 200.0 100 E20 3 - - - - - E20 1 1 $225,000 $225,000 100.0 98 E21 2 - - - - - E21 - - - - - - Condo Townhouse Detached Condo Area Act Sales Av. Price Med. Price % S-A Av. % List Area Act Sales Av. Price Med. Price % S-A Av. % List E01 - 5 $299,400 $295,000 - 100 E01 - - - - - - E02 8 4 $454,075 $485,950 50.0 100 E02 - - - - - - E03 7 - - - - - E03 - - - - - - E04 11 6 $336,750 $328,750 54.6 100 E04 - - - - - - E05 14 12 $255,575 $247,400 85.7 101 E05 - - - - - - E06 1 - - - - - E06 - - - - - - E07 2 5 $315,800 $298,000 250.0 101 E07 - - - - - - E08 19 5 $239,800 $232,000 26.3 98 E08 - - - - - - E09 29 8 $192,063 $202,500 27.6 97 E09 - - - - - - E10 5 2 $206,000 $206,000 40.0 97 E10 - - - - - - E11 33 3 $223,667 $195,000 9.1 98 E11 - 1 $201,000 $201,000 - 96 E12 9 3 $278,900 $298,900 33.3 100 E12 - - - - - - E13 19 9 $256,000 $283,000 47.4 98 E13 - - - - - - E14 18 3 $207,583 $229,000 16.7 97 E14 - - - - - - E15 9 6 $191,900 $196,000 66.7 98 E15 - - - - - - E16 36 11 $134,827 $127,500 30.6 97 E16 - - - - - - E17 6 2 $160,000 $160,000 33.3 98 E17 - - - - - - E18 - - - - - - E18 - - - - - - E19 - - - - - - E19 - - - - - - E20 1 - - - - - E20 - - - - - - E21 1 - - - - - E21 - - - - - - TORONTO REAL ESTATE BOARD 5
  • 6. SINGLE FAMILY EAST BREAKDOWN - JANuARY 2010 East District Co-op Apartment Attached/Row/Townhouse Area Act Sales Av. Price Med. Price % S-A Av. % List Area Act Sales Av. Price Med. Price % S-A Av. % List E01 - - - - - - E01 5 6 $419,750 $442,500 120.0 102 E02 - 1 $330,000 $330,000 - 97 E02 5 3 $490,333 $361,000 60.0 104 E03 - - - - - - E03 3 2 $451,250 $451,250 66.7 98 E04 - - - - - - E04 7 1 $328,000 $328,000 14.3 99 E05 - - - - - - E05 1 1 $338,800 $338,800 100.0 108 E06 - - - - - - E06 5 1 $390,000 $390,000 20.0 98 E07 - - - - - - E07 3 2 $335,000 $335,000 66.7 106 E08 - - - - - - E08 5 1 $311,100 $311,100 20.0 104 E09 1 - - - - - E09 5 1 $323,500 $323,500 20.0 98 E10 - - - - - - E10 3 5 $361,000 $344,000 166.7 102 E11 - - - - - - E11 12 10 $277,980 $255,000 83.3 98 E12 - - - - - - E12 6 - - - - - E13 - - - - - - E13 13 8 $277,963 $275,500 61.5 98 E14 - - - - - - E14 16 15 $266,200 $272,500 93.8 99 E15 - - - - - - E15 8 10 $245,150 $245,500 125.0 100 E16 1 - - - - - E16 9 3 $211,000 $220,000 33.3 99 E17 - - - - - - E17 21 9 $201,533 $200,500 42.9 98 E18 - - - - - - E18 - - - - - - E19 - - - - - - E19 5 3 $253,629 $249,888 60.0 99 E20 - - - - - - E20 - - - - - - E21 - - - - - - E21 - - - - - - West District Current Month: January 2010 Area Active New Sales $ Volume Avg Price Med Price Avg DOM Avg %List W01 52 57 32 $15,493,767 $484,180 $385,635 26 102 W02 71 72 46 $21,558,004 $468,652 $414,000 20 105 W03 117 91 36 $11,559,000 $321,083 $325,000 24 101 W04 187 114 62 $19,957,250 $321,891 $317,000 36 98 W05 314 191 70 $20,293,200 $289,903 $302,500 34 97 W06 152 106 63 $24,424,554 $387,691 $349,000 28 99 W07 65 80 38 $17,613,013 $463,500 $476,500 17 101 W08 140 121 66 $35,831,300 $542,898 $379,500 33 99 W09 118 73 28 $8,214,578 $293,378 $272,000 29 96 W10 285 177 59 $14,577,400 $247,075 $212,500 35 97 W12 158 126 59 $26,961,686 $456,978 $370,500 38 97 W13 142 108 33 $25,197,500 $763,561 $493,000 21 99 W14 68 54 30 $10,744,599 $358,153 $352,500 33 98 W15 302 286 140 $38,163,965 $272,600 $240,000 25 98 W16 83 98 58 $24,171,360 $416,748 $389,500 30 99 W17 - - - - - - - - W18 88 42 30 $8,395,651 $279,855 $280,500 35 97 W19 243 242 117 $45,907,815 $392,374 $375,000 19 99 W20 213 263 138 $57,401,216 $415,951 $397,250 17 99 W21 270 204 115 $70,357,887 $611,808 $539,999 28 98 W22 84 124 91 $34,801,300 $382,432 $368,000 16 99 W23 532 533 300 $100,624,975 $335,417 $327,625 28 98 W24 435 384 199 $73,117,301 $367,424 $349,900 27 98 W25 78 51 32 $12,176,350 $380,511 $326,000 38 98 W26 27 9 5 $2,780,500 $556,100 $482,500 115 95 W27 129 95 58 $23,451,100 $404,329 $392,950 33 98 W28 156 84 43 $20,571,800 $478,414 $448,000 35 98 W29 105 74 32 $9,717,513 $303,672 $255,450 33 97 TOTAL 4,614 3,859 1,979 $773,769,584 $390,990 $346,000 27 99 6 TORONTO REAL ESTATE BOARD
  • 7. SINGLE FAMILY WEST BREAKDOWN - JANuARY 2010 West District West District West District 80 Days on Market 80 Sales Active Listing Ratio 60 60 40 40 20 20 0 0 Jan Feb Mar Apr May Jun Jul Aug Sep Oct Nov Dec Jan Jan Feb Mar Apr May Jun Jul Aug Sep Oct Nov Dec jan 2009 2010 2009 2010 Year-to-Date: January 2010 Area Listed Sales $ Volume Avg Price Med Price Avg DOM Avg %List W01 57 32 $15,493,767 $484,180 $385,635 26 102 W02 72 46 $21,558,004 $468,652 $414,000 20 105 W03 90 36 $11,559,000 $321,083 $325,000 24 101 W04 114 62 $19,957,250 $321,891 $317,000 36 98 W05 190 70 $20,293,200 $289,903 $302,500 34 97 W06 106 63 $24,424,554 $387,691 $349,000 28 99 W07 79 38 $17,613,013 $463,500 $476,500 17 101 W08 121 66 $35,831,300 $542,898 $379,500 33 99 W09 73 28 $8,214,578 $293,378 $272,000 29 96 W10 174 59 $14,577,400 $247,075 $212,500 35 97 W12 123 59 $26,961,686 $456,978 $370,500 38 97 W13 107 33 $25,197,500 $763,561 $493,000 21 99 W14 54 30 $10,744,599 $358,153 $352,500 33 98 W15 284 140 $38,163,965 $272,600 $240,000 25 98 W16 98 58 $24,171,360 $416,748 $389,500 30 99 W17 - - - - - - - W18 42 30 $8,395,651 $279,855 $280,500 35 97 W19 242 117 $45,907,815 $392,374 $375,000 19 99 W20 262 138 $57,401,216 $415,951 $397,250 17 99 W21 203 115 $70,357,887 $611,808 $539,999 28 98 W22 124 91 $34,801,300 $382,432 $368,000 16 99 W23 530 300 $100,624,975 $335,417 $327,625 28 98 W24 379 199 $73,117,301 $367,424 $349,900 27 98 W25 51 32 $12,176,350 $380,511 $326,000 38 98 W26 9 5 $2,780,500 $556,100 $482,500 115 95 W27 95 58 $23,451,100 $404,329 $392,950 33 98 W28 84 43 $20,571,800 $478,414 $448,000 35 98 W29 73 32 $9,717,513 $303,672 $255,450 33 97 TOTAL 3,836 1,979 $773,769,584 $390,990 $346,000 27 99 TORONTO REAL ESTATE BOARD 7
  • 8. SINGLE FAMILY WEST BREAKDOWN - JANuARY 2010 West District Detached Houses Semi-Detached Houses Area Act Sales Av. Price Med. Price % S-A Av. % List Area Act Sales Av. Price Med. Price % S-A Av. % List W01 20 11 $786,102 $761,000 55.0 101 W01 4 4 $410,348 $424,697 100.0 112 W02 28 14 $656,109 $527,294 50.0 103 W02 17 17 $406,937 $403,000 100.0 105 W03 67 23 $329,978 $329,000 34.3 102 W03 32 8 $367,438 $352,000 25.0 100 W04 70 28 $432,234 $437,500 40.0 99 W04 13 6 $359,917 $368,250 46.2 99 W05 59 16 $454,744 $430,500 27.1 99 W05 53 23 $328,174 $326,500 43.4 98 W06 35 15 $424,367 $435,000 42.9 100 W06 4 2 $414,000 $414,000 50.0 100 W07 31 14 $566,542 $537,350 45.2 104 W07 - - - - - - W08 85 25 $996,236 $761,200 29.4 100 W08 - 1 $429,000 $429,000 - 102 W09 30 11 $491,091 $460,000 36.7 100 W09 5 1 $328,800 $328,800 20.0 100 W10 63 22 $351,623 $347,500 34.9 97 W10 7 4 $329,250 $313,250 57.1 99 W12 104 25 $649,260 $565,000 24.0 97 W12 4 6 $374,798 $375,250 150.0 99 W13 90 18 $1,199,556 $1,015,000 20.0 99 W13 8 5 $336,500 $335,000 62.5 97 W14 12 11 $558,455 $526,500 91.7 100 W14 4 3 $417,467 $417,500 75.0 97 W15 12 10 $535,580 $505,000 83.3 99 W15 3 7 $382,214 $360,000 233.3 99 W16 40 29 $504,828 $451,000 72.5 99 W16 17 11 $345,236 $345,500 64.7 102 W17 - - - - - - W17 - - - - - - W18 29 13 $311,662 $325,000 44.8 96 W18 20 11 $273,705 $279,500 55.0 97 W19 79 39 $564,842 $515,000 49.4 99 W19 23 18 $388,100 $392,000 78.3 101 W20 71 56 $543,737 $515,750 78.9 100 W20 35 35 $380,186 $378,000 100.0 100 W21 172 83 $696,846 $615,000 48.3 98 W21 3 3 $410,633 $395,000 100.0 100 W22 52 42 $470,431 $456,500 80.8 98 W22 16 10 $338,950 $336,250 62.5 101 W23 325 170 $379,195 $370,000 52.3 98 W23 94 71 $294,357 $289,000 75.5 98 W24 270 115 $455,193 $451,000 42.6 98 W24 41 28 $303,214 $295,250 68.3 98 W25 44 12 $545,867 $431,250 27.3 98 W25 2 2 $349,500 $349,500 100.0 103 W26 27 5 $556,100 $482,500 18.5 95 W26 - - - - - - W27 110 48 $435,804 $423,250 43.6 99 W27 2 2 $320,500 $320,500 100.0 98 W28 145 35 $512,880 $465,000 24.1 98 W28 1 6 $336,667 $335,000 600.0 99 W29 75 22 $336,673 $298,000 29.3 97 W29 7 1 $231,900 $231,900 14.3 98 Condo Apartment Link Area Act Sales Av. Price Med. Price % S-A Av. % List Area Act Sales Av. Price Med. Price % S-A Av. % List W01 20 10 $285,325 $269,000 50.0 98 W01 - - - - - - W02 16 10 $352,015 $348,950 62.5 105 W02 - - - - - - W03 13 5 $206,000 $220,000 38.5 99 W03 - - - - - - W04 71 17 $157,224 $157,000 23.9 96 W04 - - - - - - W05 111 16 $136,906 $139,000 14.4 96 W05 - - - - - - W06 103 41 $353,977 $333,888 39.8 99 W06 - - - - - - W07 28 15 $319,867 $282,000 53.6 99 W07 - - - - - - W08 48 36 $255,997 $221,750 75.0 98 W08 - - - - - - W09 70 14 $133,127 $117,000 20.0 93 W09 - - - - - - W10 156 29 $161,990 $158,000 18.6 97 W10 1 - - - - - W12 35 19 $253,911 $240,000 54.3 97 W12 - - - - - - W13 12 2 $148,000 $148,000 16.7 96 W13 - - - - - - W14 23 3 $198,000 $205,000 13.0 97 W14 - - - - - - W15 253 107 $235,464 $230,000 42.3 98 W15 - - - - - - W16 15 5 $371,600 $338,500 33.3 98 W16 - 2 $407,000 $407,000 - 102 W17 - - - - - - W17 - - - - - - W18 18 3 $173,500 $156,500 16.7 98 W18 - - - - - - W19 100 30 $232,317 $205,501 30.0 97 W19 2 4 $411,500 $411,500 200.0 97 W20 38 9 $211,881 $232,000 23.7 97 W20 6 2 $414,000 $414,000 33.3 101 W21 60 6 $362,648 $272,495 10.0 97 W21 1 - - - - - W22 2 1 $196,000 $196,000 50.0 100 W22 - - - - - - W23 31 8 $190,244 $186,000 25.8 96 W23 - 2 $358,950 $358,950 - 97 W24 44 20 $167,185 $171,000 45.5 97 W24 1 1 $268,000 $268,000 100.0 96 W25 12 7 $210,393 $214,000 58.3 98 W25 - 1 $312,000 $312,000 - 97 W26 - - - - - - W26 - - - - - - W27 - 4 $232,750 $256,000 - 98 W27 1 - - - - - W28 3 - - - - - W28 - - - - - - W29 14 1 $369,900 $369,900 7.1 100 W29 - - - - - - 8 TORONTO REAL ESTATE BOARD
  • 9. SINGLE FAMILY WEST BREAKDOWN - JANuARY 2010 West District Condo Townhouse Detached Condo Area Act Sales Av. Price Med. Price % S-A Av. % List Area Act Sales Av. Price Med. Price % S-A Av. % List W01 5 5 $365,600 $363,000 100.0 104 W01 - - - - - - W02 5 1 $357,900 $357,900 20.0 99 W02 - - - - - - W03 2 - - - - - W03 - - - - - - W04 29 7 $249,843 $245,500 24.1 98 W04 - - - - - - W05 84 13 $224,215 $218,000 15.5 98 W05 - - - - - - W06 4 1 $482,000 $482,000 25.0 99 W06 - - - - - - W07 - - - - - - W07 - - - - - - W08 5 4 $320,125 $313,500 80.0 102 W08 - - - - - - W09 7 1 $289,000 $289,000 14.3 100 W09 - - - - - - W10 55 3 $153,000 $173,500 5.5 95 W10 - - - - - - W12 11 8 $414,638 $297,000 72.7 98 W12 1 - - - - - W13 31 7 $196,714 $195,000 22.6 97 W13 - - - - - - W14 28 12 $194,600 $151,250 42.9 97 W14 - - - - - - W15 34 16 $308,624 $281,500 47.1 99 W15 - - - - - - W16 10 10 $270,176 $249,750 100.0 98 W16 - - - - - - W17 - - - - - - W17 - - - - - - W18 18 3 $270,933 $294,000 16.7 98 W18 - - - - - - W19 30 21 $306,645 $312,000 70.0 99 W19 - - - - - - W20 45 28 $283,411 $270,450 62.2 100 W20 - - - - - - W21 15 5 $277,400 $290,000 33.3 97 W21 - - - - - - W22 3 3 $210,333 $217,000 100.0 96 W22 - - - - - - W23 47 14 $228,507 $239,000 29.8 98 W23 - - - - - - W24 45 15 $197,633 $194,000 33.3 97 W24 4 - - - - - W25 10 8 $302,813 $282,500 80.0 98 W25 - - - - - - W26 - - - - - - W26 - - - - - - W27 12 3 $225,167 $212,000 25.0 96 W27 - - - - - - W28 3 - - - - - W28 - - - - - - W29 7 2 $189,250 $189,250 28.6 98 W29 - - - - - - Co-op Apartment Attached/Row/Townhouse Area Act Sales Av. Price Med. Price % S-A Av. % List Area Act Sales Av. Price Med. Price % S-A Av. % List W01 - 1 $169,000 $169,000 - 97 W01 3 1 $355,000 $355,000 33.3 93 W02 - - - - - - W02 5 4 $394,125 $373,250 80.0 107 W03 - - - - - - W03 3 - - - - - W04 - - - - - - W04 4 4 $318,375 $317,000 100.0 100 W05 3 1 $84,000 $84,000 33.3 93 W05 4 1 $280,000 $280,000 25.0 97 W06 2 - - - - - W06 4 4 $559,000 $545,000 100.0 102 W07 1 1 $122,500 $122,500 100.0 98 W07 5 8 $595,116 $592,013 160.0 101 W08 2 - - - - - W08 - - - - - - W09 5 - - - - - W09 1 1 $331,000 $331,000 100.0 95 W10 2 - - - - - W10 1 1 $368,000 $368,000 100.0 97 W12 - - - - - - W12 3 1 $340,000 $340,000 33.3 99 W13 - - - - - - W13 1 1 $250,000 $250,000 100.0 122 W14 - - - - - - W14 1 1 $419,999 $419,999 100.0 98 W15 - - - - - - W15 - - - - - - W16 - - - - - - W16 1 1 $360,000 $360,000 100.0 100 W17 - - - - - - W17 - - - - - - W18 - - - - - - W18 3 - - - - - W19 1 - - - - - W19 8 5 $367,630 $365,500 62.5 100 W20 - - - - - - W20 18 8 $371,875 $381,500 44.4 98 W21 - - - - - - W21 19 18 $429,161 $361,050 94.7 99 W22 - - - - - - W22 11 35 $309,334 $305,000 318.2 100 W23 - - - - - - W2 3 35 35 $280,671 $279,900 100.0 98 W24 - - - - - - W24 30 20 $285,195 $289,000 69.0 98 W25 2 - - - - - W25 8 2 $359,850 $359,850 25.0 100 W26 - - - - - - W26 - - - - - - W27 - - - - - - W27 4 1 $285,000 $285,000 25.0 98 W28 - - - - - - W28 4 2 $300,500 $300,500 50.0 100 W29 - - - - - - W29 2 6 $221,733 $227,750 300.0 98 TORONTO REAL ESTATE BOARD 9
  • 10. Central District Current Month: January 2010 Area Active New Sales $ Volume Avg Price Med Price Avg DOM Avg%List C01 484 479 210 $87,540,052 $416,857 $363,650 23 101 C02 142 97 34 $25,175,103 $740,444 $574,000 31 101 C03 87 58 32 $22,508,900 $703,403 $412,450 29 99 C04 139 145 63 $47,910,734 $760,488 $735,000 25 102 C06 49 38 18 $9,327,100 $518,172 $470,000 20 98 C07 182 179 91 $37,869,368 $416,147 $353,000 23 100 C08 201 210 100 $37,305,295 $373,053 $335,045 16 101 C09 55 44 13 $15,210,180 $1,170,014 $679,000 16 101 C10 100 106 45 $29,993,000 $666,511 $580,000 17 104 C11 60 45 24 $12,259,400 $510,808 $430,500 20 100 C12 99 59 21 $29,984,850 $1,427,850 $1,250,000 44 98 C13 79 84 33 $12,720,914 $385,482 $325,000 25 100 C14 173 189 117 $53,306,588 $455,612 $342,000 22 101 C15 168 162 81 $35,628,350 $439,856 $333,000 25 100 TOTAL 2,018 1,895 882 $456,739,834 $517,846 $385,000 23 101 Central District Central District 80 Days on Market 80 Sales Active Listing Ratio 60 60 40 40 20 20 0 0 Jan Feb Mar Apr May Jun Jul Aug Sep Oct Nov Dec Jan Jan Feb Mar Apr May Jun Jul Aug Sep Oct Nov Dec Jan 2009 2010 2009 2010 Year-to-Date: January 2010 Area Listed Sales $ Volume Avg Price Med Price Avg DOM Avg%List C01 475 210 $87,540,052 $416,857 $363,650 23 101 C02 97 34 $25,175,103 $740,444 $574,000 31 101 C03 58 32 $22,508,900 $703,403 $412,450 29 99 C04 143 63 $47,910,734 $760,488 $735,000 25 102 C06 38 18 $9,327,100 $518,172 $470,000 20 98 C07 179 91 $37,869,368 $416,147 $353,000 23 100 C08 209 100 $37,305,295 $373,053 $335,045 16 101 C09 44 13 $15,210,180 $1,170,014 $679,000 16 101 C10 106 45 $29,993,000 $666,511 $580,000 17 104 C11 45 24 $12,259,400 $510,808 $430,500 20 100 C12 59 21 $29,984,850 $1,427,850 $1,250,000 44 98 C13 83 33 $12,720,914 $385,482 $325,000 25 100 C14 189 117 $53,306,588 $455,612 $342,000 22 101 C15 162 81 $35,628,350 $439,856 $333,000 25 100 TOTAL 1,887 882 $456,739,834 $517,846 $385,000 23 101 10 TORONTO REAL ESTATE BOARD
  • 11. SINGLE FAMILY CENTRAL BREAKDOWN - JANuARY 2010 Central District Detached Houses Semi-Detached Houses Area Act Sales Av. Price Med. Price % S-A Av. % List Area Act Sales Av. Price Med. Price % S-A Av.% List C01 9 - - - - - C01 22 10 $620,150 $606,500 45.5 98 C02 25 7 $869,357 $630,000 28.0 98 C02 27 8 $667,263 $598,500 29.6 102 C03 49 19 $811,168 $575,000 38.8 99 C03 10 8 $494,588 $366,850 80.0 101 C04 95 43 $956,309 $918,600 45.3 103 C04 1 2 $675,875 $675,875 200.0 111 C06 32 10 $728,690 $608,450 31.3 98 C06 2 - - - - - C07 55 21 $665,185 $565,000 38.2 99 C07 5 2 $456,000 $456,000 40.0 101 C08 5 - - - - - C08 7 5 $631,000 $629,000 71.4 99 C09 30 4 $2,201,250 $2,152,500 13.3 100 C09 1 3 $1,050,060 $615,000 300.0 101 C10 37 17 $932,647 $735,000 46.0 105 C10 3 2 $679,000 $679,000 66.7 109 C11 12 10 $890,550 $877,500 83.3 103 C11 - 2 $610,000 $610,000 - 103 C12 76 13 $1,838,231 $1,650,000 17.1 97 C12 1 1 $562,000 $562,000 100.0 113 C13 13 7 $667,714 $655,000 53.9 101 C13 6 2 $450,000 $450,000 33.3 105 C14 55 25 $852,460 $725,000 45.5 101 C14 - - - - - - C15 32 17 $847,347 $818,000 53.1 101 C15 13 3 $438,333 $437,000 23.1 100 Condo Apartment Link Area Act Sales Av. Price Med. Price % S-A Av. % List Area Act Sales Av. Price Med. Price % S-A Av.% List C01 422 182 $397,402 $351,000 43.1 101 C01 - - - - - - C02 72 13 $629,500 $431,000 18.1 101 C02 - - - - - - C03 19 3 $941,000 $535,000 15.8 97 C03 - - - - - - C04 34 14 $295,364 $292,500 41.2 97 C04 - - - - - - C06 13 8 $255,025 $253,900 61.5 99 C06 - - - - - - C07 100 58 $325,724 $314,000 58.0 101 C07 - - - - - - C08 174 82 $347,644 $325,625 47.1 102 C08 - - - - - - C09 17 4 $488,750 $495,000 23.5 101 C09 - - - - - - C10 49 24 $438,583 $406,000 49.0 102 C10 - - - - - - C11 38 11 $181,627 $189,900 29.0 96 C11 - - - - - - C12 19 5 $871,370 $584,250 26.3 97 C12 - - - - - - C13 57 21 $266,495 $257,000 36.8 98 C13 - - - - - - C14 106 86 $332,321 $319,500 81.1 101 C14 - - - - - - C15 106 42 $335,964 $309,500 39.6 100 C15 - 3 $453,600 $455,300 - 103 Condo Townhouse Detached Condo Area Act Sales Av. Price Med. Price % S-A Av. % List Area Act Sales Av. Price Med. Price % S-A Av.% List C01 21 14 $492,021 $428,050 66.7 101 C01 - - - - - - C02 7 - - - - - C02 - - - - - - C03 1 - - - - - C03 - - - - - - C04 - 1 $605,100 $605,100 - 101 C04 - - - - - - C06 1 - - - - - C06 - - - - - - C07 14 7 $348,811 $360,000 50.0 100 C07 - - - - - - C08 8 4 $281,000 $294,501 50.0 100 C08 - - - - - - C09 1 - - - - - C09 - - - - - - C10 7 2 $1,127,000 $1,127,000 28.6 97 C10 1 - - - - - C11 10 1 $136,000 $136,000 10.0 98 C11 - - - - - - C12 3 2 $584,500 $584,500 66.7 99 C12 - - - - - - C13 - 1 $478,513 $478,513 - 105 C13 - - - - - - C14 7 2 $542,500 $542,500 28.6 99 C14 - - - - - - C15 17 16 $277,324 $252,000 94.1 99 C15 - - - - - - TORONTO REAL ESTATE BOARD 11
  • 12. SINGLE FAMILY CENTRAL BREAKDOWN - JANuARY 2010 Central District Co-op Apartment Attached/Row/Townhouse Area Act Sales Av. Price Med. Price % S-A Av. % List Area Act Sales Av. Price Med. Price % S-A Av. % List C01 - - - - - - C01 10 4 $530,750 $511,500 40.0 103 C02 4 1 $175,000 $175,000 25.0 96 C02 7 5 $1,078,600 $1,170,000 71.4 103 C03 7 2 $158,500 $158,500 28.6 96 C03 1 - - - - - C04 8 2 $120,000 $120,000 25.0 95 C04 1 1 $457,500 $457,500 100.0 100 C06 - - - - - - C06 1 - - - - - C07 - - - - - - C07 8 3 $551,600 $545,000 37.5 99 C08 1 3 $227,333 $250,000 300.0 97 C08 6 6 $639,583 $600,000 100.0 96 C09 6 1 $451,000 $451,000 16.7 116 C09 - 1 $849,000 $849,000 - 100 C10 1 - - - - - C10 2 - - - - - C11 - - - - - - C11 - - - - - - C12 - - - - - - C12 - - - - - - C13 1 - - - - - C13 2 2 $536,000 $536,000 100.0 102 C14 1 1 $187,500 $187,500 100.0 104 C14 4 3 $714,333 $693,000 75.0 100 C15 - - - - - - C15 - - - - - - North District Current Month: January 2010 Area Active New Sales $ Volume Avg Price Med Price Avg DOM Avg %List N01 63 61 40 $22,447,250 $561,181 $491,250 24 100 N02 143 132 57 $28,142,301 $493,725 $417,000 20 100 N03 200 206 114 $50,142,300 $439,845 $384,250 22 99 N04 112 122 66 $34,858,388 $528,157 $516,500 24 100 N05 110 93 61 $32,414,391 $531,383 $511,500 27 99 N06 119 91 39 $19,374,941 $496,793 $382,000 43 100 N07 115 132 73 $27,585,490 $377,883 $350,000 25 98 N08 346 298 146 $70,763,240 $484,680 $460,700 26 99 N10 87 75 35 $16,441,000 $469,743 $475,000 20 99 N11 247 232 140 $70,433,072 $503,093 $489,400 24 100 N12 75 55 32 $14,779,000 $461,844 $414,000 44 98 N13 76 30 8 $4,699,500 $587,438 $473,750 97 97 N14 101 42 16 $8,886,800 $555,425 $538,450 54 97 N15 66 46 19 $9,109,000 $479,421 $435,000 58 97 N16 105 54 20 $7,821,100 $391,055 $384,500 59 97 N17 194 100 45 $11,796,600 $262,147 $260,000 46 97 N18 101 63 21 $6,777,755 $322,750 $295,000 87 98 N19 131 60 29 $7,490,200 $258,283 $229,000 50 97 N20 29 9 3 $1,395,000 $465,000 $485,000 89 94 N21 36 11 1 $318,000 $318,000 $318,000 87 96 N22 71 40 12 $5,653,400 $471,117 $369,950 79 96 N23 166 74 19 $4,216,000 $221,895 $230,000 70 96 N24 94 30 5 $884,150 $176,830 $159,650 77 92 TOTAL 2,787 2,056 1,001 $456,428,878 $455,973 $422,000 33 99 12 TORONTO REAL ESTATE BOARD
  • 13. North District North District North District 80 Days on Market 80 Sales Active Listing Ratio 60 60 40 40 20 20 0 0 Jan Feb Mar Apr May Jun Jul Aug Sep Oct Nov Dec Jan Jan Feb Mar Apr May Jun Jul Aug Sep Oct Nov Dec Jan 2009 2010 2009 2010 Year-to-Date: January 2010 Area Listed Sales $ Volume Avg Price Med Price Avg DOM Avg %List N01 60 40 $22,447,250 $561,181 $491,250 24 100 N02 131 57 $28,142,301 $493,725 $417,000 20 100 N03 205 114 $50,142,300 $439,845 $384,250 22 99 N04 121 66 $34,858,388 $528,157 $516,500 24 100 N05 93 61 $32,414,391 $531,383 $511,500 27 99 N06 90 39 $19,374,941 $496,793 $382,000 43 100 N07 132 73 $27,585,490 $377,883 $350,000 25 98 N08 296 146 $70,763,240 $484,680 $460,700 26 99 N10 75 35 $16,441,000 $469,743 $475,000 20 99 N11 232 140 $70,433,072 $503,093 $489,400 24 100 N12 55 32 $14,779,000 $461,844 $414,000 44 98 N13 30 8 $4,699,500 $587,438 $473,750 97 97 N14 42 16 $8,886,800 $555,425 $538,450 54 97 N15 46 19 $9,109,000 $479,421 $435,000 58 97 N16 53 20 $7,821,100 $391,055 $384,500 59 97 N17 96 45 $11,796,600 $262,147 $260,000 46 97 N18 63 21 $6,777,755 $322,750 $295,000 87 98 N19 60 29 $7,490,200 $258,283 $229,000 50 97 N20 9 3 $1,395,000 $465,000 $485,000 89 94 N21 10 1 $318,000 $318,000 $318,000 87 96 N22 40 12 $5,653,400 $471,117 $369,950 79 96 N23 72 19 $4,216,000 $221,895 $230,000 70 96 N24 30 5 $884,150 $176,830 $159,650 77 92 TOTAL 2,041 1,001 $456,428,878 $455,973 $422,000 33 99 TORONTO REAL ESTATE BOARD 13
  • 14. SINGLE FAMILY NORTH BREAKDOWN - JANuARY 2010 North District Detached Houses Semi-Detached Houses Area Act Sales Av. Price Med. Price % S-A Av. % List Area Act Sales Av. Price Med. Price % S-A Av. % List N01 37 22 $740,680 $624,500 59.5 99 N01 - 1 $400,000 $400,000 - 98 N02 73 23 $707,250 $574,250 31.5 100 N02 - 2 $399,000 $399,000 - 109 N03 93 36 $697,002 $639,500 38.7 100 N03 6 4 $459,950 $459,950 66.7 99 N04 78 47 $588,289 $591,200 60.3 100 N04 7 5 $411,500 $421,000 71.4 99 N05 103 45 $575,537 $545,000 43.7 98 N05 2 6 $405,750 $407,500 300.0 101 N06 81 21 $649,929 $549,000 25.9 98 N06 7 7 $311,786 $317,500 100.0 102 N07 83 47 $417,445 $403,000 56.6 98 N07 5 10 $307,819 $323,495 200.0 99 N08 230 83 $573,175 $535,000 36.1 99 N08 22 24 $404,878 $407,000 109.1 101 N10 44 22 $536,959 $526,000 50.0 98 N10 3 2 $380,500 $380,500 66.7 103 N11 122 78 $617,051 $579,450 63.9 101 N11 11 8 $399,188 $392,000 72.7 100 N12 63 22 $519,727 $461,500 34.9 97 N12 1 4 $358,500 $360,250 400.0 102 N13 76 8 $587,438 $473,750 10.5 97 N13 - - - - - - N14 97 15 $572,720 $566,900 15.5 97 N14 - - - - - - N15 61 17 $502,353 $448,000 27.9 97 N15 - - - - - - N16 84 17 $430,006 $409,000 20.2 98 N16 1 - - - - - N17 186 39 $269,778 $275,000 21.0 97 N17 4 1 $231,000 $231,000 25.0 96 N18 86 15 $347,533 $310,500 17.4 98 N18 1 2 $263,750 $263,750 200.0 97 N19 78 17 $272,612 $278,000 21.8 98 N19 6 2 $213,500 $213,500 33.3 99 N20 29 3 $465,000 $485,000 10.3 94 N20 - - - - - - N21 36 1 $318,000 $318,000 2.8 96 N21 - - - - - - N22 62 11 $496,400 $449,900 17.7 96 N22 1 - - - - - N23 160 17 $223,471 $230,000 10.6 96 N23 1 - - - - - N24 88 4 $183,663 $188,325 4.6 90 N24 - - - - - - Condo Apartment Link Area Act Sales Av. Price Med. Price % S-A Av. % List Area Act Sales Av. Price Med. Price % S-A Av. % List N01 13 12 $326,192 $282,500 92.3 100 N01 3 - - - - - N02 52 22 $310,911 $323,000 42.3 100 N02 6 3 $411,333 $412,000 50.0 99 N03 65 49 $268,602 $256,000 75.4 98 N03 3 2 $477,500 $477,500 66.7 106 N04 15 4 $257,000 $239,000 26.7 99 N04 - - - - - - N05 - - - - - - N05 - - - - - - N06 12 4 $273,448 $274,900 33.3 100 N06 2 - - - - - N07 8 4 $260,375 $255,750 50.0 98 N07 - - - - - - N08 61 13 $293,385 $280,000 21.3 96 N08 3 3 $472,500 $500,000 100.0 99 N10 26 3 $239,333 $237,000 11.5 97 N10 13 6 $408,233 $407,500 46.2 101 N11 77 21 $305,152 $288,000 27.3 98 N11 10 4 $460,125 $466,500 40.0 102 N12 4 - - - - - N12 - - - - - - N13 - - - - - - N13 - - - - - - N14 2 - - - - - N14 - - - - - - N15 - - - - - - N15 - - - - - - N16 10 1 $120,000 $120,000 10.0 96 N16 - 1 $253,000 $253,000 - 97 N17 2 1 $140,000 $140,000 50.0 98 N17 - - - - - - N18 6 - - - - - N18 3 4 $259,314 $263,000 133.3 99 N19 11 1 $191,000 $191,000 9.1 98 N19 2 2 $219,250 $219,250 100.0 97 N20 - - - - - - N20 - - - - - - N21 - - - - - - N21 - - - - - - N22 - - - - - - N22 5 - - - - - N23 - - - - - - N23 2 - - - - - N24 - - - - - - N24 - - - - - - 14 TORONTO REAL ESTATE BOARD
  • 15. SINGLE FAMILY NORTH BREAKDOWN - JANuARY 2010 North District Condo Townhouse Detached Condo Area Act Sales Av. Price Med. Price % S-A Av. % List Area Act Sales Av. Price Med. Price % S-A Av. % List N01 10 4 $340,750 $321,500 40.0 98 N01 - - - - - - N02 8 5 $392,300 $431,000 62.5 98 N02 1 - - - - - N03 19 8 $318,688 $314,500 42.1 100 N03 - - - - - - N04 3 2 $326,250 $326,250 66.7 96 N04 - - - - - - N05 - 1 $335,000 $335,000 - 91 N05 - - - - - - N06 8 1 $315,000 $315,000 12.5 105 N06 - - - - - - N07 10 4 $300,150 $274,800 40.0 99 N07 - - - - - - N08 8 2 $276,500 $276,500 25.0 101 N08 - - - - - - N10 - 2 $349,750 $349,750 - 101 N10 - - - - - - N11 9 14 $345,829 $335,000 155.6 99 N11 1 - - - - - N12 - 1 $290,000 $290,000 - 97 N12 1 - - - - - N13 - - - - - - N13 - - - - - - N14 2 - - - - - N14 - - - - - - N15 - - - - - - N15 - - - - - - N16 4 1 $138,000 $138,000 25.0 94 N16 - - - - - - N17 1 - - - - - N17 1 - - - - - N18 4 - - - - - N18 - - - - - - N19 5 - - - - - N19 22 3 $321,000 $315,000 13.6 97 N20 - - - - - - N20 - - - - - - N21 - - - - - - N21 - - - - - - N22 - - - - - - N22 - - - - - - N23 - - - - - - N23 - - - - - - N24 6 1 $149,500 $149,500 16.7 98 N24 - - - - - - Co-op Apartment Attached/Row/Townhouse Area Act Sales Av. Price Med. Price % S-A Av. % List Area Act Sales Av. Price Med. Price % S-A Av. % List N01 - - - - - - N01 - 1 $475,000 $475,000 - 106 N02 - - - - - - N02 3 2 $521,000 $521,000 66.7 99 N03 - - - - - - N03 14 15 $436,295 $444,000 107.1 102 N04 - - - - - - N04 9 8 $433,850 $425,250 88.9 100 N05 - - - - - - N05 5 9 $416,190 $412,000 180.0 101 N06 - - - - - - N06 9 6 $355,859 $342,000 66.7 100 N07 - - - - - - N07 9 8 $330,663 $330,250 88.9 102 N08 - - - - - - N08 22 21 $366,102 $385,000 95.5 100 N10 - - - - - - N10 1 - - - - - N11 - - - - - - N11 17 15 $401,286 $375,000 88.2 101 N12 - - - - - - N12 6 5 $324,200 $326,000 83.3 99 N13 - - - - - - N13 - - - - - - N14 - - - - - - N14 - 1 $296,000 $296,000 - 99 N15 - - - - - - N15 5 2 $284,500 $284,500 40.0 99 N16 - - - - - - N16 6 - - - - - N17 - - - - - - N17 - 4 $226,063 $228,750 - 98 N18 - - - - - - N18 1 - - - - - N19 - - - - - - N19 7 4 $209,075 $204,200 57.1 95 N20 - - - - - - N20 - - - - - - N21 - - - - - - N21 - - - - - - N22 - - - - - - N22 3 1 $193,000 $193,000 33.3 97 N23 - - - - - - N23 3 2 $208,500 $208,500 66.7 97 N24 - - - - - - N24 - - - - - - TORONTO REAL ESTATE BOARD 15
  • 16. District Totals New Active Listed Sales $ Volume Avg Price Med Price Avg DOM Avg Month Grand Total 10,021 12,052 N/A 4,986 2,039,564,515 409,058 350,000 28 99 Year N/A N/A 9,962 4,986 2,039,564,515 409,058 350,000 28 99 Annual Summary - Single Family Year *Number of Sales *Average Price Year *Number of Sales *Average Price 1976 19,025 $61,389 2009 1977 20,512 $64,559 January 2,670 $343,632 1978 21,184 $67,333 February 4,120 $361,305 1979 23,466 $70,830 March 6,171 $362,050 1980 26,017 $75,694 April 8,107 $385,641 1981 29,625 $90,203 May 9,589 $395,609 1982 25,336 $95,496 June 10,955 $403,972 1983 30,046 $101,626 July 9,967 $395,414 1984 31,905 $102,318 August 8,035 $387,921 1985 45,509 $109,094 September 8,196 $406,877 1986 52,919 $138,925 October 8,476 $423,559 1987 43,475 $189,105 November 7,446 $418,460 1988 49,381 $229,635 December 5,541 $411,931 1989 38,960 $273,698 1990 26,779 $255,020 Total** 87,308 $395,460 1991 38,144 $234,313 1992 41,703 $214,971 2010 1993 38,990 $206,490 January 4,986 $409,058 1994 44,237 $208,921 1995 39,273 $203,028 Year-to-Date** 4,986 $409,058 1996 55,779 $198,150 1997 58,014 $211,307 1998 55,344 $216,815 1999 58,957 $228,372 2000 58,343 $243,255 2001 67,612 $251,508 2002 74,759 $275,231 2003 78,898 $293,067 2004 83,501 $315,231 2005 84,145 $335,907 2006 83,084 $351,941 2007 93,193 $376,236 2008 74,552 $379,347 * Due to District revisions, caution should be exercised when undertaking historical comparisons. Please refer to appropriate maps. **This figure may not equal the sum of all monthly totals, as the year-to-date total reflects sales reported in error and deals that have fallen through since January 1st. Single Family Dwelling Sales Comparison Sales Active Listing Average Price 15000 500000 35000 13500 30000 12000 425000 10500 25000 9000 20000 7500 350000 6000 15000 4500 10000 275000 3000 5000 1500 0 0 200000 Jan Feb Mar Apr May Jun Jul Aug Sep Oct Nov Dec Jan Jan Feb Mar Apr May Jun Jul Aug Sep Oct Nov Dec Jan 2000 2001 2002 2003 2004 2005 2006 2007 2008 2009 2010 2009 2010 2009 2010 16 TORONTO REAL ESTATE BOARD