DEV meet-up UiPath Document Understanding May 7 2024 Amsterdam
Statistics term project_written
1. Jeff Pratt
Math 1040
4-11-12
Term Project written report
The purpose of our study was to find out if there was any correlation between the age of a person
and the number of personal handheld electronic devices that the person owns.
Each member of our group was to interview a minimum of 5 people per day for 5 different days.
We would simply as the age of the person and how many personal electronic devices they
owned. (Phones, laptops, gaming devices, ect.). We also determined that going to a public place
such as a grocery store or library would help eliminate any sample bias. For example,
interviewing on SLCC campus might give you results of a younger crowd. Also, on a campus
you might find people with more devices that students use for their studies. All data would then
be jointed to see if there was a correlation.
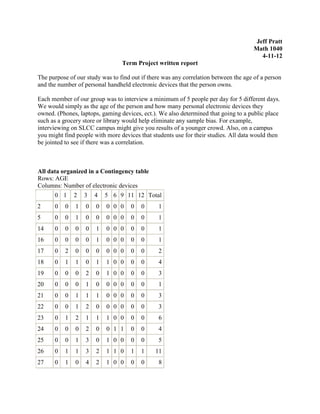
All data organized in a Contingency table
Rows: AGE
Columns: Number of electronic devices
0 1 2 3 4 5 6 9 11 12 Total
2 0 0 1 0 0 0 0 0 0 0 1
5 0 0 1 0 0 0 0 0 0 0 1
14 0 0 0 0 1 0 0 0 0 0 1
16 0 0 0 0 1 0 0 0 0 0 1
17 0 2 0 0 0 0 0 0 0 0 2
18 0 1 1 0 1 1 0 0 0 0 4
19 0 0 0 2 0 1 0 0 0 0 3
20 0 0 0 1 0 0 0 0 0 0 1
21 0 0 1 1 1 0 0 0 0 0 3
22 0 0 1 2 0 0 0 0 0 0 3
23 0 1 2 1 1 1 0 0 0 0 6
24 0 0 0 2 0 0 1 1 0 0 4
25 0 0 1 3 0 1 0 0 0 0 5
26 0 1 1 3 2 1 1 0 1 1 11
27 0 1 0 4 2 1 0 0 0 0 8
7. Difficulties and surprises: While collecting my data I came across a few difficulties. The main challenge
was I had to select people at random while still trying to get a diverse age range. At the grocery store
you are more likely to see middle aged people and not so many teenagers.
Another difficulty was I had to explain what kinds of different devices constitute a personal handheld
electronic device. I was also worried that I might be inconveniencing some people, being that most
people don’t have that kind of information right on the top of their head so it took some thought.
Analysis: According to what I found from the data, it doesn’t seem that there exists much of a
correlation between age and personal electronic devices. Our correlation coefficient of -0.2409 is further
evidence of that. The value -0.2409 only hints at a very small negative correlation, suggesting that as age
goes up, the number of personal handheld devices goes down. However, in order to be able to state
with confidence that there is in fact a correlation, the value of R must be closer to a +1 or -1.
DF = 124 – 2 = 122
With a level of significance of 0.05, the critical value for the sample size is roughly .195
When comparing the critical value with the value of R, since the value of R is “greater” (further from
zero) than the critical value, this means that there is a statistically significant correlation. Although I
would have thought it would have been a stronger correlation.
Conclusion: Upon collecting the data I initially did not see much of a correlation. However, when I
compared the value R to the critical value it showed that there is indeed a significant negative
correlation between age and the number of personal handheld electronic devices. I believe that with all
of our data we were able to answer our original research question.