
Recommended
More Related Content
Similar to 2011 Employer Health Benefits Chart Pack
Similar to 2011 Employer Health Benefits Chart Pack (18)
More from jpwlinkedin
More from jpwlinkedin (12)
2011 Employer Health Benefits Chart Pack
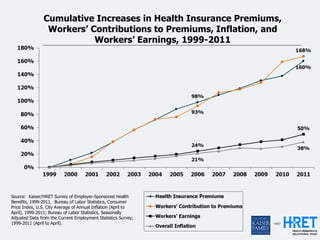
- 1. Cumulative Increases in Health Insurance Premiums, Workers’ Contributions to Premiums, Inflation, and Workers’ Earnings, 1999-2011 Source: Kaiser/HRET Survey of Employer-Sponsored Health Benefits, 1999-2011. Bureau of Labor Statistics, Consumer Price Index, U.S. City Average of Annual Inflation (April to April), 1999-2011; Bureau of Labor Statistics, Seasonally Adjusted Data from the Current Employment Statistics Survey, 1999-2011 (April to April).
- 2. Average Annual Premiums for Single and Family Coverage, 1999-2011 * Estimate is statistically different from estimate for the previous year shown (p<.05). Source: Kaiser/HRET Survey of Employer-Sponsored Health Benefits, 1999-2011.
- 3. Average Annual Worker Premium Contributions Paid by Covered Workers for Single and Family Coverage, 1999-2011 *Estimate is statistically different from estimate for the previous year shown (p<.05). Source: Kaiser/HRET Survey of Employer-Sponsored Health Benefits, 1999-2011.
- 4. Average Annual Worker Premium Contributions and Total Premiums for Covered Workers, Single and Family Coverage, by Firm Size, 2011 Single Coverage Family Coverage * Estimates are statistically different between All Small Firms and All Large Firms (p<.05). Source: Kaiser/HRET Survey of Employer- Sponsored Health Benefits, 2011.
- 5. Percentage of Covered Workers with No Premium Contribution or a Contribution of Greater than 50% of the Premium, 2011 Single Coverage Family Coverage *Estimate is statistically different between All Small Firms and All Large Firms within category (p<.05). Source: Kaiser/HRET Survey of Employer-Sponsored Health Benefits, 2011.
- 6. Distribution of Health Plan Enrollment for Covered Workers, by Plan Type, 1988-2011 1% 1% 1% 1% * Distribution is statistically different from the previous year shown (p<.05). No statistical tests were conducted for years prior to 1999. No statistical tests are conducted between 2005 and 2006 due to the addition of HDHP/SO as a new plan type in 2006. Note: Information was not obtained for POS plans in 1988. A portion of the change in plan type enrollment for 2005 is likely attributable to incorporating more recent Census Bureau estimates of the number of state and local government workers and removing federal workers from the weights. See the Survey Design and Methods section from the 2005 Kaiser/HRET Survey of Employer-Sponsored Health Benefits for additional information. Source: Kaiser/HRET Survey of Employer-Sponsored Health Benefits, 1999-2011; KPMG Survey of Employer-Sponsored Health Benefits, 1993, 1996; The Health Insurance Association of America (HIAA), 1988.
- 7. Among Firms Offering Health Benefits, Percentage That Offer an HDHP/SO, by Firm Size, 2005-2011 * Estimate is statistically different from estimate for previous year shown (p<.05). ‡ The 2011 estimate includes 1.8% of all firms offering health benefits that offer both an HDHP/HRA and an HSA-qualified HDHP. The comparable percentages for previous years are: 2005 [0.3%], 2006 [0.4%], 2007 [0.2%], 2008 [0.3%], 2009 [<0.1%], and 2010 [0.3%]. Source: Kaiser/HRET Survey of Employer-Sponsored Health Benefits, 2005-2011.
- 8. Percentage of Covered Workers Enrolled in a Plan with a General Annual Deductible of $1,000 or More for Single Coverage, By Firm Size, 2006-2011 * Estimate is statistically different from estimate for the previous year shown (p<.05). Note: These estimates include workers enrolled in HDHP/SO and other plan types. Because we do not collect information on the attributes of conventional plans, to be conservative, we assumed that workers in conventional plans do not have a deductible of $1,000 or more. Because of the low enrollment in conventional plans, the impact of this assumption is minimal. Average general annual health plan deductibles for PPOs, POS plans, and HDHP/SOs are for in-network services. Source: Kaiser/HRET Survey of Employer-Sponsored Health Benefits, 2006-2011.
- 9. Percentage of Covered Workers Enrolled in a Plan with a General Annual Deductible of $2,000 or More for Single Coverage, By Firm Size, 2006-2011 * Estimate is statistically different from estimate for the previous year shown (p<.05). Note: These estimates include workers enrolled in HDHP/SO and other plan types. Because we do not collect information on the attributes of conventional plans, to be conservative, we assumed that workers in conventional plans do not have a deductible of $2,000 or more. Because of the low enrollment in conventional plans, the impact of this assumption is minimal. Source: Kaiser/HRET Survey of Employer-Sponsored Health Benefits, 2006-2011.
- 10. Percentage of All Firms Offering Health Benefits, 1999-2011 *Estimate is statistically different from estimate for the previous year shown (p<.05). Note: Estimates presented in this exhibit are based on the sample of both firms that completed the entire survey and those that answered just one question about whether they offer health benefits. The percentage of firms offering health benefits is largely driven by small firms. The large increase in 2010 was primarily driven by a 12 percentage point increase in offering among firms with 3 to 9 workers. In 2011, 48% of firms with 3 to 9 employees offer health benefits, a level more consistent with levels from recent years other than 2010. The overall 2011 offer rate is consistent with the long term trend, indicating that the high 2010 offer rate may be an aberration. Source: Kaiser/HRET Survey of Employer-Sponsored Health Benefits, 1999-2011.
- 11. Among All Large Firms (200 or More Workers) Offering Health Benefits to Active Workers, Percentage of Firms Offering Retiree Health Benefits, 1988-2011 Note: Tests found no statistical difference from estimate for the previous year shown (p<.05). No statistical tests are conducted for years prior to 1999. Data have been edited to include the less than 1% of large firms who report “yes, but no retiree” responses in 2011. Historical numbers have been recalculated so that the results are comparable. Source: Kaiser/HRET Survey of Employer-Sponsored Health Benefits, 1999-2011; KPMG Survey of Employer-Sponsored Health Benefits, 1991, 1993, 1995, 1998; The Health Insurance Association of America (HIAA), 1988.
- 12. Percentage of Covered Workers in Partially or Completely Self-Funded Plans, 1999-2011 *Tests found no statistical difference from estimate for the previous year shown (p<.05). No statistical tests are conducted for years prior to 1999. Source: Kaiser/HRET Survey of Employer-Sponsored Health Benefits, 1999-2011
- 13. of Co ve Percentage of Covered Workers Enrolled in Partially or re Completely Self-Insured Plans which Purchase Different Types d W of Stoploss Insurance, by Firm Size, 2011 or Pe ke rc rs en En ta rol Av ge le Pe er of d rc ag Co in en e ve a ta Pe re Se ge r d lf- of E W Fu Co m or nd ve pl ke ed re oy rs Pl All d ee En an Large W Cl rol th Firms or ai le at 1,00 ke 5,00 (200 m d Pu or or rs 5 0 0-4,9 200- 50-1 8 s in rc ALL in 7 More 23 85 8 Co More 6 999 2 5 99 a ha FIRM % % 89 st Work Pa % 0 Work % 8 1 0 Se se SIZE % % % at ers) rti * % Sers * lf- s 96 40 80 20 79 88 84 13 50 90 75 $7 all 30 $ w Fu St * * y 1, 5, 6, 3, 1 2 hi * Estimate is statistically different from estimate for all other firms not in the indicated category nd op or 81 21 71 82 9 0 ch (p<.05). ed lo Co 5* 0* 9* 4* 9, 8, St Pl ss Source: Kaiser/HRET Survey of Employer-Sponsored Health Benefits, 2011. m 6 2 op an In pl 0 8 lo th su
- 14. Percentage of Firms Offering Family Coverage Who Enrolled Adult Children up to 26 Years of Age as Dependents Because of the Affordable Care Act (ACA), by Firm Size, 2011 * Estimate is statistically different from estimate for all other firms not in the indicated size (p<.05). Note: In total, an estimated 2.3 million adult children were enrolled in their parent’s employer sponsored health plan due to the Affordable Care Act. Source: Kaiser/HRET Survey of Employer-Sponsored Health Benefits, 2011.
- 15. Percentage of Firms and Covered Workers Enrolled in Plans Grandfathered under the Affordable Care Act (ACA), by Firm Size, 2011 *Estimate is statistically different between All Small Firms and All Large Firms within category (p<.05). Source: Kaiser/HRET Survey of Employer-Sponsored Health Benefits, 2011.
- 16. Among Covered Workers, Changes to Cost Sharing for Preventive Services Because of the Affordable Care Act (ACA), by Firm Size, 2011 *Estimate is statistically different between All Small Firms and All Large Firms within category (p<.05). Source: Kaiser/HRET Survey of Employer-Sponsored Health Benefits, 2011.
- 17. Among Offering Firms with Fewer Than 50 Employees, Awareness and Utilization of the Small Employer Tax Credits Made Available in the Affordable Care Act (ACA), 2011 Note: The ACA provides a temporary tax credit for small employers with fewer than 25 full-time equivalents that offer health insurance and have average annual wages of less than $50,000. More information about the tax credit is available at: http://www.irs.gov/newsroom/article/0,,id=223666,00.html. Because our survey asks about the total number of employees in a firm and not full-time equivalents, we could not limit responses to firms only within the size range eligible for the credit. To ensure that we included employers that may have a number of part-time or temporary employees but could still qualify for the tax credit, we directed questions to employers with fewer than 50 total employees. This approach allowed us to capture some employers with more than 25 total employees that would nonetheless be eligible for the tax credit, but it also means that some employers that are unlikely to be eligible for the tax credit were asked these questions. § Note: 87% of the firms who stated that they would not claim the credit in either year believed that they were not eligible, 10% believed that the credit was too small, and 3% said that claiming the credit was too much of a hassle. Source: Kaiser/HRET Survey of Employer-Sponsored Health Benefits, 2011.