SlideShare una empresa de Scribd logo
1 de 12
This report is based on members paid through 2/28/2010 or later.
 3/4/2010
 Membership Statistics: Grand totals for basic membership, by member type
                                                                                       # Memberships          # Members
 IND                      BASIC                                                                 6,921              6,921
 IND2                     BASIC                                                                   763                763
 JNT                      BASIC                                                                   113                226
 JNT2                     BASIC                                                                    16                 32
 STU                      BASIC                                                                 1,307              1,307
 STU2                     BASIC                                                                   137                137
 LIF                      BASIC                                                                    38                 38
 RET                      BASIC                                                                   149                149
 RET2                     BASIC                                                                    22                 22
 PTR                      BASIC                                                                   620                620
 PTR2                     BASIC                                                                    70                 70
 GME                      BASIC                                                                 1,314              1,314
 GME2                     BASIC                                                                   136                136
 NT                       BASIC                                                                   251                251
 NT2                      BASIC                                                                   112                112
 COMP                     BASIC                                                                    25                 25
 Grand Total:                                                                                    11,994           12,123


                                                   Member Types
                                                                                                                           IND
    7000                                                                                                                   IND2
                                                                                                                           JNT
    6000                                                                                                                   JNT2
                                                                                                                           STU
    5000                                                                                                                   STU2
                                                                                                                           LIF
    4000                                                                                                                   RET
             6921                                                                                                          RET2
    3000                                                                                                                   PTR
                                                                                                                           PTR2
    2000
                                                                                                                           GME
    1000                                                                                                                   GME2
                                       1307 137          149                       1314 136 251                            NT
                    763 113       16                38             22   620   70                112          25
         0                                                                                                                 NT2
             IND IND2 JNT JNT2 STU STU2 LIF RET RET2 PTR PTR2 GMEGME2 NT NT2COMP                                           COMP


 Note: in all general statistic reports, joint household memberships are treated as "one" member EXCEPT in the second
 column of this report, where joints are counted as two people, providing the most accurate count of the number of TESOL
 members.

This report is based on members paid through 2/28/2010 or later.
3/4/2010                                        Membership counts by country for members paid through 2/28/2010 or later.

           Country/State/Province                                                        Total
            AFGHANISTAN                                                                           1    0.0%
            ALBANIA                                                                               5    0.0%
            ALGERIA                                                                              19    0.2%
            ANGOLA                                                                                2    0.0%
            ARGENTINA                                                                            27    0.2%
            ARMENIA                                                                               4    0.0%
            AUSTRALIA                                                                            60    0.5%
            AUSTRIA                                                                               4    0.0%
            AZERBAIJAN                                                                            2    0.0%
            BAHRAIN                                                                              11    0.1%
            BANGLADESH                                                                            9    0.1%
            BELARUS                                                                               2    0.0%
            BELGIUM                                                                               1    0.0%
            BOLIVIA                                                                              57    0.5%
            BOSNIA AND HERZEGOVINA                                                                1    0.0%
            BRAZIL                                                                               97    0.8%
            BRUNEI DARUSSALAM                                                                     1    0.0%
            BULGARIA                                                                              1    0.0%
            BURKINA FASO                                                                          4    0.0%
            CAMBODIA                                                                              5    0.0%
            CAMEROON                                                                             44    0.4%
            Canada                                                                                1    0.0%
            CANADA
              CANADA                                                                         2
              CANADA             Alberta                                                    46
              CANADA             British Columbia                                          105
              CANADA             Manitoba                                                   18
              CANADA             New Brunswick                                              20
              CANADA             Newfoundland                                                4
              CANADA             North Dakota                                                1
              CANADA             Nova Scotia                                                10
              CANADA             Nunavut                                                     1
              CANADA             Ontario                                                   101
              CANADA             Prince Edward Island                                        4
              CANADA             Quebec                                                     34
              CANADA             Saskatchewan                                                6
              CANADA             Yukon Territory                                             1
            CANADA                                                                               353   2.9%
            CHILE                                                                                 19   0.2%
            CHINA                                                                                 89   0.7%
            COLOMBIA                                                                              32   0.3%
            COSTA RICA                                                                            32   0.3%
            CROATIA                                                                                2   0.0%
            CYPRUS                                                                                 4   0.0%
            CZECH REPUBLIC                                                                         8   0.1%
            DENMARK                                                                                2   0.0%
            DOMINICAN REPUBLIC                                                                    14   0.1%
            EAST TIMOR                                                                             1   0.0%
            ECUADOR                                                                               33   0.3%
            EGYPT                                                                                 29   0.2%
            EL SALVADOR                                                                            2   0.0%
            ESTONIA                                                                                2   0.0%
            FINLAND                                                                                7   0.1%
            FRANCE                                                                                17   0.1%
            GEORGIA                                                                               12   0.1%
            GERMANY                                                                               21   0.2%
            GREECE                                                                                20   0.2%
GUAM                      3   0.0%
GUATEMALA                21   0.2%
HAITI                    15   0.1%
HONDURAS                  5   0.0%
HONG KONG                11   0.1%
HONG KONG SAR CHINA      24   0.2%
HUNGARY                   5   0.0%
ICELAND                   3   0.0%
INDIA                    26   0.2%
INDONESIA                45   0.4%
IRAN                      5   0.0%
IRAQ                     16   0.1%
IRELAND                   3   0.0%
ISRAEL                   27   0.2%
ITALY                    31   0.3%
JAPAN                   445   3.7%
JORDAN                    7   0.1%
KAZAKHSTAN                6   0.1%
KOREA, REPUBLIC OF       26   0.2%
KOSOVO (UNMIK)            1   0.0%
KUWAIT                   18   0.2%
KYRGYZSTAN                2   0.0%
LAOS                     10   0.1%
LATVIA                    1   0.0%
LEBANON                   7   0.1%
LIBYA                     6   0.1%
LITHUANIA                 4   0.0%
MACAO                    11   0.1%
MACEDONIA                 4   0.0%
MADAGASCAR                9   0.1%
MALAYSIA                 16   0.1%
MALDIVES                  1   0.0%
MALTA                     1   0.0%
MARSHALL ISLANDS          5   0.0%
MAURITANIA                1   0.0%
MEXICO                  179   1.5%
MOLDOVA, REPUBLIC OF      3   0.0%
MONGOLIA                  7   0.1%
MOROCCO                  29   0.2%
MOZAMBIQUE                1   0.0%
MYANMAR                   3   0.0%
NEPAL                     5   0.0%
NETHERLANDS               4   0.0%
NETHERLANDS ANTILLES      1   0.0%
NEW ZEALAND              14   0.1%
NICARAGUA                 7   0.1%
NIGER                     1   0.0%
NIGERIA                   1   0.0%
OMAN                     11   0.1%
PAKISTAN                 13   0.1%
PALESTINIAN TERRITORY     1   0.0%
PANAMA                   32   0.3%
PAPUA NEW GUINEA          1   0.0%
PARAGUAY                  7   0.1%
PEOPLES REP OF CHINA     54   0.5%
PERU                     87   0.7%
PHILIPPINES              50   0.4%
POLAND                   11   0.1%
PORTUGAL                  1   0.0%
QATAR                    29   0.2%
ROMANIA                   3   0.0%
RUSSIA                                             43   0.4%
RUSSIAN FEDERATION                                  7   0.1%
RWANDA                                              1   0.0%
SAUDI ARABIA                                       37   0.3%
SENEGAL                                             9   0.1%
SERBIA                                              5   0.0%
SIERRA LEONE                                        1   0.0%
SINGAPORE                                          18   0.2%
SLOVAKIA                                            4   0.0%
SOUTH AFRICA                                        7   0.1%
SOUTH KOREA                                        58   0.5%
SPAIN                                              14   0.1%
SRI LANKA                                           2   0.0%
SUDAN                                               6   0.1%
SWAZILAND                                           1   0.0%
SWEDEN                                              8   0.1%
SWITZERLAND                                         8   0.1%
SYRIAN ARAB REPUBLIC                                3   0.0%
TAIWAN                                             25   0.2%
TAIWAN ROC                                         46   0.4%
TAIWAN, PROVINCE OF CHINA                           2   0.0%
TAJIKISTAN                                          2   0.0%
THAILAND                                           39   0.3%
TRINIDAD AND TOBAGO                                 1   0.0%
TUNISIA                                            13   0.1%
TURKEY                                             53   0.4%
UGANDA                                              1   0.0%
UKRAINE                                            26   0.2%
UNITED ARAB EMIRATES                               56   0.5%
UNITED KINGDOM                                     54   0.5%
UNITED STATES OF AMERICA                            7   0.1%
URUGUAY                                            20   0.2%
US MINOR OUTLYING ISLANDS                           1   0.0%
USA
  USA                                         15
  USA                 Alabama                 49
  USA                 Alaska                  22
  USA                 American Embassy        21
  USA                 Arizona                185
  USA                 Arkansas                81
  USA                 Armed Forces             8
  USA                 Armed Frces Americas     1
  USA                 British Columbia         1
  USA                 California             863
  USA                 Colorado               394
  USA                 Connecticut            173
  USA                 Delaware                28
  USA                 District of Columbia   127
  USA                 Florida                321
  USA                 Georgia                202
  USA                 Guam                     2
  USA                 Hawaii                  68
  USA                 Idaho                   32
  USA                 Illinois               320
  USA                 Indiana                152
  USA                 Iowa                   100
  USA                 Kansas                 105
  USA                 Kentucky                71
  USA                 Lousiana                44
  USA                 Maine                   57
USA                     Manitoba                           2
            USA                     Maryland                         290
            USA                     Massachusetts                    706
            USA                     Michigan                         209
            USA                     Minnesota                        185
            USA                     Mississippi                       50
            USA                     Missouri                         165
            USA                     Montana                           24
            USA                     N Mariana Islands                  1
            USA                     Nebraska                          48
            USA                     Nevada                            50
            USA                     New Hampshire                    102
            USA                     New Jersey                       263
            USA                     New Mexico                        53
            USA                     New York                         655
            USA                     North Carolina                   111
            USA                     North Dakota                      24
            USA                     Ohio                             204
            USA                     Oklahoma                          77
            USA                     Ontario                            1
            USA                     Oregon                           165
            USA                     Pennsylvania                     356
            USA                     Puerto Rico                       41
            USA                     Rhode Island                      99
            USA                     South Carolina                    48
            USA                     South Dakota                      11
            USA                     Tennessee                         91
            USA                     Texas                            421
            USA                     Utah                             116
            USA                     Vermont                           92
            USA                     Virginia                         344
            USA                     Washington                       270
            USA                     West Virgina                      29
            USA                     Wisconsin                        180
            USA                     Wyoming                           17
           USA                                                        8,942   74.5%
           UZBEKISTAN                                                     2    0.0%
           VENEZUELA                                                     12    0.1%
           VIET NAM                                                       6    0.1%
           VIETNAM                                                       14    0.1%
           VIRGIN ISLANDS, U.S.                                           6    0.1%
           YEMEN                                                          4    0.0%
                          Grand Total:                               11,997


                               143 distinct countries represented.


02-geographic.rpt 2/28/2010
3/4/2010                                                        Membership counts by country for members paid through 02/28/2010 or later.

 USA
                                                      Top 5 States per Country

           6000

           5000

           4000                                                                                                        California
                                                                                                                       Massachusetts
                                                                                                                       New York
           3000                                                                                      5973
                                                                                                                       Texas
                                                                                                                       Colorado
           2000                                                                                                        Others

           1000
                           866               715          662
                                                                          419           399
              0
                        California    Massachusetts    New York          Texas       Colorado      Others


 CANADA
                                                      Top 5 States per Country

            120

            100

             80                                                                                                       British Columbia
                                                                                                                      Ontario
                                                                                                                      Alberta
             60                                                                                                       Quebec
                           105
                                             101
                                                                                                                      New Brunswick
             40                                                                                                       Others
                                                          46                                          46
             20                                                           34
                                                                                        19

              0
                   British Columbia      Ontario       Alberta          Quebec     New Brunswick   Others


                                                      Top 10 Countries
                                      1632

                        57
                        58
                       61                                                                           USA          74.7%
                       86
                      89                                                                            JAPAN         3.7%
                     97
                   180                                                                              CANADA        2.9%
                  351                                                                               MEXICO        1.5%
                                                                                                    BRAZIL        0.8%
                  445                                                                               CHINA         0.7%
                                                                                                    PERU          0.7%
                                                                                                    AUSTRALIA     0.5%
                                                                                                    SOUTH KOREA   0.5%
                                                                                                    BOLIVIA       0.5%
                                                                                                    Others       13.5%
                                                                                                    Total:      100.0%

                                                                         9034
3/4/2010             Basic statistics on Primary vs. other memberships in interest sections. For
                     members paid through 2/28/2010 or later.
                                                                                                       Primary versus other
No Primary Interest Section                                               1.2%              443         441            2
Adult Education                                                           7.4%            2,784       1,300       1,484
Applied Linguistics                                                       6.1%            2,294         765       1,529
Bilingual Education                                                       4.1%            1,526         333       1,193
Computer-Assisted Language Learning                                       5.3%            1,992         489       1,503
Elementary Education                                                      4.9%            1,851         908         943
English as a Foreign Language                                             8.5%            3,189       1,490       1,699
English for Specific Purposes                                             4.4%            1,639         290       1,349
Higher Education                                                          6.1%            2,310         914       1,396
Intercultural Communication                                               4.7%            1,783         294       1,489
Intensive English Programs                                                5.4%            2,044         694       1,350
International Teaching Assistants                                         2.7%              997         121         876
Materials Writers                                                         3.4%            1,295         232       1,063
Nonnative English Speakers in TESOL                                       3.0%            1,130         210         920
Program Administration                                                    3.3%            1,243         273         970
Refugee Concerns                                                          2.3%              878         119         759
Second Language Writing                                                   5.7%            2,145         408       1,737
Speech, Pronunciation, and Listening                                      5.0%            1,896         295       1,601
Social Responsibility                                                     1.6%              599           34        565
Secondary Schools                                                         4.1%            1,555         632         923
Teacher Education                                                         7.2%            2,713         836       1,877
Video & Digital Media                                                     3.5%            1,313         126       1,187
                  11,212 distinct members                Total # of IS memberships        37,619      11,204     26,415

 The total count is the number of IS memberships total and may either be LESS or MORE than the actual number of individual
 members of TESOL. Due to open access to Interest Sections, these numbers may fluctuate considerably each month. For instance,
 one member may have selected four interest sections, while some members may belong to none.


                                                            Interest Sections
                                                                       (Primary)                                              1NO_PRIM_IS
                                                                                                                              AE
                  1600
                                                                                                                              AL
                                                                                                                              BE
                  1400                                                                                                        CALL
                                                                                                                              EE
                  1200                                                                                                        EFL
                                                                                                                              ESP
   # of members


                  1000                                                                                                        HE
                                                                                                                              IC
                                                                                                                              IEP
                   800                                                                                                        ITA
                                                                                                                              MW
                   600                                                                                                        NNEST
                                                                                                                              PA
                   400                                                                                                        RC
                                                                                                                              SLW
                   200                                                                                                        SPL
                                                                                                                              SR
                                                                                                                              SS
                    0                                                                                                         TE
                   1NO_PRIM_IS AL
                           AE           BE CALL EE EFL ESP HE   IC   IEP ITA MWNNESTPA   RC SLW SPL SR   SS   TE VDM          VDM
Basic Statistics on Area of Work (Members paid through >= 2/28/2010)

     Elementary Education                  EE                             1,138          9.6%
     Secondary Education                   SE                             1,184         10.0%
     Community/2yr College                 CC                               756          6.4%
     Postsecondary Education               HE                             2,972         25.0%
     Adult Education                       AE                             2,075         17.5%
     Mainstream                            MN                                50          0.4%
     Other                                 OT                             1,253         10.5%
                                                                          2,450         20.6%

                                                                         11,878
Only members who selected an area of work are included on this report. Other members may not have responded to this
question and are excluded from the count.


                                                      Areas of Work

                                                                              EE
                                                                              SE
                                                                              CC


                                                                                                                      EE       9.6%
                                                                                                                      SE      10.0%
                                                                                                                      CC       6.4%
                                                                                                                      HE      25.0%
                                                                                                                      AE      17.5%
                                                                                                                      MN       0.4%
                                                                                                                      OT      10.5%
                                                                                                                              20.6%
                                                                                                                      Total: 100.0%

                              OT
                              MN
                              AE                                              HE


                                                                                                            (Blanks indicate no
                                                                                                                response)
Statistics on Areas of Interest (Members paid through >= 2/28/2010)

CODE            DESCRIPTION                                      TOTAL*   % of TOTAL*
EFL             English as a foreign language                     2,942         5%
TE              Teacher education                                2,676         4%
CURRICULUM      Materials development/Curriculum                 2,647         4%
SLA             Second language acquisition                      2,596         4%
AL              Applied linguistics                              2,464         4%
IC              Multiculturalism/intercultural communications    2,463         4%
AE              Adult education                                  2,340         4%
CALL            Technology in education                          2,235         4%
WRITING         Writing/composition                              2,209         4%
CONTENT         Content-based instruction                        2,147         4%
HE              Higher education                                 2,066         3%
PROFDEV         Professional development                         1,982         3%
IEP             Intensive English programs                       1,972         3%
READING         Reading/literacy                                 1,921         3%
SP              Speaking/pronunciation                           1,864         3%
ASSESS          Assessment/testing                               1,756         3%
GRAMMAR         Grammar                                          1,729         3%
ESP             English for specific purposes                    1,674         3%
BE              Bilingual education                              1,532         2%
RS              Research                                         1,502         2%
EE              Elementary/primary education                     1,262         2%
PA              Program administration                           1,220         2%
DISTANCE        Distance learning/Online Education               1,156         2%
VOCAB           Vocabulary/Lexicon                               1,097         2%
SS              Secondary education                              1,096         2%
SOCIAL          Social/global/political concerns                 1,045         2%
WORKPLACE       Workplace English instruction/Business English     951         2%
VI              Video and digital media                            948         2%
LISTEN          Listening                                          930         2%
ISKILL          Integrated Skills                                  929         2%
COMMCOLL        Community college/technical ed                     818         1%
LIT             Literature                                         717         1%
RC              Refugee concerns                                   710         1%
LINGUISTICS     Theoretical Linguistics                            705         1%
STANDARDS       Standards                                          689         1%
ITA             International teaching assistants                  681         1%
FAMILY          Community/family outreach                          600         1%
EMPLOYMENT      Employment issues/Certification                    476         1%
LDSN            Learning Disorders/Special Needs                   475         1%
PUBLICPOLICY    Public policy                                      451         1%
NNES            NNES/NES issues                                    434         1%
MAINSTREAMING   Mainstreaming                                      433         1%
ARTS            Arts/Media/Science/Math/Social Science             359         1%
ACCRED          Accreditation                                      295         0%
STYLISTICS      Stylistics                                         118         0%
Sorted in order of prevalence.
* Note: Members are encouraged to choose multiple areas of interest and some members do not choose any areas of
interest. The total number of distinct members (8,491) represented in this report is less than the total number of active
members as indicated elsewhere in this report.

Areas of interest are separate from official TESOL interest sections. Areas of interest represent distinct areas in which
a member may be interested, rather than official entities in which a member is involved.

Areas of interest which have a very low count may be recent additions to the AOI list, or may reflect overall trends in
membership.
Statistics on Areas of Expertise (Members paid through >= 2/28/2010)

CODE            DESCRIPTION                                      TOTAL*   % of TOTAL*
EFL             English as a foreign language                     1,788         7%
AE              Adult education                                  1,436         6%
CURRICULUM      Materials development/Curriculum                 1,235         5%
WRITING         Writing/composition                              1,114         4%
AL              Applied linguistics                              1,084         4%
TE              Teacher education                                1,046         4%
SLA             Second language acquisition                      1,038         4%
IEP             Intensive English programs                       1,012         4%
HE              Higher education                                   955         4%
CONTENT         Content-based instruction                          926         4%
GRAMMAR         Grammar                                            863         3%
IC              Multiculturalism/intercultural communications      810         3%
EE              Elementary/primary education                       790         3%
READING         Reading/literacy                                   697         3%
CALL            Technology in education                            677         3%
ESP             English for specific purposes                      676         3%
SP              Speaking/pronunciation                             653         3%
PROFDEV         Professional development                           651         3%
ASSESS          Assessment/testing                                 610         2%
PA              Program administration                             590         2%
SS              Secondary education                                521         2%
BE              Bilingual education                                507         2%
ISKILL          Integrated Skills                                  479         2%
COMMCOLL        Community college/technical ed                     441         2%
WORKPLACE       Workplace English instruction/Business English     407         2%
DISTANCE        Distance learning/Online Education                 390         2%
RS              Research                                           365         1%
LISTEN          Listening                                          347         1%
LIT             Literature                                         320         1%
VOCAB           Vocabulary/Lexicon                                 310         1%
SOCIAL          Social/global/political concerns                   256         1%
VI              Video and digital media                            211         1%
ITA             International teaching assistants                  194         1%
ARTS            Arts/Media/Science/Math/Social Science             188         1%
NNES            NNES/NES issues                                    177         1%
FAMILY          Community/family outreach                          173         1%
STANDARDS       Standards                                          165         1%
ACCRED          Accreditation                                      156         1%
LINGUISTICS     Theoretical Linguistics                            154         1%
RC              Refugee concerns                                   146         1%
MAINSTREAMING   Mainstreaming                                      139         1%
LDSN            Learning Disorders/Special Needs                   137         1%
EMPLOYMENT      Employment issues/Certification                    107         0%
PUBLICPOLICY    Public policy                                       77         0%
STYLISTICS      Stylistics                                          29         0%
Sorted in order of prevalence.
* Note: Members are encouraged to choose multiple areas of expertise and some members do not choose any areas
of expertise. The total number of distinct members (6,319) represented in this report is less than the total number of
active members as indicated elsewhere in this report.

Areas of Expertise are separate from official TESOL interest sections or Areas of Interest. Areas of expertise
represent distinct areas in which a member may be experienced in, rather than official entities in which a member is
involved.

Areas of interest which have a very low count may be recent additions to the AOI list, or may reflect overall trends in
membership.

Más contenido relacionado

Destacado (12)

Ppt tesis eliana
Ppt tesis elianaPpt tesis eliana
Ppt tesis eliana
 
Alimentos
AlimentosAlimentos
Alimentos
 
Tobón formación basada c 05
Tobón formación basada c 05Tobón formación basada c 05
Tobón formación basada c 05
 
Hububat Sunusu
Hububat SunusuHububat Sunusu
Hububat Sunusu
 
1 gestiondelaula
1 gestiondelaula1 gestiondelaula
1 gestiondelaula
 
How to conduct research
How to conduct researchHow to conduct research
How to conduct research
 
Amanda Wiehl Presentation at EFL_IS Academic Session
Amanda Wiehl Presentation at EFL_IS Academic SessionAmanda Wiehl Presentation at EFL_IS Academic Session
Amanda Wiehl Presentation at EFL_IS Academic Session
 
Objetivos didacticos
Objetivos didacticosObjetivos didacticos
Objetivos didacticos
 
Tesol2011 callforproposals
Tesol2011 callforproposalsTesol2011 callforproposals
Tesol2011 callforproposals
 
Future of Agri Business in Pakistan
Future of Agri Business in PakistanFuture of Agri Business in Pakistan
Future of Agri Business in Pakistan
 
Introduction to Operating System (Important Notes)
Introduction to Operating System (Important Notes)Introduction to Operating System (Important Notes)
Introduction to Operating System (Important Notes)
 
Telenor’s Training System
Telenor’s Training SystemTelenor’s Training System
Telenor’s Training System
 

Último

Visit to a blind student's school🧑‍🦯🧑‍🦯(community medicine)
Visit to a blind student's school🧑‍🦯🧑‍🦯(community medicine)Visit to a blind student's school🧑‍🦯🧑‍🦯(community medicine)
Visit to a blind student's school🧑‍🦯🧑‍🦯(community medicine)lakshayb543
 
What is Model Inheritance in Odoo 17 ERP
What is Model Inheritance in Odoo 17 ERPWhat is Model Inheritance in Odoo 17 ERP
What is Model Inheritance in Odoo 17 ERPCeline George
 
Grade 9 Quarter 4 Dll Grade 9 Quarter 4 DLL.pdf
Grade 9 Quarter 4 Dll Grade 9 Quarter 4 DLL.pdfGrade 9 Quarter 4 Dll Grade 9 Quarter 4 DLL.pdf
Grade 9 Quarter 4 Dll Grade 9 Quarter 4 DLL.pdfJemuel Francisco
 
How to Add Barcode on PDF Report in Odoo 17
How to Add Barcode on PDF Report in Odoo 17How to Add Barcode on PDF Report in Odoo 17
How to Add Barcode on PDF Report in Odoo 17Celine George
 
Difference Between Search & Browse Methods in Odoo 17
Difference Between Search & Browse Methods in Odoo 17Difference Between Search & Browse Methods in Odoo 17
Difference Between Search & Browse Methods in Odoo 17Celine George
 
ROLES IN A STAGE PRODUCTION in arts.pptx
ROLES IN A STAGE PRODUCTION in arts.pptxROLES IN A STAGE PRODUCTION in arts.pptx
ROLES IN A STAGE PRODUCTION in arts.pptxVanesaIglesias10
 
ECONOMIC CONTEXT - PAPER 1 Q3: NEWSPAPERS.pptx
ECONOMIC CONTEXT - PAPER 1 Q3: NEWSPAPERS.pptxECONOMIC CONTEXT - PAPER 1 Q3: NEWSPAPERS.pptx
ECONOMIC CONTEXT - PAPER 1 Q3: NEWSPAPERS.pptxiammrhaywood
 
4.16.24 21st Century Movements for Black Lives.pptx
4.16.24 21st Century Movements for Black Lives.pptx4.16.24 21st Century Movements for Black Lives.pptx
4.16.24 21st Century Movements for Black Lives.pptxmary850239
 
Karra SKD Conference Presentation Revised.pptx
Karra SKD Conference Presentation Revised.pptxKarra SKD Conference Presentation Revised.pptx
Karra SKD Conference Presentation Revised.pptxAshokKarra1
 
Choosing the Right CBSE School A Comprehensive Guide for Parents
Choosing the Right CBSE School A Comprehensive Guide for ParentsChoosing the Right CBSE School A Comprehensive Guide for Parents
Choosing the Right CBSE School A Comprehensive Guide for Parentsnavabharathschool99
 
Active Learning Strategies (in short ALS).pdf
Active Learning Strategies (in short ALS).pdfActive Learning Strategies (in short ALS).pdf
Active Learning Strategies (in short ALS).pdfPatidar M
 
Earth Day Presentation wow hello nice great
Earth Day Presentation wow hello nice greatEarth Day Presentation wow hello nice great
Earth Day Presentation wow hello nice greatYousafMalik24
 
GRADE 4 - SUMMATIVE TEST QUARTER 4 ALL SUBJECTS
GRADE 4 - SUMMATIVE TEST QUARTER 4 ALL SUBJECTSGRADE 4 - SUMMATIVE TEST QUARTER 4 ALL SUBJECTS
GRADE 4 - SUMMATIVE TEST QUARTER 4 ALL SUBJECTSJoshuaGantuangco2
 
Barangay Council for the Protection of Children (BCPC) Orientation.pptx
Barangay Council for the Protection of Children (BCPC) Orientation.pptxBarangay Council for the Protection of Children (BCPC) Orientation.pptx
Barangay Council for the Protection of Children (BCPC) Orientation.pptxCarlos105
 
Activity 2-unit 2-update 2024. English translation
Activity 2-unit 2-update 2024. English translationActivity 2-unit 2-update 2024. English translation
Activity 2-unit 2-update 2024. English translationRosabel UA
 
Inclusivity Essentials_ Creating Accessible Websites for Nonprofits .pdf
Inclusivity Essentials_ Creating Accessible Websites for Nonprofits .pdfInclusivity Essentials_ Creating Accessible Websites for Nonprofits .pdf
Inclusivity Essentials_ Creating Accessible Websites for Nonprofits .pdfTechSoup
 
ICS2208 Lecture6 Notes for SL spaces.pdf
ICS2208 Lecture6 Notes for SL spaces.pdfICS2208 Lecture6 Notes for SL spaces.pdf
ICS2208 Lecture6 Notes for SL spaces.pdfVanessa Camilleri
 
Global Lehigh Strategic Initiatives (without descriptions)
Global Lehigh Strategic Initiatives (without descriptions)Global Lehigh Strategic Initiatives (without descriptions)
Global Lehigh Strategic Initiatives (without descriptions)cama23
 
INTRODUCTION TO CATHOLIC CHRISTOLOGY.pptx
INTRODUCTION TO CATHOLIC CHRISTOLOGY.pptxINTRODUCTION TO CATHOLIC CHRISTOLOGY.pptx
INTRODUCTION TO CATHOLIC CHRISTOLOGY.pptxHumphrey A Beña
 
THEORIES OF ORGANIZATION-PUBLIC ADMINISTRATION
THEORIES OF ORGANIZATION-PUBLIC ADMINISTRATIONTHEORIES OF ORGANIZATION-PUBLIC ADMINISTRATION
THEORIES OF ORGANIZATION-PUBLIC ADMINISTRATIONHumphrey A Beña
 

Último (20)

Visit to a blind student's school🧑‍🦯🧑‍🦯(community medicine)
Visit to a blind student's school🧑‍🦯🧑‍🦯(community medicine)Visit to a blind student's school🧑‍🦯🧑‍🦯(community medicine)
Visit to a blind student's school🧑‍🦯🧑‍🦯(community medicine)
 
What is Model Inheritance in Odoo 17 ERP
What is Model Inheritance in Odoo 17 ERPWhat is Model Inheritance in Odoo 17 ERP
What is Model Inheritance in Odoo 17 ERP
 
Grade 9 Quarter 4 Dll Grade 9 Quarter 4 DLL.pdf
Grade 9 Quarter 4 Dll Grade 9 Quarter 4 DLL.pdfGrade 9 Quarter 4 Dll Grade 9 Quarter 4 DLL.pdf
Grade 9 Quarter 4 Dll Grade 9 Quarter 4 DLL.pdf
 
How to Add Barcode on PDF Report in Odoo 17
How to Add Barcode on PDF Report in Odoo 17How to Add Barcode on PDF Report in Odoo 17
How to Add Barcode on PDF Report in Odoo 17
 
Difference Between Search & Browse Methods in Odoo 17
Difference Between Search & Browse Methods in Odoo 17Difference Between Search & Browse Methods in Odoo 17
Difference Between Search & Browse Methods in Odoo 17
 
ROLES IN A STAGE PRODUCTION in arts.pptx
ROLES IN A STAGE PRODUCTION in arts.pptxROLES IN A STAGE PRODUCTION in arts.pptx
ROLES IN A STAGE PRODUCTION in arts.pptx
 
ECONOMIC CONTEXT - PAPER 1 Q3: NEWSPAPERS.pptx
ECONOMIC CONTEXT - PAPER 1 Q3: NEWSPAPERS.pptxECONOMIC CONTEXT - PAPER 1 Q3: NEWSPAPERS.pptx
ECONOMIC CONTEXT - PAPER 1 Q3: NEWSPAPERS.pptx
 
4.16.24 21st Century Movements for Black Lives.pptx
4.16.24 21st Century Movements for Black Lives.pptx4.16.24 21st Century Movements for Black Lives.pptx
4.16.24 21st Century Movements for Black Lives.pptx
 
Karra SKD Conference Presentation Revised.pptx
Karra SKD Conference Presentation Revised.pptxKarra SKD Conference Presentation Revised.pptx
Karra SKD Conference Presentation Revised.pptx
 
Choosing the Right CBSE School A Comprehensive Guide for Parents
Choosing the Right CBSE School A Comprehensive Guide for ParentsChoosing the Right CBSE School A Comprehensive Guide for Parents
Choosing the Right CBSE School A Comprehensive Guide for Parents
 
Active Learning Strategies (in short ALS).pdf
Active Learning Strategies (in short ALS).pdfActive Learning Strategies (in short ALS).pdf
Active Learning Strategies (in short ALS).pdf
 
Earth Day Presentation wow hello nice great
Earth Day Presentation wow hello nice greatEarth Day Presentation wow hello nice great
Earth Day Presentation wow hello nice great
 
GRADE 4 - SUMMATIVE TEST QUARTER 4 ALL SUBJECTS
GRADE 4 - SUMMATIVE TEST QUARTER 4 ALL SUBJECTSGRADE 4 - SUMMATIVE TEST QUARTER 4 ALL SUBJECTS
GRADE 4 - SUMMATIVE TEST QUARTER 4 ALL SUBJECTS
 
Barangay Council for the Protection of Children (BCPC) Orientation.pptx
Barangay Council for the Protection of Children (BCPC) Orientation.pptxBarangay Council for the Protection of Children (BCPC) Orientation.pptx
Barangay Council for the Protection of Children (BCPC) Orientation.pptx
 
Activity 2-unit 2-update 2024. English translation
Activity 2-unit 2-update 2024. English translationActivity 2-unit 2-update 2024. English translation
Activity 2-unit 2-update 2024. English translation
 
Inclusivity Essentials_ Creating Accessible Websites for Nonprofits .pdf
Inclusivity Essentials_ Creating Accessible Websites for Nonprofits .pdfInclusivity Essentials_ Creating Accessible Websites for Nonprofits .pdf
Inclusivity Essentials_ Creating Accessible Websites for Nonprofits .pdf
 
ICS2208 Lecture6 Notes for SL spaces.pdf
ICS2208 Lecture6 Notes for SL spaces.pdfICS2208 Lecture6 Notes for SL spaces.pdf
ICS2208 Lecture6 Notes for SL spaces.pdf
 
Global Lehigh Strategic Initiatives (without descriptions)
Global Lehigh Strategic Initiatives (without descriptions)Global Lehigh Strategic Initiatives (without descriptions)
Global Lehigh Strategic Initiatives (without descriptions)
 
INTRODUCTION TO CATHOLIC CHRISTOLOGY.pptx
INTRODUCTION TO CATHOLIC CHRISTOLOGY.pptxINTRODUCTION TO CATHOLIC CHRISTOLOGY.pptx
INTRODUCTION TO CATHOLIC CHRISTOLOGY.pptx
 
THEORIES OF ORGANIZATION-PUBLIC ADMINISTRATION
THEORIES OF ORGANIZATION-PUBLIC ADMINISTRATIONTHEORIES OF ORGANIZATION-PUBLIC ADMINISTRATION
THEORIES OF ORGANIZATION-PUBLIC ADMINISTRATION
 

TESOL Membership Statistics by February 2010

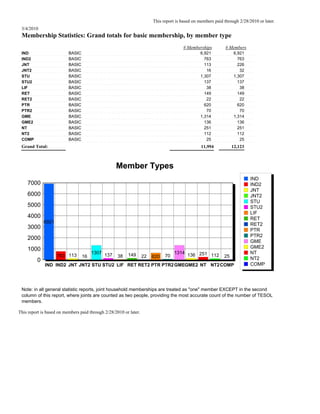
  • 1. This report is based on members paid through 2/28/2010 or later. 3/4/2010 Membership Statistics: Grand totals for basic membership, by member type # Memberships # Members IND BASIC 6,921 6,921 IND2 BASIC 763 763 JNT BASIC 113 226 JNT2 BASIC 16 32 STU BASIC 1,307 1,307 STU2 BASIC 137 137 LIF BASIC 38 38 RET BASIC 149 149 RET2 BASIC 22 22 PTR BASIC 620 620 PTR2 BASIC 70 70 GME BASIC 1,314 1,314 GME2 BASIC 136 136 NT BASIC 251 251 NT2 BASIC 112 112 COMP BASIC 25 25 Grand Total: 11,994 12,123 Member Types IND 7000 IND2 JNT 6000 JNT2 STU 5000 STU2 LIF 4000 RET 6921 RET2 3000 PTR PTR2 2000 GME 1000 GME2 1307 137 149 1314 136 251 NT 763 113 16 38 22 620 70 112 25 0 NT2 IND IND2 JNT JNT2 STU STU2 LIF RET RET2 PTR PTR2 GMEGME2 NT NT2COMP COMP Note: in all general statistic reports, joint household memberships are treated as "one" member EXCEPT in the second column of this report, where joints are counted as two people, providing the most accurate count of the number of TESOL members. This report is based on members paid through 2/28/2010 or later.
  • 2. 3/4/2010 Membership counts by country for members paid through 2/28/2010 or later. Country/State/Province Total AFGHANISTAN 1 0.0% ALBANIA 5 0.0% ALGERIA 19 0.2% ANGOLA 2 0.0% ARGENTINA 27 0.2% ARMENIA 4 0.0% AUSTRALIA 60 0.5% AUSTRIA 4 0.0% AZERBAIJAN 2 0.0% BAHRAIN 11 0.1% BANGLADESH 9 0.1% BELARUS 2 0.0% BELGIUM 1 0.0% BOLIVIA 57 0.5% BOSNIA AND HERZEGOVINA 1 0.0% BRAZIL 97 0.8% BRUNEI DARUSSALAM 1 0.0% BULGARIA 1 0.0% BURKINA FASO 4 0.0% CAMBODIA 5 0.0% CAMEROON 44 0.4% Canada 1 0.0% CANADA CANADA 2 CANADA Alberta 46 CANADA British Columbia 105 CANADA Manitoba 18 CANADA New Brunswick 20 CANADA Newfoundland 4 CANADA North Dakota 1 CANADA Nova Scotia 10 CANADA Nunavut 1 CANADA Ontario 101 CANADA Prince Edward Island 4 CANADA Quebec 34 CANADA Saskatchewan 6 CANADA Yukon Territory 1 CANADA 353 2.9% CHILE 19 0.2% CHINA 89 0.7% COLOMBIA 32 0.3% COSTA RICA 32 0.3% CROATIA 2 0.0% CYPRUS 4 0.0% CZECH REPUBLIC 8 0.1% DENMARK 2 0.0% DOMINICAN REPUBLIC 14 0.1% EAST TIMOR 1 0.0% ECUADOR 33 0.3% EGYPT 29 0.2% EL SALVADOR 2 0.0% ESTONIA 2 0.0% FINLAND 7 0.1% FRANCE 17 0.1% GEORGIA 12 0.1% GERMANY 21 0.2% GREECE 20 0.2%
  • 3. GUAM 3 0.0% GUATEMALA 21 0.2% HAITI 15 0.1% HONDURAS 5 0.0% HONG KONG 11 0.1% HONG KONG SAR CHINA 24 0.2% HUNGARY 5 0.0% ICELAND 3 0.0% INDIA 26 0.2% INDONESIA 45 0.4% IRAN 5 0.0% IRAQ 16 0.1% IRELAND 3 0.0% ISRAEL 27 0.2% ITALY 31 0.3% JAPAN 445 3.7% JORDAN 7 0.1% KAZAKHSTAN 6 0.1% KOREA, REPUBLIC OF 26 0.2% KOSOVO (UNMIK) 1 0.0% KUWAIT 18 0.2% KYRGYZSTAN 2 0.0% LAOS 10 0.1% LATVIA 1 0.0% LEBANON 7 0.1% LIBYA 6 0.1% LITHUANIA 4 0.0% MACAO 11 0.1% MACEDONIA 4 0.0% MADAGASCAR 9 0.1% MALAYSIA 16 0.1% MALDIVES 1 0.0% MALTA 1 0.0% MARSHALL ISLANDS 5 0.0% MAURITANIA 1 0.0% MEXICO 179 1.5% MOLDOVA, REPUBLIC OF 3 0.0% MONGOLIA 7 0.1% MOROCCO 29 0.2% MOZAMBIQUE 1 0.0% MYANMAR 3 0.0% NEPAL 5 0.0% NETHERLANDS 4 0.0% NETHERLANDS ANTILLES 1 0.0% NEW ZEALAND 14 0.1% NICARAGUA 7 0.1% NIGER 1 0.0% NIGERIA 1 0.0% OMAN 11 0.1% PAKISTAN 13 0.1% PALESTINIAN TERRITORY 1 0.0% PANAMA 32 0.3% PAPUA NEW GUINEA 1 0.0% PARAGUAY 7 0.1% PEOPLES REP OF CHINA 54 0.5% PERU 87 0.7% PHILIPPINES 50 0.4% POLAND 11 0.1% PORTUGAL 1 0.0% QATAR 29 0.2% ROMANIA 3 0.0%
  • 4. RUSSIA 43 0.4% RUSSIAN FEDERATION 7 0.1% RWANDA 1 0.0% SAUDI ARABIA 37 0.3% SENEGAL 9 0.1% SERBIA 5 0.0% SIERRA LEONE 1 0.0% SINGAPORE 18 0.2% SLOVAKIA 4 0.0% SOUTH AFRICA 7 0.1% SOUTH KOREA 58 0.5% SPAIN 14 0.1% SRI LANKA 2 0.0% SUDAN 6 0.1% SWAZILAND 1 0.0% SWEDEN 8 0.1% SWITZERLAND 8 0.1% SYRIAN ARAB REPUBLIC 3 0.0% TAIWAN 25 0.2% TAIWAN ROC 46 0.4% TAIWAN, PROVINCE OF CHINA 2 0.0% TAJIKISTAN 2 0.0% THAILAND 39 0.3% TRINIDAD AND TOBAGO 1 0.0% TUNISIA 13 0.1% TURKEY 53 0.4% UGANDA 1 0.0% UKRAINE 26 0.2% UNITED ARAB EMIRATES 56 0.5% UNITED KINGDOM 54 0.5% UNITED STATES OF AMERICA 7 0.1% URUGUAY 20 0.2% US MINOR OUTLYING ISLANDS 1 0.0% USA USA 15 USA Alabama 49 USA Alaska 22 USA American Embassy 21 USA Arizona 185 USA Arkansas 81 USA Armed Forces 8 USA Armed Frces Americas 1 USA British Columbia 1 USA California 863 USA Colorado 394 USA Connecticut 173 USA Delaware 28 USA District of Columbia 127 USA Florida 321 USA Georgia 202 USA Guam 2 USA Hawaii 68 USA Idaho 32 USA Illinois 320 USA Indiana 152 USA Iowa 100 USA Kansas 105 USA Kentucky 71 USA Lousiana 44 USA Maine 57
  • 5. USA Manitoba 2 USA Maryland 290 USA Massachusetts 706 USA Michigan 209 USA Minnesota 185 USA Mississippi 50 USA Missouri 165 USA Montana 24 USA N Mariana Islands 1 USA Nebraska 48 USA Nevada 50 USA New Hampshire 102 USA New Jersey 263 USA New Mexico 53 USA New York 655 USA North Carolina 111 USA North Dakota 24 USA Ohio 204 USA Oklahoma 77 USA Ontario 1 USA Oregon 165 USA Pennsylvania 356 USA Puerto Rico 41 USA Rhode Island 99 USA South Carolina 48 USA South Dakota 11 USA Tennessee 91 USA Texas 421 USA Utah 116 USA Vermont 92 USA Virginia 344 USA Washington 270 USA West Virgina 29 USA Wisconsin 180 USA Wyoming 17 USA 8,942 74.5% UZBEKISTAN 2 0.0% VENEZUELA 12 0.1% VIET NAM 6 0.1% VIETNAM 14 0.1% VIRGIN ISLANDS, U.S. 6 0.1% YEMEN 4 0.0% Grand Total: 11,997 143 distinct countries represented. 02-geographic.rpt 2/28/2010
  • 6. 3/4/2010 Membership counts by country for members paid through 02/28/2010 or later. USA Top 5 States per Country 6000 5000 4000 California Massachusetts New York 3000 5973 Texas Colorado 2000 Others 1000 866 715 662 419 399 0 California Massachusetts New York Texas Colorado Others CANADA Top 5 States per Country 120 100 80 British Columbia Ontario Alberta 60 Quebec 105 101 New Brunswick 40 Others 46 46 20 34 19 0 British Columbia Ontario Alberta Quebec New Brunswick Others Top 10 Countries 1632 57 58 61 USA 74.7% 86 89 JAPAN 3.7% 97 180 CANADA 2.9% 351 MEXICO 1.5% BRAZIL 0.8% 445 CHINA 0.7% PERU 0.7% AUSTRALIA 0.5% SOUTH KOREA 0.5% BOLIVIA 0.5% Others 13.5% Total: 100.0% 9034
  • 7. 3/4/2010 Basic statistics on Primary vs. other memberships in interest sections. For members paid through 2/28/2010 or later. Primary versus other No Primary Interest Section 1.2% 443 441 2 Adult Education 7.4% 2,784 1,300 1,484 Applied Linguistics 6.1% 2,294 765 1,529 Bilingual Education 4.1% 1,526 333 1,193 Computer-Assisted Language Learning 5.3% 1,992 489 1,503 Elementary Education 4.9% 1,851 908 943 English as a Foreign Language 8.5% 3,189 1,490 1,699 English for Specific Purposes 4.4% 1,639 290 1,349 Higher Education 6.1% 2,310 914 1,396 Intercultural Communication 4.7% 1,783 294 1,489 Intensive English Programs 5.4% 2,044 694 1,350 International Teaching Assistants 2.7% 997 121 876 Materials Writers 3.4% 1,295 232 1,063 Nonnative English Speakers in TESOL 3.0% 1,130 210 920 Program Administration 3.3% 1,243 273 970 Refugee Concerns 2.3% 878 119 759 Second Language Writing 5.7% 2,145 408 1,737 Speech, Pronunciation, and Listening 5.0% 1,896 295 1,601 Social Responsibility 1.6% 599 34 565 Secondary Schools 4.1% 1,555 632 923 Teacher Education 7.2% 2,713 836 1,877 Video & Digital Media 3.5% 1,313 126 1,187 11,212 distinct members Total # of IS memberships 37,619 11,204 26,415 The total count is the number of IS memberships total and may either be LESS or MORE than the actual number of individual members of TESOL. Due to open access to Interest Sections, these numbers may fluctuate considerably each month. For instance, one member may have selected four interest sections, while some members may belong to none. Interest Sections (Primary) 1NO_PRIM_IS AE 1600 AL BE 1400 CALL EE 1200 EFL ESP # of members 1000 HE IC IEP 800 ITA MW 600 NNEST PA 400 RC SLW 200 SPL SR SS 0 TE 1NO_PRIM_IS AL AE BE CALL EE EFL ESP HE IC IEP ITA MWNNESTPA RC SLW SPL SR SS TE VDM VDM
  • 8. Basic Statistics on Area of Work (Members paid through >= 2/28/2010) Elementary Education EE 1,138 9.6% Secondary Education SE 1,184 10.0% Community/2yr College CC 756 6.4% Postsecondary Education HE 2,972 25.0% Adult Education AE 2,075 17.5% Mainstream MN 50 0.4% Other OT 1,253 10.5% 2,450 20.6% 11,878 Only members who selected an area of work are included on this report. Other members may not have responded to this question and are excluded from the count. Areas of Work EE SE CC EE 9.6% SE 10.0% CC 6.4% HE 25.0% AE 17.5% MN 0.4% OT 10.5% 20.6% Total: 100.0% OT MN AE HE (Blanks indicate no response)
  • 9. Statistics on Areas of Interest (Members paid through >= 2/28/2010) CODE DESCRIPTION TOTAL* % of TOTAL* EFL English as a foreign language 2,942 5% TE Teacher education 2,676 4% CURRICULUM Materials development/Curriculum 2,647 4% SLA Second language acquisition 2,596 4% AL Applied linguistics 2,464 4% IC Multiculturalism/intercultural communications 2,463 4% AE Adult education 2,340 4% CALL Technology in education 2,235 4% WRITING Writing/composition 2,209 4% CONTENT Content-based instruction 2,147 4% HE Higher education 2,066 3% PROFDEV Professional development 1,982 3% IEP Intensive English programs 1,972 3% READING Reading/literacy 1,921 3% SP Speaking/pronunciation 1,864 3% ASSESS Assessment/testing 1,756 3% GRAMMAR Grammar 1,729 3% ESP English for specific purposes 1,674 3% BE Bilingual education 1,532 2% RS Research 1,502 2% EE Elementary/primary education 1,262 2% PA Program administration 1,220 2% DISTANCE Distance learning/Online Education 1,156 2% VOCAB Vocabulary/Lexicon 1,097 2% SS Secondary education 1,096 2% SOCIAL Social/global/political concerns 1,045 2% WORKPLACE Workplace English instruction/Business English 951 2% VI Video and digital media 948 2% LISTEN Listening 930 2% ISKILL Integrated Skills 929 2% COMMCOLL Community college/technical ed 818 1% LIT Literature 717 1% RC Refugee concerns 710 1% LINGUISTICS Theoretical Linguistics 705 1% STANDARDS Standards 689 1% ITA International teaching assistants 681 1% FAMILY Community/family outreach 600 1% EMPLOYMENT Employment issues/Certification 476 1% LDSN Learning Disorders/Special Needs 475 1% PUBLICPOLICY Public policy 451 1% NNES NNES/NES issues 434 1% MAINSTREAMING Mainstreaming 433 1% ARTS Arts/Media/Science/Math/Social Science 359 1% ACCRED Accreditation 295 0% STYLISTICS Stylistics 118 0%
  • 10. Sorted in order of prevalence. * Note: Members are encouraged to choose multiple areas of interest and some members do not choose any areas of interest. The total number of distinct members (8,491) represented in this report is less than the total number of active members as indicated elsewhere in this report. Areas of interest are separate from official TESOL interest sections. Areas of interest represent distinct areas in which a member may be interested, rather than official entities in which a member is involved. Areas of interest which have a very low count may be recent additions to the AOI list, or may reflect overall trends in membership.
  • 11. Statistics on Areas of Expertise (Members paid through >= 2/28/2010) CODE DESCRIPTION TOTAL* % of TOTAL* EFL English as a foreign language 1,788 7% AE Adult education 1,436 6% CURRICULUM Materials development/Curriculum 1,235 5% WRITING Writing/composition 1,114 4% AL Applied linguistics 1,084 4% TE Teacher education 1,046 4% SLA Second language acquisition 1,038 4% IEP Intensive English programs 1,012 4% HE Higher education 955 4% CONTENT Content-based instruction 926 4% GRAMMAR Grammar 863 3% IC Multiculturalism/intercultural communications 810 3% EE Elementary/primary education 790 3% READING Reading/literacy 697 3% CALL Technology in education 677 3% ESP English for specific purposes 676 3% SP Speaking/pronunciation 653 3% PROFDEV Professional development 651 3% ASSESS Assessment/testing 610 2% PA Program administration 590 2% SS Secondary education 521 2% BE Bilingual education 507 2% ISKILL Integrated Skills 479 2% COMMCOLL Community college/technical ed 441 2% WORKPLACE Workplace English instruction/Business English 407 2% DISTANCE Distance learning/Online Education 390 2% RS Research 365 1% LISTEN Listening 347 1% LIT Literature 320 1% VOCAB Vocabulary/Lexicon 310 1% SOCIAL Social/global/political concerns 256 1% VI Video and digital media 211 1% ITA International teaching assistants 194 1% ARTS Arts/Media/Science/Math/Social Science 188 1% NNES NNES/NES issues 177 1% FAMILY Community/family outreach 173 1% STANDARDS Standards 165 1% ACCRED Accreditation 156 1% LINGUISTICS Theoretical Linguistics 154 1% RC Refugee concerns 146 1% MAINSTREAMING Mainstreaming 139 1% LDSN Learning Disorders/Special Needs 137 1% EMPLOYMENT Employment issues/Certification 107 0% PUBLICPOLICY Public policy 77 0% STYLISTICS Stylistics 29 0%
  • 12. Sorted in order of prevalence. * Note: Members are encouraged to choose multiple areas of expertise and some members do not choose any areas of expertise. The total number of distinct members (6,319) represented in this report is less than the total number of active members as indicated elsewhere in this report. Areas of Expertise are separate from official TESOL interest sections or Areas of Interest. Areas of expertise represent distinct areas in which a member may be experienced in, rather than official entities in which a member is involved. Areas of interest which have a very low count may be recent additions to the AOI list, or may reflect overall trends in membership.