SlideShare una empresa de Scribd logo
1 de 4
Descargar para leer sin conexión
Shiller Index Value

       Ja
          n-


                  0.00
                         50.00
                                  100.00
                                                          150.00
                                                                   200.00
                                                                            250.00
       M 00
        ay
           -
       Se 00
          p-
             0
       Ja 0
          n-
       M 01
        ay
           -
       Se 01
          p-
             0
       Ja 1
          n-
       M 02
        ay
           -
       Se 02
          p-
             0
       Ja 2
          n-
       M 03
        ay
           -
       Se 03
          p-
             0
       Ja 3
          n-
       M 04
        ay
           -
       Se 04
          p-
             0


Date
       Ja 4
          n-
       M 05
        ay
           -
       Se 05
          p-
             0
       Ja 5
          n-
       M 06
        ay
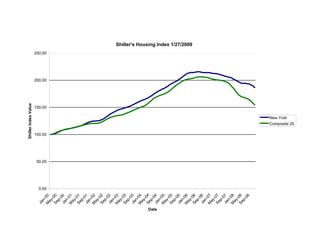
                                                                                     Shiller's Housing Index 1/27/2009


           -
       Se 06
          p-
             0
       Ja 6
          n-
       M 07
        ay
           -
       Se 07
          p-
             0
       Ja 7
          n-
       M 08
        ay
           -
       Se 08
          p-
             08
                                           New York
                                           Composite 20
Shiller's Housing Indices - Northeast NYC Overall 01272009


                 DC-Washington MA-Boston NY-New York Composite-20
Date                WDXR         BOXR       NYXR       SPCS20R
                         100.00    100.00     100.00       100.00
January 2000
                         100.53    100.36     100.54       100.76
February 2000
                         101.70    101.31     101.27       101.95
March 2000
                         103.34    103.27     102.41       103.50
April 2000
                         104.91    105.85     104.35       105.20
May 2000
                         106.29    108.48     106.00       106.76
June 2000
                         107.72    110.00     107.52       107.77
July 2000
                         109.10    111.38     108.90       108.64
August 2000
                         110.18    112.67     109.76       109.35
September 2000
                         110.50    114.11     110.51       110.04
October 2000
                         110.99    115.36     110.89       110.81
November 2000
                         111.96    116.56     111.87       111.58
December 2000
                         112.73    117.67     112.66       112.39
January 2001
                         113.99    118.51     113.51       113.07
February 2001
                         115.40    119.94     114.48       114.14
March 2001
                         117.90    121.54     115.60       115.29
April 2001
                         119.30    123.11     116.38       116.24
May 2001
                         120.93    125.12     117.90       117.29
June 2001
                         122.31    126.76     119.66       118.20
July 2001
                         123.61    128.26     121.41       119.09
August 2001
                         124.50    129.62     122.91       119.84
September 2001
                         124.87    130.51     123.86       120.31
October 2001
                         124.93    130.94     124.74       120.53
November 2001
                         125.65    130.06     124.72       120.43
December 2001
                         125.99    129.93     125.19       120.64
January 2002
                         127.19    129.63     125.40       121.06
February 2002
                         128.47    131.21     126.50       122.30
March 2002
                         130.78    133.34     127.93       123.92
April 2002
                         133.40    136.76     129.89       125.86
May 2002
                         135.67    139.56     132.20       127.82
June 2002
                         138.48    141.77     135.18       129.66
July 2002
                         140.68    143.66     137.74       131.22
August 2002
                         142.39    145.85     139.69       132.43
September 2002
                         143.30    147.43     141.58       133.55
October 2002
                         143.77    148.33     143.29       134.41
November 2002
                         144.96    147.28     145.20       135.15
December 2002
                         145.19    146.79     146.55       135.64
January 2003
                         146.01    147.18     147.30       136.19
February 2003
                         146.75    148.99     148.38       137.20
March 2003
                         148.92    150.42     149.53       138.56
April 2003
                         151.53    152.15     150.88       140.06
May 2003
                         154.00    153.30     151.86       141.39
June 2003
                         156.47    154.21     153.50       142.99
July 2003
                         158.70    154.97     155.14       144.56
August 2003
                         161.01    156.38     157.10       146.28
September 2003
                         162.65    157.63     158.73       147.82
October 2003
                         164.14    158.63     160.59       149.22
November 2003
                         165.79    158.58     162.31       150.49
December 2003
                         167.79    158.54     163.63       151.69
January 2004
                         169.51    159.19     164.92       153.10
February 2004
Shiller's Housing Indices - Northeast NYC Overall 01272009


                         172.30      161.10          166.61          155.49
March 2004
                         176.62      164.29          168.30          158.47
April 2004
                         182.19      166.59          170.52          161.60
May 2004
                         188.02      168.57          172.90          164.82
June 2004
                         192.08      169.69          175.74          167.43
July 2004
                         195.39      170.90          177.93          169.31
August 2004
                         198.24      172.18          179.79          170.96
September 2004
                         200.79      173.97          181.90          172.41
October 2004
                         203.31      174.04          183.69          173.65
November 2004
                         206.06      173.42          185.16          174.83
December 2004
                         208.63      173.43          187.19          176.44
January 2005
                         212.24      174.76          189.29          178.50
February 2005
                         217.86      176.92          192.17          181.30
March 2005
                         224.09      179.04          194.10          184.24
April 2005
                         229.87      181.17          195.96          187.21
May 2005
                         235.38      181.33          197.77          190.10
June 2005
                         239.50      181.90          199.86          192.67
July 2005
                         242.06      181.67          202.33          194.98
August 2005
                         244.11      182.45          204.83          197.36
September 2005
                         245.44      182.07          207.64          199.40
October 2005
                         246.70      181.69          210.30          200.97
November 2005
                         247.37      179.44          212.68          201.97
December 2005
                         247.70      178.17          213.50          202.44
January 2006
                         248.39      176.28          214.47          203.19
February 2006
                         248.86      177.12          214.33          203.65
March 2006
                         250.17      177.62          214.97          204.82
April 2006
                         251.07      178.61          215.57          205.86
May 2006
                         250.99      177.90          215.83          206.38
June 2006
                         249.92      177.79          215.25          206.52
July 2006
                         247.94      177.28          214.34          206.18
August 2006
                         244.78      176.34          214.08          205.80
September 2006
                         243.73      175.72          214.28          205.41
October 2006
                         242.28      172.59          214.24          204.65
November 2006
                         240.45      170.31          213.79          203.33
December 2006
                         238.85      168.29          212.78          202.31
January 2007
                         237.98      168.04          212.51          201.57
February 2007
                         237.14      168.52          212.39          201.01
March 2007
                         236.17      169.61          211.61          200.53
April 2007
                         235.41      170.96          210.51          200.12
May 2007
                         234.02      171.29          209.49          199.44
June 2007
                         232.17      171.77          208.36          198.71
July 2007
                         230.21      170.84          207.17          197.37
August 2007
                         229.25      170.73          206.37          195.69
September 2007
                         227.56      169.33          205.52          192.97
October 2007
                         223.85      167.39          204.36          188.94
November 2007
                         218.35      164.58          202.08          184.96
December 2007
                         213.20      162.59          200.44          180.69
January 2008
                         207.95      160.31          198.29          175.96
February 2008
                         203.39      158.52          196.51          172.20
March 2008
                         201.32      158.68          194.73          169.98
April 2008
                         199.27      160.34          194.22          168.60
May 2008
                         197.61      162.31          194.74          167.78
June 2008
Shiller's Housing Indices - Northeast NYC Overall 01272009


                         195.44      162.58          193.71          166.36
July 2008
                         194.15      162.75          193.49          164.65
August 2008
                         189.99      160.98          191.65          161.64
September 2008
                         184.92      159.17          189.79          158.12
October 2008
                         180.50      155.03          186.81          154.59
November 2008
December 2008

Más contenido relacionado

Más de Hoboken Resistance

Tim Occhipinti Elec report 11-23-2010
Tim Occhipinti Elec report 11-23-2010Tim Occhipinti Elec report 11-23-2010
Tim Occhipinti Elec report 11-23-2010Hoboken Resistance
 
Mike Lenz ELEC report 11-30-2010
Mike Lenz ELEC report 11-30-2010Mike Lenz ELEC report 11-30-2010
Mike Lenz ELEC report 11-30-2010Hoboken Resistance
 
City council terminates agreement with Hekenian
City council terminates agreement with HekenianCity council terminates agreement with Hekenian
City council terminates agreement with HekenianHoboken Resistance
 
H S Recreation Capital Request
H S  Recreation  Capital  RequestH S  Recreation  Capital  Request
H S Recreation Capital RequestHoboken Resistance
 
Taxi And Limo New Request Personnel
Taxi And Limo New Request PersonnelTaxi And Limo New Request Personnel
Taxi And Limo New Request PersonnelHoboken Resistance
 
Taxi And Limo Appropriation Request
Taxi And Limo Appropriation RequestTaxi And Limo Appropriation Request
Taxi And Limo Appropriation RequestHoboken Resistance
 
Purchasing Copiers & Printers Appropriation
Purchasing Copiers & Printers AppropriationPurchasing Copiers & Printers Appropriation
Purchasing Copiers & Printers AppropriationHoboken Resistance
 

Más de Hoboken Resistance (20)

Tim Occhipinti Elec report 11-23-2010
Tim Occhipinti Elec report 11-23-2010Tim Occhipinti Elec report 11-23-2010
Tim Occhipinti Elec report 11-23-2010
 
Mike Lenz ELEC report 11-30-2010
Mike Lenz ELEC report 11-30-2010Mike Lenz ELEC report 11-30-2010
Mike Lenz ELEC report 11-30-2010
 
Roh wine tasting invite form
Roh wine tasting invite formRoh wine tasting invite form
Roh wine tasting invite form
 
Mayor cammarano-schaffer
Mayor cammarano-schafferMayor cammarano-schaffer
Mayor cammarano-schaffer
 
City council terminates agreement with Hekenian
City council terminates agreement with HekenianCity council terminates agreement with Hekenian
City council terminates agreement with Hekenian
 
Memorandum 6-16-10 hoboken
Memorandum 6-16-10 hobokenMemorandum 6-16-10 hoboken
Memorandum 6-16-10 hoboken
 
Port Authority Budget 2010
Port Authority Budget 2010Port Authority Budget 2010
Port Authority Budget 2010
 
3 Capital Master List
3 Capital Master List3 Capital Master List
3 Capital Master List
 
2 Sfy 10 Detail Budget
2 Sfy 10 Detail Budget2 Sfy 10 Detail Budget
2 Sfy 10 Detail Budget
 
H S Recreation Capital Request
H S  Recreation  Capital  RequestH S  Recreation  Capital  Request
H S Recreation Capital Request
 
1 Introduced Budget
1 Introduced Budget1 Introduced Budget
1 Introduced Budget
 
Taxi And Limo Revenue 2010
Taxi And Limo Revenue 2010Taxi And Limo Revenue 2010
Taxi And Limo Revenue 2010
 
Taxi And Limo Recommendations
Taxi And Limo RecommendationsTaxi And Limo Recommendations
Taxi And Limo Recommendations
 
Taxi And Limo Narrative
Taxi And Limo NarrativeTaxi And Limo Narrative
Taxi And Limo Narrative
 
Taxi And Limo New Request Personnel
Taxi And Limo New Request PersonnelTaxi And Limo New Request Personnel
Taxi And Limo New Request Personnel
 
Taxi And Limo Capital Request
Taxi And Limo Capital RequestTaxi And Limo Capital Request
Taxi And Limo Capital Request
 
Taxi And Limo Appropriation Request
Taxi And Limo Appropriation RequestTaxi And Limo Appropriation Request
Taxi And Limo Appropriation Request
 
Purchasing Narrative
Purchasing NarrativePurchasing Narrative
Purchasing Narrative
 
Purchasing Copiers & Printers Appropriation
Purchasing Copiers & Printers AppropriationPurchasing Copiers & Printers Appropriation
Purchasing Copiers & Printers Appropriation
 
Purchasing Capital Request
Purchasing Capital RequestPurchasing Capital Request
Purchasing Capital Request
 

Último

AI as an Interface for Commercial Buildings
AI as an Interface for Commercial BuildingsAI as an Interface for Commercial Buildings
AI as an Interface for Commercial BuildingsMemoori
 
Install Stable Diffusion in windows machine
Install Stable Diffusion in windows machineInstall Stable Diffusion in windows machine
Install Stable Diffusion in windows machinePadma Pradeep
 
"LLMs for Python Engineers: Advanced Data Analysis and Semantic Kernel",Oleks...
"LLMs for Python Engineers: Advanced Data Analysis and Semantic Kernel",Oleks..."LLMs for Python Engineers: Advanced Data Analysis and Semantic Kernel",Oleks...
"LLMs for Python Engineers: Advanced Data Analysis and Semantic Kernel",Oleks...Fwdays
 
Human Factors of XR: Using Human Factors to Design XR Systems
Human Factors of XR: Using Human Factors to Design XR SystemsHuman Factors of XR: Using Human Factors to Design XR Systems
Human Factors of XR: Using Human Factors to Design XR SystemsMark Billinghurst
 
Gen AI in Business - Global Trends Report 2024.pdf
Gen AI in Business - Global Trends Report 2024.pdfGen AI in Business - Global Trends Report 2024.pdf
Gen AI in Business - Global Trends Report 2024.pdfAddepto
 
Artificial intelligence in cctv survelliance.pptx
Artificial intelligence in cctv survelliance.pptxArtificial intelligence in cctv survelliance.pptx
Artificial intelligence in cctv survelliance.pptxhariprasad279825
 
Commit 2024 - Secret Management made easy
Commit 2024 - Secret Management made easyCommit 2024 - Secret Management made easy
Commit 2024 - Secret Management made easyAlfredo García Lavilla
 
Vector Databases 101 - An introduction to the world of Vector Databases
Vector Databases 101 - An introduction to the world of Vector DatabasesVector Databases 101 - An introduction to the world of Vector Databases
Vector Databases 101 - An introduction to the world of Vector DatabasesZilliz
 
Scanning the Internet for External Cloud Exposures via SSL Certs
Scanning the Internet for External Cloud Exposures via SSL CertsScanning the Internet for External Cloud Exposures via SSL Certs
Scanning the Internet for External Cloud Exposures via SSL CertsRizwan Syed
 
Powerpoint exploring the locations used in television show Time Clash
Powerpoint exploring the locations used in television show Time ClashPowerpoint exploring the locations used in television show Time Clash
Powerpoint exploring the locations used in television show Time Clashcharlottematthew16
 
WordPress Websites for Engineers: Elevate Your Brand
WordPress Websites for Engineers: Elevate Your BrandWordPress Websites for Engineers: Elevate Your Brand
WordPress Websites for Engineers: Elevate Your Brandgvaughan
 
The Future of Software Development - Devin AI Innovative Approach.pdf
The Future of Software Development - Devin AI Innovative Approach.pdfThe Future of Software Development - Devin AI Innovative Approach.pdf
The Future of Software Development - Devin AI Innovative Approach.pdfSeasiaInfotech2
 
Streamlining Python Development: A Guide to a Modern Project Setup
Streamlining Python Development: A Guide to a Modern Project SetupStreamlining Python Development: A Guide to a Modern Project Setup
Streamlining Python Development: A Guide to a Modern Project SetupFlorian Wilhelm
 
SAP Build Work Zone - Overview L2-L3.pptx
SAP Build Work Zone - Overview L2-L3.pptxSAP Build Work Zone - Overview L2-L3.pptx
SAP Build Work Zone - Overview L2-L3.pptxNavinnSomaal
 
My Hashitalk Indonesia April 2024 Presentation
My Hashitalk Indonesia April 2024 PresentationMy Hashitalk Indonesia April 2024 Presentation
My Hashitalk Indonesia April 2024 PresentationRidwan Fadjar
 
Unraveling Multimodality with Large Language Models.pdf
Unraveling Multimodality with Large Language Models.pdfUnraveling Multimodality with Large Language Models.pdf
Unraveling Multimodality with Large Language Models.pdfAlex Barbosa Coqueiro
 
Connect Wave/ connectwave Pitch Deck Presentation
Connect Wave/ connectwave Pitch Deck PresentationConnect Wave/ connectwave Pitch Deck Presentation
Connect Wave/ connectwave Pitch Deck PresentationSlibray Presentation
 
Dev Dives: Streamline document processing with UiPath Studio Web
Dev Dives: Streamline document processing with UiPath Studio WebDev Dives: Streamline document processing with UiPath Studio Web
Dev Dives: Streamline document processing with UiPath Studio WebUiPathCommunity
 
DevoxxFR 2024 Reproducible Builds with Apache Maven
DevoxxFR 2024 Reproducible Builds with Apache MavenDevoxxFR 2024 Reproducible Builds with Apache Maven
DevoxxFR 2024 Reproducible Builds with Apache MavenHervé Boutemy
 

Último (20)

DMCC Future of Trade Web3 - Special Edition
DMCC Future of Trade Web3 - Special EditionDMCC Future of Trade Web3 - Special Edition
DMCC Future of Trade Web3 - Special Edition
 
AI as an Interface for Commercial Buildings
AI as an Interface for Commercial BuildingsAI as an Interface for Commercial Buildings
AI as an Interface for Commercial Buildings
 
Install Stable Diffusion in windows machine
Install Stable Diffusion in windows machineInstall Stable Diffusion in windows machine
Install Stable Diffusion in windows machine
 
"LLMs for Python Engineers: Advanced Data Analysis and Semantic Kernel",Oleks...
"LLMs for Python Engineers: Advanced Data Analysis and Semantic Kernel",Oleks..."LLMs for Python Engineers: Advanced Data Analysis and Semantic Kernel",Oleks...
"LLMs for Python Engineers: Advanced Data Analysis and Semantic Kernel",Oleks...
 
Human Factors of XR: Using Human Factors to Design XR Systems
Human Factors of XR: Using Human Factors to Design XR SystemsHuman Factors of XR: Using Human Factors to Design XR Systems
Human Factors of XR: Using Human Factors to Design XR Systems
 
Gen AI in Business - Global Trends Report 2024.pdf
Gen AI in Business - Global Trends Report 2024.pdfGen AI in Business - Global Trends Report 2024.pdf
Gen AI in Business - Global Trends Report 2024.pdf
 
Artificial intelligence in cctv survelliance.pptx
Artificial intelligence in cctv survelliance.pptxArtificial intelligence in cctv survelliance.pptx
Artificial intelligence in cctv survelliance.pptx
 
Commit 2024 - Secret Management made easy
Commit 2024 - Secret Management made easyCommit 2024 - Secret Management made easy
Commit 2024 - Secret Management made easy
 
Vector Databases 101 - An introduction to the world of Vector Databases
Vector Databases 101 - An introduction to the world of Vector DatabasesVector Databases 101 - An introduction to the world of Vector Databases
Vector Databases 101 - An introduction to the world of Vector Databases
 
Scanning the Internet for External Cloud Exposures via SSL Certs
Scanning the Internet for External Cloud Exposures via SSL CertsScanning the Internet for External Cloud Exposures via SSL Certs
Scanning the Internet for External Cloud Exposures via SSL Certs
 
Powerpoint exploring the locations used in television show Time Clash
Powerpoint exploring the locations used in television show Time ClashPowerpoint exploring the locations used in television show Time Clash
Powerpoint exploring the locations used in television show Time Clash
 
WordPress Websites for Engineers: Elevate Your Brand
WordPress Websites for Engineers: Elevate Your BrandWordPress Websites for Engineers: Elevate Your Brand
WordPress Websites for Engineers: Elevate Your Brand
 
The Future of Software Development - Devin AI Innovative Approach.pdf
The Future of Software Development - Devin AI Innovative Approach.pdfThe Future of Software Development - Devin AI Innovative Approach.pdf
The Future of Software Development - Devin AI Innovative Approach.pdf
 
Streamlining Python Development: A Guide to a Modern Project Setup
Streamlining Python Development: A Guide to a Modern Project SetupStreamlining Python Development: A Guide to a Modern Project Setup
Streamlining Python Development: A Guide to a Modern Project Setup
 
SAP Build Work Zone - Overview L2-L3.pptx
SAP Build Work Zone - Overview L2-L3.pptxSAP Build Work Zone - Overview L2-L3.pptx
SAP Build Work Zone - Overview L2-L3.pptx
 
My Hashitalk Indonesia April 2024 Presentation
My Hashitalk Indonesia April 2024 PresentationMy Hashitalk Indonesia April 2024 Presentation
My Hashitalk Indonesia April 2024 Presentation
 
Unraveling Multimodality with Large Language Models.pdf
Unraveling Multimodality with Large Language Models.pdfUnraveling Multimodality with Large Language Models.pdf
Unraveling Multimodality with Large Language Models.pdf
 
Connect Wave/ connectwave Pitch Deck Presentation
Connect Wave/ connectwave Pitch Deck PresentationConnect Wave/ connectwave Pitch Deck Presentation
Connect Wave/ connectwave Pitch Deck Presentation
 
Dev Dives: Streamline document processing with UiPath Studio Web
Dev Dives: Streamline document processing with UiPath Studio WebDev Dives: Streamline document processing with UiPath Studio Web
Dev Dives: Streamline document processing with UiPath Studio Web
 
DevoxxFR 2024 Reproducible Builds with Apache Maven
DevoxxFR 2024 Reproducible Builds with Apache MavenDevoxxFR 2024 Reproducible Builds with Apache Maven
DevoxxFR 2024 Reproducible Builds with Apache Maven
 

Shillers Housing Indices Northeast Nyc Overall 01272009

  • 1. Shiller Index Value Ja n- 0.00 50.00 100.00 150.00 200.00 250.00 M 00 ay - Se 00 p- 0 Ja 0 n- M 01 ay - Se 01 p- 0 Ja 1 n- M 02 ay - Se 02 p- 0 Ja 2 n- M 03 ay - Se 03 p- 0 Ja 3 n- M 04 ay - Se 04 p- 0 Date Ja 4 n- M 05 ay - Se 05 p- 0 Ja 5 n- M 06 ay Shiller's Housing Index 1/27/2009 - Se 06 p- 0 Ja 6 n- M 07 ay - Se 07 p- 0 Ja 7 n- M 08 ay - Se 08 p- 08 New York Composite 20
  • 2. Shiller's Housing Indices - Northeast NYC Overall 01272009 DC-Washington MA-Boston NY-New York Composite-20 Date WDXR BOXR NYXR SPCS20R 100.00 100.00 100.00 100.00 January 2000 100.53 100.36 100.54 100.76 February 2000 101.70 101.31 101.27 101.95 March 2000 103.34 103.27 102.41 103.50 April 2000 104.91 105.85 104.35 105.20 May 2000 106.29 108.48 106.00 106.76 June 2000 107.72 110.00 107.52 107.77 July 2000 109.10 111.38 108.90 108.64 August 2000 110.18 112.67 109.76 109.35 September 2000 110.50 114.11 110.51 110.04 October 2000 110.99 115.36 110.89 110.81 November 2000 111.96 116.56 111.87 111.58 December 2000 112.73 117.67 112.66 112.39 January 2001 113.99 118.51 113.51 113.07 February 2001 115.40 119.94 114.48 114.14 March 2001 117.90 121.54 115.60 115.29 April 2001 119.30 123.11 116.38 116.24 May 2001 120.93 125.12 117.90 117.29 June 2001 122.31 126.76 119.66 118.20 July 2001 123.61 128.26 121.41 119.09 August 2001 124.50 129.62 122.91 119.84 September 2001 124.87 130.51 123.86 120.31 October 2001 124.93 130.94 124.74 120.53 November 2001 125.65 130.06 124.72 120.43 December 2001 125.99 129.93 125.19 120.64 January 2002 127.19 129.63 125.40 121.06 February 2002 128.47 131.21 126.50 122.30 March 2002 130.78 133.34 127.93 123.92 April 2002 133.40 136.76 129.89 125.86 May 2002 135.67 139.56 132.20 127.82 June 2002 138.48 141.77 135.18 129.66 July 2002 140.68 143.66 137.74 131.22 August 2002 142.39 145.85 139.69 132.43 September 2002 143.30 147.43 141.58 133.55 October 2002 143.77 148.33 143.29 134.41 November 2002 144.96 147.28 145.20 135.15 December 2002 145.19 146.79 146.55 135.64 January 2003 146.01 147.18 147.30 136.19 February 2003 146.75 148.99 148.38 137.20 March 2003 148.92 150.42 149.53 138.56 April 2003 151.53 152.15 150.88 140.06 May 2003 154.00 153.30 151.86 141.39 June 2003 156.47 154.21 153.50 142.99 July 2003 158.70 154.97 155.14 144.56 August 2003 161.01 156.38 157.10 146.28 September 2003 162.65 157.63 158.73 147.82 October 2003 164.14 158.63 160.59 149.22 November 2003 165.79 158.58 162.31 150.49 December 2003 167.79 158.54 163.63 151.69 January 2004 169.51 159.19 164.92 153.10 February 2004
  • 3. Shiller's Housing Indices - Northeast NYC Overall 01272009 172.30 161.10 166.61 155.49 March 2004 176.62 164.29 168.30 158.47 April 2004 182.19 166.59 170.52 161.60 May 2004 188.02 168.57 172.90 164.82 June 2004 192.08 169.69 175.74 167.43 July 2004 195.39 170.90 177.93 169.31 August 2004 198.24 172.18 179.79 170.96 September 2004 200.79 173.97 181.90 172.41 October 2004 203.31 174.04 183.69 173.65 November 2004 206.06 173.42 185.16 174.83 December 2004 208.63 173.43 187.19 176.44 January 2005 212.24 174.76 189.29 178.50 February 2005 217.86 176.92 192.17 181.30 March 2005 224.09 179.04 194.10 184.24 April 2005 229.87 181.17 195.96 187.21 May 2005 235.38 181.33 197.77 190.10 June 2005 239.50 181.90 199.86 192.67 July 2005 242.06 181.67 202.33 194.98 August 2005 244.11 182.45 204.83 197.36 September 2005 245.44 182.07 207.64 199.40 October 2005 246.70 181.69 210.30 200.97 November 2005 247.37 179.44 212.68 201.97 December 2005 247.70 178.17 213.50 202.44 January 2006 248.39 176.28 214.47 203.19 February 2006 248.86 177.12 214.33 203.65 March 2006 250.17 177.62 214.97 204.82 April 2006 251.07 178.61 215.57 205.86 May 2006 250.99 177.90 215.83 206.38 June 2006 249.92 177.79 215.25 206.52 July 2006 247.94 177.28 214.34 206.18 August 2006 244.78 176.34 214.08 205.80 September 2006 243.73 175.72 214.28 205.41 October 2006 242.28 172.59 214.24 204.65 November 2006 240.45 170.31 213.79 203.33 December 2006 238.85 168.29 212.78 202.31 January 2007 237.98 168.04 212.51 201.57 February 2007 237.14 168.52 212.39 201.01 March 2007 236.17 169.61 211.61 200.53 April 2007 235.41 170.96 210.51 200.12 May 2007 234.02 171.29 209.49 199.44 June 2007 232.17 171.77 208.36 198.71 July 2007 230.21 170.84 207.17 197.37 August 2007 229.25 170.73 206.37 195.69 September 2007 227.56 169.33 205.52 192.97 October 2007 223.85 167.39 204.36 188.94 November 2007 218.35 164.58 202.08 184.96 December 2007 213.20 162.59 200.44 180.69 January 2008 207.95 160.31 198.29 175.96 February 2008 203.39 158.52 196.51 172.20 March 2008 201.32 158.68 194.73 169.98 April 2008 199.27 160.34 194.22 168.60 May 2008 197.61 162.31 194.74 167.78 June 2008
  • 4. Shiller's Housing Indices - Northeast NYC Overall 01272009 195.44 162.58 193.71 166.36 July 2008 194.15 162.75 193.49 164.65 August 2008 189.99 160.98 191.65 161.64 September 2008 184.92 159.17 189.79 158.12 October 2008 180.50 155.03 186.81 154.59 November 2008 December 2008