SlideShare una empresa de Scribd logo
1 de 95
Descargar para leer sin conexión
Cirrus HD-OCT

■ Models 400, 4000

User Manual
Introduction 1-7
Cirrus HD-OCT System Hardware
With the exception of the keyboard, mouse and printer, the Cirrus HD-OCT integrates all
hardware components in a unit, which includes the scan acquisition optics, the
interferometer and spectrometer, the system computer and video monitor. Carl Zeiss
Meditec offers an optional wheelchair accessible motorized power table (shown below),
which accommodates elevation adjustment to each patient's height. The illustration below
labels hardware elements. System specifications are in Chapter (12).

5
6

4
3

7

2
1

8

10
12

13

9

11

Figure 1-1 Cirrus HD-OCT system hardware

1

3D Motorized Patient Alignment Unit

8

Media/USB Port

2

Dual Chin Rest with Automatic Right/Left Sensors

9

Table Height Controls

3

Imaging Aperture

10 Mouse

4

Head Rest

11 Keyboard

5

Port for External Fixation Arm

12

System Power Switch

6

Integrated Video Monitor

13

(Optional) Power Table

7

Connectors (USB, network, etc.) and labels under
rear cover

Cirrus HD-OCT User Manual

2660021146510 A
Acquire Scans 3-5
Add New Patient Tab
To add a new patient, click the Add New Patient tab and fill in at least the required
fields, which are indicated in bold type.

Figure 3-3 Add New Patient tab of the ID Patient Screen

Note: The date of birth must be entered in the correct format that matches your Windows
regional settings, and always appears this way in the software and printouts.
• If you want to enter additional information, click More and continue. The Patient Edit
dialog will appear. For details, see Edit Patient Record on page 8-15.
• A Patient ID is required for all patient files. No patient data can be saved without a
patient ID. If you choose not to assign an ID, you may click on Generate ID to have the
system create a unique ID automatically for this patient. Patient ID’s generated by
Cirrus all start with the prefix “CZMI”. Because a Patient ID is required for
DICOM-compliant import and export of patient data, the system also creates a unique
Patient ID when you export data for any patient that was created without a Patient ID
(under previous software versions).
• Entering Patient Refractive Error: You may enter the refractive error in spherical
equivalents for each eye on the patient demographic entry screen if desired. If you
have entered a refractive error for a patient, the instrument will automatically set the
focus based on this information when you advance to the acquisition screen. You may
not need to use the Auto Focus feature if you entered a refractive error. You may need
to use the focus arrows to manually adjust the focus for optimal clarity.
• The Cirrus HD-OCT instrument has two Normative Databases to which you may
compare your patient’s scanned data. The original database is called the Diversified
Database (see Appendices D, E, and F for more information). An additional database,
the Asian Normative Database (see Appendix G) is also available as a separately

Cirrus HD-OCT User Manual

2660021146510 A
Acquire Scans 3-9
• Anterior Segment Cube 512x128.
• 5 Line Raster: The original version of the 5 Line Raster with less resolution than the HD
5 Line Raster.
Before the patient puts his or her head in the chinrest, click to select the desired scan type
for either eye. The automated chinrest will go to the default position for the selected scan
type and eye. Proceed to Acquire Scan below.
Preparing the Patient for the Exam Experience
The patient’s exam experience with the Cirrus HD-OCT is normally brief and comfortable.
An experienced operator can acquire several scans from each eye in the space of 5-7
minutes. An exam usually requires the patient to look inside the imaging aperture for 1-3
minutes at a time for each eye, depending on the number of scans desired. The instrument
acquires most scans in about two seconds. The additional time is required to align the
patient before scanning and to optimize scan quality. The patient need not remain in the
head rest between scans since the operator can reposition the head rest as needed. Note
that the Cirrus HD-OCT is never to contact the patient's eye.
Note: It is not necessary for the patient to put their head on the chinrest until after the
desired scan type is selected. If you are using the Repeat Setup (see page 3-28) feature on
a patient, the patient must wait until the Repeat Setup function has been selected and the
chinrest motions are complete before placing their head in the chinrest. Reducing the
amount of time the patient spends in the chinrest improves patient comfort.
Optional Dilation of Patient’s Eye(s)
The minimum pupil size for Cirrus HD-OCT is 2mm. This can usually be achieved without
dilation. If dilation is performed on a subject for an exam, we recommend that dilation be
used on subsequent visits if quantitative comparisons will be made. Dilation should not
directly affect the quantitative measurements, but it may affect them indirectly by allowing
more variability in how the OCT beam enters the eye. Although such an effect should be
small, optimal repeatability will be achieved by imaging the patient in the same way at
every visit.
Select the Fixation Method
Cirrus HD-OCT provides for internal fixation as the default method. This method is preferred
for its reproducibility and ease of use. However, if the patient’s visual acuity in the subject
eye precludes internal fixation, you have the option of attaching and using the external
fixation device, which is a light-emitting diode on the end of an adjustable arm. Plug it into
the port on the top of the instrument, and position the arm manually in the desired
position.

Cirrus HD-OCT User Manual

2660021146510 A
3-10

Acquire Scans
What the Patient Sees

Model 4000 Instrument
Before scan acquisition, the patient looks into the imaging aperture and sees a green
star-shaped target against a black background. When scanning starts, the background
changes to a bright, flickering red, and the patient may see thin bright lines of light, which
is the scan beam moving across the field of view. Normally, the patient can look inside the
imaging aperture for several minutes at a time without discomfort or tiredness.
Note: Instruct the patient to look at the center of the green target, and not at the moving
lights (the scan beam).
Model 400 Instrument
Before scan acquisition, the patient looks into the imaging aperture and sees a green
star-shaped target against a black background. At the same time the patient will see thin
bright lines of light scrolling from the top of the screen to the bottom, which is the scan
beam moving across the field of view. Normally, the patient can look inside the imaging
aperture for several minutes at a time without discomfort or tiredness. When scan
acquisition starts, the patient may notice the thin, bright red lines of light scrolling more
slowly and in some cases at a different angle.
Note: Instruct the patient to look at the center of the green target, and not at the moving
lights (the scan beam).

Cirrus HD-OCT User Manual

2660021146510 A
Acquire Scans 3-11
Acquire Scan
When you select Acquire in the previous screen, the ACQUIRE SCREEN appears. The example
below shows a Optic Disc Cube 200x200 scan.
1

3

2

4

5

6

7

13

12

8
11
10
9

Figure 3-7 Sample Acquire Screen
1

Patient information

8

Scan display and controls

2

OD Scan List

9

Controls for Reset Scan, Target Placement, adjust 5 Line Raster scans, Focus, Video
and Overlay Transparency, Optimize and Capture Buttons

3

Click to select type

10 Click to drag fixation target or scan pattern

4

Current Eye indicator

11 Fundus Viewport with scan overlay and controls

5

OS Scan List

12

Iris Viewport and controls and Repeat setup

6

Menus

13

Click pupil center to align eye

7

User name

X, Y and Z Controls Explained
X, Y and Z refer to plane of motion.
X means left and right movement.
Y means up and down movement.
Z means forward and back movement.

All screen features are the same for all scan types, except that there will be one or five
viewports in the scan display for the HD 5 Line Raster scan. Beneath the scan list, the
screen is divided into three working areas:
• The iris viewport is at upper left, where you see a live video image of the iris and pupil.
You use this to center the scan beam through the pupil by clicking on the pupil center
and/or using the X-Y and Z controls to the right. (X means left and right; Y means up
and down; Z means forward and back.) The circular X-Y control is for centering the
pupil; it provides 8 directional options for moving the chinrest. The Z controls
(left-right arrows or mouse scroll wheel) help you to reach the proper working distance

Cirrus HD-OCT User Manual

2660021146510 A
Acquire Scans 3-13
You will begin to see an iris image once the patient is positioned in the chinrest (although
the image may be poorly resolved until properly focused). Alignment progresses through a
series of steps, although the order in which many of the steps are performed (and whether
they are repeated) will vary depending on the cooperativeness of the patient (e.g., whether
patients can fixate steadily at a requested location, opacity of their eye, etc.). In general,
the sequence of user steps for non-repeat visits is as follows.
Align Eye Using Iris Viewport
1. Adjust the region of the iris visible in the iris viewport. Typically, you will make coarse
adjustments using the X-Y controls (that move the chinrest) as needed until the pupil is
visible.
2. Focus the iris image using the controls to the right of the viewport. For focusing, you
will primarily use the Z controls. The mouse scroll wheel works well for fine
adjustments. Try to get the iris as clear as possible before proceeding to the next step.
X-Y Controls
Align

Z Controls
Focus

Centering target shows
path of scan beam

Click pupil center to align
Figure 3-8 Iris viewport

3. Center the pupil in the iris viewport by clicking the center of the pupil. (Clicking
anywhere in the iris viewport centers the field of view of the camera over the click
point). The centering target overlays the video image. It remains in the center of the
image and illustrates the path of the scan beam.
Note for the Model 4000 only: You may see a reflection of a rectangular band over the
pupil, as seen in Figure 3-8 above. This artifact has no significance.
Repeat Setup Button: The Repeat Setup
available if you
✐ saved from a previous visit the same scan typebutton is patient and eye. have
for this
Click
Repeat Setup to repeat the chinrest alignment and other parameters used
the last time you acquired this scan type on this patient and eye during a
previous visit. This should get you close to the correct alignment for the
current scan, although you still may have to make small adjustments. See
Repeating Scan Setup and Alignment on page 3-28.

Cirrus HD-OCT User Manual

2660021146510 A
3-14

Acquire Scans
Options and Reset buttons
The iris viewport area has a pair of buttons. The Options button
opens to additional
controls, which allow adjustment of the image settings for that viewport. These controls
alter contrast (left vertical slider), brightness and illumination (right vertical slider). The area
also has a Reset button
, which resets the chinrest position to default. The reset
button within the options screen resets the contrast, brightness, and illumination.
Place Scan Using Fundus Viewport
1. Focus fundus viewport: The Auto Focus button will attempt to compensate for the
patient’s refractive error by automatically changing the focus adjustment. This may
help clear up a dim fundus view and will also help clear up the fixation target for a
patient whose refractive error is considerable. In addition to improving the overall
focus, the Auto Focus feature will do an additional adjustment on the brightness and
contrast of the fundus image.
The focus arrows allow you to manually compensate for the patient’s refractive error.
Click the left arrow to add minus (-) power to compensate for myopic corrections;
click the right arrow for adding plus (+) to compensate for hyperopic corrections. Asking the patient if the fixation target has cleared up after making a focus adjustment
can help in some cases. When optimized, these focus settings will be retained and
can be used in the future via the Repeat Setup button.

Auto Focus
and
Z focus controls

Overlay Transparency
control for repeat
scans

Click and drag scan pattern and/or fixation target to adjust their placement.
Double-click on the point you wish to center. The fixation target moves accordingly.
Figure 3-9 Fundus viewport

Note: Ask the patient to hold their gaze and head steady during Auto Focus, as the
chinrest assembly moves during this procedure. After Auto Focus, it may be necessary to
check the Iris Viewport to ensure that the pupil is still centered. If the fundus viewport turns
dark following Auto Focus, center the pupil, click
, then click the Auto B/C button. If
additional brightness and contrast changes are necessary, use the appropriate slider
controls (page 3-15).

Cirrus HD-OCT User Manual

2660021146510 A
Acquire Scans 3-15

When you mouse over the fixation
target or the scan pattern, the
cursor becomes a hand or move
symbol, indicating that you can
click and drag to move it.

2. (Optional)–Adjust scan pattern placement: To do this, move the mouse so the cursor
hovers within the space of the scan pattern or the alignment target. The cursor will
turn into a move symbol. Hold the left mouse button down and drag the mouse to
control the position of the scan pattern box. Release the mouse button to set the scan
pattern in its new position. If the cursor hovers over the fixation target icon, the cursor
turns into a hand with a pointing finger. For the Model 400 instrument, when moving
the scan pattern box, the Live OCT Fundus technology view also moves with the scan
pattern box.
(Optional)–Adjust region of view: There are a number of ways to adjust the region of
the fundus image visible within the fundus viewport. You can change the patient’s
fixation by either double-clicking anywhere on the fundus image to bring that point
into the center of view, or click and drag the fixation target. In either case, instruct the
patient to follow the fixation target, which has the effect of changing the region of
view. It is desirable to center the area of interest in the field of view so that you always
are scanning the deepest part of the bowl of the retina, which helps maintain the scan
image in the vertical center of the display.
To reset either the scan pattern or the fixation target that had been moved from the
default position, press the appropriate button below:
•

Reset scan pattern

•

Reset fixation target

Note: If you adjust the scan pattern placement, check the OCT scan display at right to
make sure that the retinal images are not too high in the viewport. When the edges of scan
images are near the upper boundary, they tend to “fold over,” reflecting a “mirror image”
back into the viewport. If this occurs, or if the scan image is completely inverted, you must
adjust the image using the Optimize button or Center controls. See Optimize the Scan
Display on page 3-17.
Note: For Optic Disc Cube 200x200 scans, it is not necessary to precisely center the optic
disc in the scan image because the analysis algorithm can correctly place the Calculation
Circle around the optic disc even when it is not well centered. Though it is sufficient to keep
the optic disc within the outer dashed circle, it is best to center the scan on the optic disc
as well as possible.
Options and Reset buttons
The fundus viewport area has a pair of buttons. The Options button
opens to
additional controls, which allow adjustment of the image settings for that viewport. These
controls alter contrast (left vertical slider) and brightness (right vertical slider). An example
appears at the left for the fundus image. The area also has a Reset button
, which
resets the focus position to default. The reset button within the options screen resets the
contrast and brightness.
In addition to the contrast and brightness controls, the fundus image options window also
contains these features:

Cirrus HD-OCT User Manual

2660021146510 A
3-16

Acquire Scans
Select Auto B/C to have Cirrus automatically adjust the brightness and contrast levels
of the fundus image.
An optional Show Alignment checkbox is available among the Fundus Image options.
For either Macular Cube Scan, this checkbox toggles display of an alignment tool that
is locked in position relative to the scan pattern; the alignment tool moves when you
move the scan pattern and vice versa. This tool is designed to be placed over the optic
disc to assist in accurately repeating scan pattern placement for future scans of the
same eye. For macular scans, placing the alignment tool over the optic disc results in
the scan center being within 1 mm of the fovea for most patients. This tool is helpful
when the fovea is difficult to find in extreme edema, cataract, or floater situations. For
optic disc scans, the alignment tool is centered on the scan pattern and on by default.

Figure 3-10 Fundus images showing alignment tools: Macula and Optic Disc

Note for the Model 400 only:
The Live OCT FundusTM view can be seen in Figure 3-11. For patients with unsteady
fixation, you may change the rate in which the screen refreshes by right-clicking on the
image and selecting Rapid Refresh View. When moving the scan pattern box, the Live OCT
Fundus technology view also moves with the scan pattern box. You may also select Auto
B/C from the same right-mouse click menu as shown on the left.

Figure 3-11 Standard viewport on the Model 400

Cirrus HD-OCT User Manual

2660021146510 A
3-18

Acquire Scans
• Corneal opacities may be minimized by realignment of the pupil.
3. The OCT scan: To optimize signal strength for the best possible OCT images, follow
these guidelines:
• Center the OCT scan in the mid to upper part of the scan acquisition screen. Click
on Optimize or Center to aid in placement.
• The OCT B-scan should be complete in all windows without missing data.
• A tilted retina may be corrected for by moving the pupil alignment off-center to
allow for a more level OCT scan.
• Media opacities may be minimized by searching different pupil positions for the
brightest OCT image.
• Adjust the enhancement setting to achieve the brightest and clearest scan.
• Ask the patient to blink once before obtaining the scan. Patients with severe dry
eye should use artificial tears prior to scanning.
Obtaining Images Suitable for Advanced RPE Analysis
In order to detect sub-RPE illumination, Cirrus looks for contrast in a slab created below
the RPE. If the retinal tissue is captured too low in the axial field of view of the scan, then
the algorithm will not produce a good result, because there will not be enough sub-RPE
pixels to create good contrast. See the figure below for an example of a scan with sub-RPE
illumination, with the retina too low in the scan for acceptable detection of sub-RPE
illumination. If you obtain an image like this, it is best to retake the scan before running
Advanced RPE Analysis (see Chapter 4).

Figure 3-12 Example of Scan with Retina Too Low in Field

Capture the Image
Briefly review the scan windows as described in Criteria for Reviewing Good Quality
Cirrus HD-OCT Scans on page 3-27. Click Capture—or press Enter on the keyboard—
to capture the images. The REVIEW SCREEN appears automatically to display the captured
images.

Cirrus HD-OCT User Manual

2660021146510 A
Acquire Scans 3-19
Review Scan and Save or Try Again
Review the captured data to ensure it is of acceptable quality. See Review Screen on
page 3-22 and Criteria for Reviewing Good Quality Cirrus HD-OCT Scans on
page 3-27 for more information.
Note: Besides the observed image quality, an important element of acceptable quality is
the Signal Strength indicator, which should be 6 or higher.
Note: Signal strength and image quality can be significantly reduced when the imaging
aperture (the lens) is dirty or smudged. If you suspect this problem, follow the instructions
to clean The Imaging Aperture (page 11-6).
If the captured scan is of good quality, click Save and continue. (You will return to the
ACQUIRE SCREEN to acquire another scan, if desired.) If it is not, click Try Again to return to
the ACQUIRE SCREEN.
When you are finished acquiring scans, click Finish in the ACQUIRE SCREEN. You will return to
the ID PATIENT SCREEN.

Acquire Screen, HD 5 Line Raster
From the Acquire Screen, select scan type HD 5 Line Raster, as shown in Figure 3-13. The
operation of the HD 5 Line Raster scan is identical to the operation of the original 5 Line
Raster scan.
To access the HD Single Line scan, select the
button, which is located below the
fundus image at the bottom of Figure 3-13. Clicking this button will create the setting to
acquire the HD Single Line scan. The button can be used to toggle between the Single and
the 5 Line modes.

Figure 3-13 HD 5 Line Raster Acquire Screen

Cirrus HD-OCT User Manual

2660021146510 A
3-20

Acquire Scans
The toggle button remains available until the Single Line scan pattern is moved within the
acquisition window. To move the scan pattern and keep the toggle button active, toggle to
5 Line mode before moving the scan pattern, then switch back to Single Line mode. If you
move the Single Line pattern and want to switch back to 5 Line mode, use the scan pattern
settings button,
, to access full controls.
Note: By default, all screens associated with the HD 5 Line Raster and HD Single Line scans
display the scans in color. However, switch to black and white to assist in showing the
additional resolution gained by using the HD scans. Adjustments to brightness and
contrast as well as switching the scans to black and white images are available using the
existing menus.
Enhanced Depth Imaging (EDI)
Enhanced Depth Imaging is an optional mode for the HD 5 Line Raster scan pattern.
The signal to noise ratio in OCT scans varies across the axial range. The default Cirrus setup
is such that the best signal is obtained at the top portion of the scan. Enhanced Depth
Imaging allows you to change the acquisition settings for the HD 5 Line Raster so that the
best signal to noise ratio is obtained at the bottom of the B-scan. This allows you to obtain
an HD image that is optimized in the region that is of interest for a particular scan.
You can toggle between this scanning mode and the standard scanning mode while on the
acquisition screen. The scan will be optimized for the bottom half of the screen.

Cirrus HD-OCT User Manual

2660021146510 A
Acquire Scans 3-21
Acquire an HD 5 Line Raster Scan Using EDI Mode

Figure 3-14 Enhanced Depth Imaging Acquire Screen

1. Select the HD 5 Line Raster from the scan selections.
2. Align the iris image and focus the fundus.
3. Choose the length, distance, and angle of the scan desired using the icons located
under the LSO image.
4. Click the EDI button.
5. Adjust the scan by using the icons on the LSO screen image.
6. Center and enhance the OCT image until you have an acceptable scan fundus and
scan quality.
7. Click on the Capture button, review and Save.

Cirrus HD-OCT User Manual

2660021146510 A
Acquire Scans

3-22

Review Screen
After you acquire a scan, the REVIEW SCREEN appears. The REVIEW SCREEN format depends on
which scan type you have acquired.
Review Screen for Cube Scans

5

1

2
4

3

Figure 3-15 Review Screen for cube scans
1

Current X slice through front (fast B-scan)

2

Current Y slice through side (slow B-scan)

3

X slices through front and back (fast B-scans)

4

Fundus image with scan cube overlay

5

Frozen iris image

For cube scans, the REVIEW SCREEN presents the captured iris and fundus images, along with
an interactive multi-planar reformat (MPR), which enables you to view image
cross-sections through two dimensions. The exam protocol (ALL SCANS) appears at top
left, with the eye and name of the scan type below it. The example above is for a Macular
Cube 512x128.
• Signal Strength Indicator: This appears in the center near the top. It ranges from 0-10,
with 10 being maximum signal strength. When values are less than 6, the indicator
color is red (below acceptable threshold); when 6 or higher, the color is green
(acceptable). Click on the Information button for additional suggestions on how to
obtain better signal strength.
Note: The Signal Strength indicator applies to the scan as a whole.

Cirrus HD-OCT User Manual

2660021146510 A
Acquire Scans 3-23
• Overlay Options: You can select OCT (default) or None in the Overlay drop-down
menu. The OCT overlay is an en face OCT scan image of the scanned area. (En face,
from the French, means literally, “on the face;” that is, looking directly into the eye,
which is the same perspective as the fundus image.)
• Transparency Slider: The Transparency slider is present when the OCT overlay is
selected. Use the Transparency slider to adjust the transparency of the overlay. Default
is 0% transparency (opaque); 100% is fully transparent.
• Snap To Center Button: The Snap to Center button is present when the OCT overlay is
selected. Click Snap to Center to return the slice navigators (see below) to their default
central positions.

En Face Explained
En face, from the French, means
literally, “on the face;” that is,
looking directly into the eye,
which is the same perspective as
the fundus image.

Reviewing Image Data using Multi-Planar Reformat (MPR)
• The viewports are interactive: Click and drag the triangles or click on a scan viewport
and use the mouse scroll wheel to “move through” the active plane of the viewport;
you will see the resulting cross-sections update simultaneously in the other viewports.
This functionality enables you to quickly search through the data cube and stop when
you see an area of interest.
The upper left viewport shows the frozen iris image, while the lower left shows the
fundus image with the high definition en face scan image overlay that shows the area
scanned. Note that the Model 4000 instrument displays the LSO fundus image, while
the Model 400 instrument displays the captured Live OCT Fundus technology image.

Drag triangles on slice
navigators to change
currently displayed slices
Blue line & slice number
indicate current fast B-scan
(X slice) seen in
top scan viewport

Data Cube Orientation
Top of cube

Z

en face imag=
e

X
Front of cube =
fast B-scan plane
blue line
upper viewport

Side of cube =
slow B-scan plane
magenta line
middle viewport

Y

Magenta line & slice number indicate current
slow B-scan (Y slice) seen in middle scan viewport
Figure 3-16 Fundus Image with Overlay in Review Screen

The overlay also has two lines that are centered by default, called slice navigators. These
lines indicate the currently selected cross-sections (slices) seen in the upper two viewports
on the right. The horizontal blue line in the overlay corresponds to the top scan viewport,
which presents the fast B-scan. The vertical magenta line in the overlay corresponds to the
middle scan viewport, which presents the slow B-scan. You can drag these slice navigators
by the triangles on the edge to change the currently selected slices.
To better understand the perspectives, think of the data as a cube. The top and middle
(larger) viewports show the data in planes parallel to the front of the cube and the side of

Cirrus HD-OCT User Manual

2660021146510 A
Acquire Scans

3-24

the cube, respectively. The X slice parallel to the front of the cube (top viewport) is also
known as the fast B-scan because this is the direction in which each line of A-scans is
acquired extremely quickly (in milliseconds). (This is the direction of a horizontal line scan
in first-generation OCT.) The Y slice parallel to the side of the cube (middle viewport) is also
known as the slow B-can because this scan comprises a reformatting of vertically parallel
A-scans acquired in successive line scans. These re-combined lines are acquired relatively
slowly, one per line of horizontal A-scans, in comparison to the fast B-scans. The smaller,
bottom two scan viewports are static and show the front and back X slices of the cube.
Scan Display Left to Right Orientation
Left to Right Scan Display
Summarized
For horizontal scans, left equals
left and right equals right. For
vertical scans, left to right equals
bottom to top. For diagonal scans,
left takes precedence over bottom.

Cirrus always displays left to right scan images as follows:
• For horizontal scans, left of scan equals left of scan display and right of scan equals
right of scan display.
• For vertical scans, bottom of scan equals left of scan display and top of scan equals
right of scan display.
• For diagonal scans in 5 Line Raster, left takes precedence over bottom, so that left of
scan equals left of scan display and right of scan equals right of scan display.
Image Display Options During Review
Right-click on the fundus image, on its overlay, or on a scan image to access the image
display options seen in the menu at left, or a subset of them. A checkmark indicates when
an option is selected.
• Normal: Selected initially, clicking Normal exits other display-change modes, and
thereby fixes or freezes the changes you have made to that point.
• Reset: Resets the current display to default settings.
• Zoom: Gives access to the following options:
• Zoom/Unzoom (toggle)
• Rectangle: When selected, click and drag to
select a rectangular area to fill the screen.
• Continuous: When selected, click and drag up to increase the zoom; click and
drag down to decrease the zoom.
• Pan: This option is present only when the image is zoomed. When selected, click and
drag the image to view other parts of it.
• Full screen: Select to view the image in full screen.
also double-click
✐ Tip: You cana full-screen image toany image to open it
Double-click
return to normal view.

in full screen.

• Save image as...: Saves the current image on screen in the location you select.
• Brightness/Contrast: When selected, the brightness (B) and contrast (C) values appear
numerically on the image; moving the cursor horizontally changes the contrast (noise)
and vertically changes the brightness (OCT color range). They also work in
combination when you move the mouse diagonally.

Cirrus HD-OCT User Manual

2660021146510 A
Acquire Scans 3-25
Brightness and Contrast can be adjusted in two different screens during the
acquisition process: On the acquisition screen and on the review screen.
• Acquisition: When you enter the acquisition screen for the first time,
Brightness/Contrast for both fundus and OCT images are set to a default values.
These values may be adjusted manually or by Auto Focus and Auto B/C (fundus
viewport only), as desired.
Any user-initiated changes made on the acquisition screen become the new instrument
default settings, which are persistant for all new scans for all operators until the settings
are changed again.
• Brightness/Contrast values adjusted in scan review for both fundus and OCT
images are saved and later used when displaying those images during analysis.
Note: Cirrus may override adjusted extreme values that could compromise image
quality by saving default values. No further adjustments will be saved after the
user saves the scan; for example, adjustments made on an analysis screen will not
be saved.
• Auto/BC: Optimizes brightness and contrast settings of the fundus view.
Tip: You can switch between color and grayscale globally, for all viewports, by
selecting or deselecting Colored OCT in the Tools menu (or by pressing F9 on the
keyboard). Colored OCT is the default.
• Image Adjustment Tools: When you scroll over the upper right-hand corner of the
Fundus Viewport or the Scan Display, the following image adjustment tools appear:
Adjust Black Level: adjusts the lower limit of the intensity histogram,
allowing you to adjust the contrast in the displayed image.
Auto Brightness/Contrast
Reset

Note: Brightness/Contrast and Color adjustments apply simultaneously to all scan
viewports. For example, if you select Brightness/Contrast for one viewport, the brightness
and/or contrast changes every time you click and drag your mouse over that viewport, until
you select Normal.

Cirrus HD-OCT User Manual

2660021146510 A
Acquire Scans

3-26

Note: Between the fundus image and its overlay, Brightness/Contrast and Color operate
independently. Right-click on one or the other to apply such changes. Some options
function as a distinct display mode and that viewport or overlay remains in that mode until
you click Reset, Normal or select another mode. Selecting Normal does not reset the
viewport to its initial brightness and contrast settings. You must press Reset to return to the
original Brightness and Contrast settings.
Note: Additional right-click menu options are available when viewing saved images in
Analyze mode. See Image Display Options During Analysis on page 4-11 for
details.
Fundus Image, Overlay and Scan Image Options
Note: Not all display options apply to every kind of image, and in these cases they are not
available. For example, Movie does not apply to the fundus image or its overlay, since
these are single images. For more information on the Movie option, go to page 4-12.
Review Screen for HD 5 Line Raster Scan

Frozen Iris
Image

5 Line Scans–
Selected Scan
Larger
Fundus Image
with 5 Lines
Overlay

Figure 3-17 Review Screen for HD 5 Line Raster Scan

For the HD 5 Line Raster scan, the REVIEW SCREEN presents the frozen iris and fundus
images, along with all five lines of the scan. The exam protocol (ALL SCANS) appears at top
left, with the eye and name of the scan type below it. The upper left viewport shows the
frozen iris image, while the lower left shows the fundus image with a scan image overlay
that shows the placement of the 5 line scans with the currently selected line in blue. The
five viewports on the right show each of the line scans from top to bottom. The center

Cirrus HD-OCT User Manual

2660021146510 A
Acquire Scans 3-27
viewport (third line) is seen in larger view, by default. When you click any of the smaller
scan images, it becomes the largest so you can view it in more detail.
• Signal Strength Indicator: This appears in the center near the top. It ranges from 0-10,
with 10 being maximum signal strength. When values are less than 6, the indicator
color is red (below acceptable threshold); when 6 or higher, the color is green
(acceptable).
Note: The Signal Strength indicator applies to the scan as a whole.
Note: Signal strength and image quality can be significantly reduced when the imaging
aperture (the lens) is dirty or smudged. If you suspect this problem, follow the instructions
to clean The Imaging Aperture (page 11-6).
The applicable image display options are available—see Image Display Options
During Review on page 3-24 for details.
Review Screen, HD 5 Line Raster
Initially after scan acquisition, unenhanced line scans are shown in the viewports. The
enhanced scans appear a few seconds later. The enhancement process can be stopped at
any time in order to return to the acquisition screen by clicking on the Try Again button on
the Enhancing Image dialog box.
Review and Save or Try Again
The purpose of the REVIEW SCREEN is for you to evaluate the scan image quality, whereupon
you can either save the scan or delete it and try again:
• To save the scan, click Save (or press Enter on the keyboard). You will return to the
ACQUIRE SCREEN, where Cirrus marks the scan as complete with a checkmark on the
left, and puts a number on the right showing how many of that scan you have saved.
Or
• Click Try Again (or press the Esc key on the keyboard) to delete the captured images
and return to the ACQUIRE SCREEN to capture another scan using the same scan type.
• If you click Finish without saving first, a prompt will appear asking you if you want to
save before returning to the ACQUIRE SCREEN.
Criteria for Reviewing Good Quality Cirrus HD-OCT Scans
During scan review, use the following criteria to ensure that an image you have captured is
suitable.
1. The fundus image:
• The focus should be sharp and clear, preferably with good visibility of the
branching blood vessels.
• The scan overlay should be centered on the fovea or optic nerve head.
• The fundus image should have uniform illumination without dark corners.
• There should be few, if any, artifacts that may cast shadows on the OCT scan.

Cirrus HD-OCT User Manual

2660021146510 A
Acquire Scans

3-28

• The OCT en-face image should have minimal saccades and no saccades through
the area of interest (macula, for example).
2. The OCT scan image:
• OCT scan should be complete in all windows without missing data.
• Color density should be the same from end to end.
• Signal strength should be 6 or greater.
Repeating Scan Setup and Alignment
Cirrus HD-OCT contains automatic and manual functions to repeat scan setup and
alignment during follow-up patient visits. Auto Repeat and Repeat Setup are available if
you have saved the same scan type for a patient and eye on a previous visit. They repeat all
the relevant parameters from the previously acquired scan for the patient. The repeated
parameters include chinrest alignment, scan pattern and fixation target placement,
Enhance (polarization) and Center (z-alignment) settings, focus, brightness, contrast and
illumination settings.
Tools menu

Auto Repeat is a global setting available in the Tools menu. When enabled, the instrument
automatically adjusts the ocular lens and chinrest to the previous settings for the same
patient, eye, and acquisition function. These adjustments occur with the patients chin in or
out of the chinrest. It takes a few moments for the chinrest to move and all parameters to
be applied.
The Repeat Setup button
is available to manually apply the repeat parameters if
the Auto Repeat global option is not selected or not licensed. The button is enabled when
a scan pattern for an eye that was previously saved for the patient is selected. The
functionality when the button is selected is the same as when Auto Repeat is enabled.
Auto Repeat and Repeat Setup should get you close to the correct alignment for the
current scan, although you still may have to make small adjustments. Both options also
load the fundus image and scan pattern from the previous visit and display the previous
fundus image and scan pattern statically within the fundus viewport.
You cannot use Auto Repeat or Repeat Setup to repeat a scan you have saved today, nor to
repeat a scan type other than those currently selected. The Acquire Screen, HD 5 Line
Raster on page 3-19 offers these options, enabling you to select any previous scan of any
type to repeat.
Repeat Scan Alignment Using Saved Scan Overlay
When you use Repeat Scan, the previously saved OCT fundus image of the scan you wish
to repeat is overlaid in the scan pattern box on the live fundus image. This helps you to
align the previous scan to the one you are attempting to acquire. Click on the scan pattern
box to drag it to the desired position. The Transparency slider activates when you are
repeating a scan, so you can adjust the transparency of the opaque overlay and view the

Cirrus HD-OCT User Manual

2660021146510 A
Acquire Scans 3-29
correspondence of the underlying live fundus image with the saved overlay. You may need
to increase the overlay transparency to see the fixation target location.

Figure 3-18 Acquire Screen Displaying Overlay

The factory default setting for Auto Repeat is off. If you activate the Auto Repeat feature,
the system will automatically position the chinrest and ocular lens according to the
position used in the previous visit for the given scan type selected. Depending upon the
patient's current position, adjustments may need to be done to obtain optimal focus of the
LSO and OCT scan. When you switch to another scan type, the chinrest and ocular lens
position will move accordingly to align with the previous visit scan. This may require more
adjustments to obtain the correct patient position.
Auto Repeat can aid your workflow in the following situations:
• You perform only one type of scan per visit.
• You perform multiple scans and scan types but in different scan areas, for example
Macula Cube 512 x 128 followed by Optic Disc Cube 200x200.
• The patient is able to maintain head position between scans.
Auto Repeat may not be desirable for use in the following situations:
• You perform multiple scans using different scan types in the same scan area per visit,
for example: Macula Cube 512 x 128 followed by HD 5-line raster, or Macula Cube 512
x 128 followed by Macula Cube 200 x 200. In this instance, using settings from the
current visit is more efficient.
• The patient has difficulty or is unpredictable in maintaining head position. In this
instance, the repeat scan may be very different from the current position.
If you do not want the chinrest and ocular lens to move from the currently aligned position
when switching to another scan type, you have the following options:

Cirrus HD-OCT User Manual

2660021146510 A
3-30

Acquire Scans
• Leave the factory default setting of Auto Repeat off. The Repeat Setup button is
available if you want to use previous scan settings for any scan you wish to acquire.
• Turn off Auto Repeat prior to scan acquisition by deselecting Auto Repeat in the
Tools Menu.
• Turn off Auto Repeat after the initial chinrest and focus adjustments are in place, or
after acquiring the first scan, and prior to choosing the second scan. This will ensure
that the settings used for the first scan will be maintained.
Click on the Capture button to save the image.
Repeat Scan Function
When you reach the ACQUIRE SCREEN for any patient with previous scans in the Cirrus
database, the Repeat Scan... option becomes available in the Tools menu. Click Tools >
Repeat Scan... or press F6 on the keyboard to open the Repeat Scan dialog, where you can
select a scan to repeat.

Figure 3-19 Repeat Scan dialog

The REPEAT SCAN dialog lists all previous scans for this patient by exam date and eye and
shows the fundus image for the scan you select. This option allows you to select a scan
taken on the same day. This is especially useful when a scan had been taken away from the
central fixation area or if a patient had been scanned previously with a Macular Cube
200x200 scan but now will be scanned using the Macular Cube 512x128 scan. The
previous Macular Cube 200x200 scan can be used as reference in this manner whereas it
could not be referenced via the Repeat Setup button.
Click OK to return to the ACQUIRE SCREEN and apply the parameters of the scan you selected
to repeat. It takes a few moments for the chinrest to move and all parameters to be
applied. You can use the repeated parameters as a starting point for further adjustments
you may wish to make.

Cirrus HD-OCT User Manual

2660021146510 A
Analyze Scans: Macula 4-1
EQF=^å~äóòÉ=pÅ~åëW=j~Åìä~
Chapter Overview
This chapter explains how to use the macula analysis portion of Cirrus HD-OCT software.
Topics covered in this chapter include:
• Access Analysis, page 4-1
• Macular Thickness Analysis, page 4-3
• Macular Change Analysis, 4-13
• Advanced Visualization, 4-19
• Advanced RPE Analysis, page 4-24
• HD 5 Line Raster Analysis, page 4-31
• High Definition Image Analysis – 5 Line Raster, page 4-32
• Ganglion Cell OU Analysis, page 4-33
• Reports and Printing, page 4-37
Note: See Appendix D for information on the RNFL Normative Database. See Appendix F
for information on the Ganglion Cell Normative Database.

Access Analysis
To access analysis, click the Analyze button when it is active; it is active when a patient
record with saved exams is selected or is open. Usually you will access it after selecting a
patient from the ID PATIENT SCREEN. When you click the Analyze button, the ANALYZE SCREEN
appears (see Figure 4-11 on page 4-18). Initially it shows four columns near the top,
which list:
• the patient’s exams by date (left column), with the most recent exam date selected by
default;
• for the selected exam, the right eye OD scans (center left column) and left eye OS
scans (center right column) by scan type;
• the column on the right where you can select among available analyses for the
selected scan type, after you select a scan.
The image display portion of the screen is blank until you select a scan from the OD or OS
column and then select the desired analysis. Click to select any scan from the OD or OS list,
and click the corresponding analysis at the right. The images will appear in the image
screen below, after a few seconds.
The ANALYZE SCREEN enables you to view and measure anatomical structures depicted in the
scan images. Cirrus HD-OCT provides the following analyses for the macula:
• Macular Thickness Analysis for cube scans, page 4-3
• Advanced RPE Analysis for cube scans, page 4-24
• High Definition Image Analysis – 5 Line Raster, page 4-32
• Ganglion Cell OU Analysis, page 4-33

Cirrus HD-OCT User Manual

2660021146510 A
Analyze Scans: Macula

4-2

Analyze Screen Common Functionality
The following information applies to the ANALYZE SCREEN in general, independent of the
type of scan you are viewing.
•
Delete Scan button: Click the Delete Scan button to delete the currently
selected scan. A dialog will prompt you to confirm your choice, as shown on the left. If
a scan is not archived to DICOM Archive, you can delete the scan from the scan list, or
delete it after the analysis is loaded. This button is disabled if the scan is already
archived.
•

Print button: Click Print to initiate printing. You can print to paper, create a
PDF, or export a number of image types, including PDF, TIFF, and JPEG to name a few.
See Reports and Printing on page 4-37 for details.

•

Save Analysis button: Click Save Analysis to save the current analysis with the
changes currently applied. The next time you open this analysis on the same scan, the
saved analysis will appear initially. You can discard saved changes at any time and
return to the original analysis by using the Discard Changes button.

•

Discard Changes button: Click Discard Changes to reload the original
analysis, discarding all changes previously saved.

Scan Display Left to Right Orientation
Left to Right Scan Display
Summarized
For horizontal scans, left equals left
and right equals right. For vertical
scans, left to right equals bottom to
top. For diagonal scans, left takes
precedence over bottom.

Cirrus always displays left to right scan images as follows:
• For horizontal scans, left of scan equals left of scan display and right of scan equals
right of scan display.
• For vertical scans, bottom of scan equals left of scan display and top of scan equals
right of scan display.
• For diagonal scans in 5 Line Raster, left takes precedence over bottom, so that left of
scan equals left of scan display and right of scan equals right of scan display.
Retinal Layers Automatically Detected and Displayed
• Cube scan analyses incorporate an algorithm to automatically find and display the
inner limiting membrane (ILM) and the retinal pigment epithelium (RPE).
In the scan images, which are cross-sections (slices), the layers appear as colored
lines that trace the anatomical feature on which they are based. The ILM is represented by a white line, the RPE by a black line. These lines are also known as segmentation lines. These layers serve as the basis for the macular thickness and volume
measurements in the Macular Thickness Analysis (page 4-3). In the Macular
Thickness Analysis, the ILM and RPE layers are presented in their entirety as
three-dimensional surface maps.
•
Show/Hide Layers button: Click Layers to hide or show the colored lines
indicating the ILM and RPE layers

Cirrus HD-OCT User Manual

2660021146510 A
Analyze Scans: Macula 4-3
Macular Thickness Analysis
The Macular Thickness Analysis (MTA) provides interactive scan images as well as the
fundus image with scan cube overlay. To see this analysis after selecting a cube scan, select
Macular Thickness from the list on the right. The default screen, shown in displays:
• the identified fovea location.
• the fundus image with scanned cube overlay or colored thickness map.
• the ETDRS grid map with normative data.
• a table containing average thickness and volume measurements.
• a colored 3-D thickness map.
• 3-D surface maps of the ILM and RPE.
You may also manipulate the fovea location on this screen, which will update the data
table and the ETDRS grid thickness measurements.
1
12

2
3

11
10

5
4

9
6
7

8
Figure 4-1 The Analyze Screen for Macular Thickness
1

Exam (date), OD and OS scan lists for selected exam, analysis list

2

Slice through cube front

8

OCT fundus image

3

ILM to RPE Thickness Map

9

Average thickness and volume measurements

4

3-D Surface Maps

10 Normative Data Details

5

Anterior Layer (ILM)

11 Fundus image with scan cube overlay

6

Posterior Layer (RPE)

12 Color code for thickness overlays

Cirrus HD-OCT User Manual

7

Slice through cube side

2660021146510 A
Analyze Scans: Macula

4-4

3-D Surface Maps

ILM = inner limiting membrane
RPE = retinal pigment epithelium

Interactive three-dimensional (3-D) surface maps appear down the right side. The top map
displays the thickness between the ILM and RPE as a color coded three-dimensional
surface. The middle map shows the upper (anterior) of the two layers, the ILM. The lower
map shows the lower (posterior) of the two layers, the RPE.
• The surface maps are fully interactive. Click and drag to rotate a map in any direction
and thereby view it from any perspective. The maps include the same slice navigators
you are accustomed to seeing on the scan images and fundus overlay. As usual, you
can click and drag each line to change the currently selected slices and the
corresponding scan image updates immediately. You can double-click a map to view it
in full screen (or right-click and select Full screen). As in normal view, you can rotate
full screen maps in three dimensions.
initial

rotated clockwise and front
tipped down
rotated counterclockwise and
front tipped up slightly

from underneath, front
tipped backward
Figure 4-2 Same full screen 3-D surface map, showing rotated views

• Right-click display options for 3-D surface maps. Right-click on a 3-D surface map
to access the display options at left, which function as in other contexts. See on
page 4-11 for details.

Cirrus HD-OCT User Manual

2660021146510 A
Analyze Scans: Macula 4-5
Fundus Image Overlay Options

En Face Explained
En face, from the French, means
literally, “on the face;” that is,
looking directly into the eye,
which is the same perspective as
the fundus image.

By default, the fundus image overlay displays ILM - RPE, where you view on the fundus
image a corresponding (in terms of color) thickness representation from above (en face) as
appears on the contoured thickness map to the right. The drop-down menu below the
fundus image gives you the following options: None, ILM - RPE, OCT Fundus, and ETDRS
Position. Use the Transparency slider below the drop-down menu to adjust the
transparency of the overlay.
Numerical Average Thickness and Volume Measurements
The area at lower left presents average thickness and volume numerically.

ETDRS
Grid

Figure 4-3 Numerical average thickness and volume information

It includes a table with central subfield thickness for the central circle of the circular map
known as the ETDRS Grid, and total volume and overall average thickness for the
ILM - RPE tissue layer over the entire 6 x 6 mm square scanned area. The ETDRS Grid
shows overall average thickness in nine sectors. This circular map is composed of three
concentric circles with diameters of 1 mm, 3 mm and 6 mm, and except for the central
circle, is divided into superior, nasal, inferior and temporal quadrants. The central circle has
a radius of 500 micrometers (1 mm diameter). The OCT fundus image to the right shows
the surface of the area over which the individual thickness measurements were made that
contribute to the subfield averages.
FoveaFinderTM: Automatic Fovea Identification
This feature is active in the Macular Thickness Analysis and the Macular Change Analysis.
Cirrus identifies the fovea location automatically by looking for the reduced reflectivity
below the retina. When the analysis screen first comes up, the fovea location has been
determined and is indicated by the overlay position, the position of the slice navigators in
the cube, and on the 3-D surface maps. The ETDRS grid in Figure 4-3, shows the values,
in micrometers (μm), of the ILM-RPE thickness, calculated as described above. You can
change the position of the ETDRS grid. If you change it, the reported values also change.

Cirrus HD-OCT User Manual

2660021146510 A
4-6

Analyze Scans: Macula
The position of the fovea and the center of the ETDRS grid is shown below the grid. In the
example above, the fovea is located at the intersection of slice 253 and 64.
If Cirrus cannot identify a fovea in the scan, it reports: “Fovea not found.” In this case, the
center of the scan is used for the initial placement (position 256 and 64 for 512x128 scans
and position 100 and 100 for 200x200 scans). It is also possible for the algorithm to find a
depression in the reflectivity around the ILM that is not related to the fovea – in this case,
the reported fovea will be wrong. In both of these cases, the user can set the fovea
manually using the buttons described below. The most common pathologic conditions that
cause failure of the fovea-finding algorithm are those that cause the greatest disturbance
of the foveal architecture, such as AMD, other causes of macular edema, and proliferative
diabetic retinopathy. Epiretinal membranes and other vitreoretinal interface disorders
where the vitreoretinal interface becomes distorted can also cause the algorithm to fail.
If the fovea is very far from the center, the algorithm may fail to find it. In order to ensure
that the fovea is within a reasonable distance of the center, it helps to use the alignment
tool during acquisition (see Place Scan Using Fundus Viewport, on page 3-14 and
Options and Reset buttons on page 3-15). It also helps for subsequent visits to use
the Repeat Setup and Repeat Scan Alignment feature (see Acquire Screen, HD 5 Line
Raster on page 3-19 and Repeating Scan Setup and Alignment on page 3-28).
Working with Scan Cube Overlays
In the ILM-RPE overlay, the colors on the overlay correspond to the color-coded side bar
scale on the right. The colors denote retinal thickness in micrometers (μm).
When ETDRS Position is selected from the overlay menu, a small red circle appears
centered around the Cirrus-calculated fovea position. This calculated ETDRS Grid position
can be repositioned by clicking and dragging the circle using the mouse.

Cirrus HD-OCT User Manual

2660021146510 A
Analyze Scans: Macula 4-7
The thickness grid also moves in conjunction with the repositioning of the ETDRS Grid
position on the overlay, as shown in Figure 4-4.

ETDRS Grid
position
moved

Thickness
grid moves
in conjunction
with ETDRS
Grid
Figure 4-4 Thickness Grid Movement

Interactive function buttons for ETDRS include:
•
Snap slice navigators to ETDRS Grid center position: Moves the slice navigators
to the ETDRS Grid center position.
•
Reset ETDRS Grid: Moves the ETDRS Grid back to the Cirrus-calculated fovea
center location.
•
Set ETDRS Grid center to slice navigator position: Moves the ETDRS Grid center to
the center defined by the slice navigators position.
•
Snap to Center: Moves slice navigators to the center of the 6x6 mm square.
These tools can be used to establish a new ETDRS Grid position after adjusting the position
with the slice navigator in any of the various screen options. Also, as you adjust the ETDRS
Grid position, the thickness grid also reflects the new values associated with the new
setting. To save the new fovea position for future analysis, click on the Save button
in
the upper right-hand corner of the screen.
This interactive analysis screen gives you several options to view patient data. For example,
when you move one of the slice navigator bars and then select
, the thickness grid
reflects that change as the grid moves and the values change. Select
to move the
ETDRS Grid back to its original location. Select
to move the slice navigators to the
ETDRS Grid center.
Use the button tools to line up the slice navigators with ETDRS Grid position and vice versa.
For example, manually drag the ETDRS Grid to a new position on the overlay, then:
• Select
to center the slice navigators over the new ETDRS Grid position, as shown
on the left. Note that the thickness grid does not change location.

Cirrus HD-OCT User Manual

2660021146510 A
4-8

Analyze Scans: Macula
• Select
to reset the ETDRS Grid position to the original Cirrus-calculated position.
The slice navigators also move back to their original positions over the ETDRS Grid
position.
Now move the slice navigators to a new position, as shown in Figure 4-5. The ETDRS
Grid position does not change, nor does the thickness grid position.

Figure 4-5 No Movement of Thickness Grid

• Select
• Select
location.

to align the ETDRS Grid position with the slice navigators.
to move the ETDRS Grid and the slice navigators back to their original

Macula Normative Database
The Macular Thickness Analysis supports the clinician in identifying areas of the macula
that may be of clinical concern by comparing the measured macular thickness to
age-matched data in the Cirrus Macula Normative Database1. Normative data that is
age-matched to the patient appears when you perform a Macular Thickness analysis on
patients at least 18 years old. Data was not collected from subjects less than 18 years old.
The Normative Database uses a color code, as seen in the legend at left, to indicate the
normal distribution percentiles. The color code applies to the ETDRS grid average thickness
values and the data table (see Figure 4-5 above).
Among same-age individuals in the normal population, the percentiles apply to each
particular retinal thickness measurement as follows:
• The thickest 1% of measurements fall in the light red area. Measurements in light red
are considered outside normal limits. (light red > 99%, above normal limits).

1.

The Macula Normative Database is an optional feature that may not be available in all markets, and when available in a market,
may not be activated on all instruments. If you do not have this feature and want to purchase it, contact Carl Zeiss Meditec. In the
U.S.A., call 1-877-486-7473; outside the U.S.A., contact your local Carl Zeiss Meditec affiliate or distributor.

Cirrus HD-OCT User Manual

2660021146510 A
Analyze Scans: Macula 4-9
• The thickest 5% of measurements fall in the light yellow area or above (95% < light
yellow  99%, suspect above normal)
• 90% of measurements fall in the green area (5%  green  95%).
• The thinnest 5% of measurements fall in the yellow area or below (1%  yellow <
5%, suspect below normal).
• The thinnest 1% of measurements fall in the red area. Measurements in red are
considered below normal limits (red < 1%, below normal limits).
Note: Clinicians must exercise judgment in the interpretation of the macula normative
data. For any particular measurement, note that 2 out of 20 normal eyes (10%) will fall
either above or below green.
Interpretation of the 1st Percentile: Values color-coded as “1st percentile” are lower than
99% of the database sample, but may not extrapolate well to the general population with
less than 300 subjects in the reference database. Results falling in this region should be
interpreted with caution.
Interpretation of the 5th Percentile: Values color-coded as “5th percentile” are lower than
95% of the database sample. The 95% Confidence Interval on the 5th Percentile extends
from the 2.5th percentile to the 7.7th percentile of the normative database.
Information icons
displayed on the Analysis screen offer additional information about
the normative database limits. Hovering over the icon will display a tooltip, and clicking
the icon will create a printout of the additional information presented. See Normative
Data Details Report on page 4-41 for more information.
Additional Features in Macular Thickness Analysis

The buttons above appear from left to right in the Macular Thickness analysis. If you mouse
over the buttons, their function appears in the form of a tool tip. The following paragraphs
describe the additional features available on the Macular Thickness analysis screen:
High-Res Images button: A pair of high-definition scans are taken at the
beginning of each Macular Cube 512x128 and Macular Cube 200x200 scan. Select
this button to display these central X and Y slices in high resolution. These two slices
are composed of 1000 A-scans (for Macular Cube 200x200) or 1024 A-scans (for
Macular Cube 512x128). The system provides this feature to enhance resolution in the
central area of the scan, which corresponds to the center of the fixation target. The
EDTRS Grid will not change position when the High-Res Images button is selected.
These high-definition images may be enlarged to a full-screen view.
The slice navigators will be set to slice 256 and 64 with the Macular Cube 512x128 or
will be set to slice 100 and 100 with the Macular Cube 200x200 scan. To return to the
standard resolution scans, re-select the High-Res Images button or move either the X
or Y slice navigator to a different position.
Edit Layers1 button: Click Edit Layers to open the EDIT SEGMENTATION screen, as
shown in the following figure. Here you can edit the currently selected X and Y slice

Cirrus HD-OCT User Manual

2660021146510 A
Analyze Scans: Macula

4-10

placement on the ILM and RPE layers; Cirrus calculates thickness between these layers.

Figure 4-6 Edit Segmentation Dialog

This feature is especially useful in cases where the retina has structural anomalies or
pathology that may cause the algorithms to incorrectly trace the actual boundaries.
Click and drag the ILM line or the RPE line, shaping and placing it in the desired location by your mouse movement. You can draw and redraw the line or any portion of it
repeatedly, selecting any point on a line to start each successive drawing action.
Note that when you mouse over a line, it “pops,” or becomes thicker. The boundary
lines you trace will never break. However, they will not cross each other.
The buttons (shown at left) enable you to copy changes from one slice to the next
slice or to the prior slice
1

2

3

4

Buttons 1 and 4 allow you to move through the layers. Button 2 copies your changes
to the prior slice, and button 3 copies your changes to the next slice.
Your changes are not saved as part of the Macular Thickness analysis until you click
the Save button,
, on the ANALYZE SCREEN. Then they will persist with the analysis
until you re-edit the same layers and click Save again, or click Discard Changes,
, when viewing the edited analysis. The segmentation changes affect only the
specific X and Y slices you edit, but do take immediate effect in the 3D surface maps
and all other ILM to RPE thickness measurements.
Ruler button: Click Ruler and then click and drag in a scan image or the fundus image to draw a straight line that measures distance between the start and stop
points. The resulting measurement appears next to the line in micrometers.
• You can select and adjust the lines you draw: click and drag an endpoint to adjust
its placement (and the line length), or click and drag the middle of the line to
move it as a whole.
• Click Ruler again to create additional measurement lines.

1.

Edit Layers is an optional feature that may not be available in all markets, and when available in a market, may not be activated
on all instruments. If you do not have this feature and want to purchase it, contact Carl Zeiss Meditec. In the U.S.A., call
1-877-486-7473; outside the U.S.A., contact your local Carl Zeiss Meditec affiliate or distributor.

Cirrus HD-OCT User Manual

2660021146510 A
Analyze Scans: Macula 4-11
• These measurements are saved when you close the analysis. The changes will
appear on the Macular Thickness Analysis printout, but not in the Advanced RPE
Analysis.
Note: You may use the ruler tools with the high definition images.
Delete Measurements button: Click Delete to delete the currently selected
measurement lines. You can select lines in more than one image at a time. To deselect
a line, click anywhere on the same image but off the line.
Image Display Options During Analysis
Right-click on the fundus image, on its overlay, or on a scan image to access the image
display options seen in the menu at left, or a subset of them. A checkmark indicates when
an option is selected. (Right-click menu options are not available for 3D volume
renderings.)
• Normal: Selected initially, clicking Normal exits other display-change modes, and
thereby fixes or freezes the changes you have made to that point.
• Reset: Resets the current display to default settings.
• Zoom: Gives access to the following options:
• Unzoom: Unzooms the image.
• Rectangle: When selected, click and drag to
select a rectangular area to fill the screen.
• Continuous: When selected, click and drag up to increase the zoom; click and
drag down to decrease the zoom.
• Pan: This option is present only when the image is zoomed. When selected, click and
drag the image to view other parts of it.
• Full screen: Select to view the image in full screen.
to open them in full screen.
✐ Tip: You can aalso double-click most images normal view or click the Back
Double-click full-screen image to return to
button.
• Save image as...: Saves the current image on screen in the location you select. See the
Exporting/Saving to the Hard Drive below (page 4-12).
• Tag for print: Tags the current image for inclusion in a custom report printout. This
option is available only for Advanced Visualization. See Custom Print on page 4-54
for details.
• Movie: Changes the display to movie mode—movie controls will appear—so you can
view all slices in the current plane in succession as a movie. This option is available

Cirrus HD-OCT User Manual

2660021146510 A
4-12

Analyze Scans: Macula
only for OCT viewports. Movie is only available for Macular Thickness and Advanced
Visualization analyses.

Figure 4-7 Movie Controls

• Hide Slice Navigator: Hides the slice navigator, including the colored outline around
the image.
• Brightness/Contrast: When this feature is used, values
appear on the
image that reflect the numerical parameter values you select. Left-click the mouse and
hold while moving the mouse up and down changes the brightness; moving the
mouse left or right changes contrast. They also work in combination when you move
the mouse diagonally. To retain the settings for this session, right-click the image to
bring up the menu, then select Normal.
• Color: Selected by default; deselect to view in grayscale.
You can switch between color and grayscale globally, for all viewports,
✐ Tip:selecting or deselecting Colored OCT in the Tools menu (or by pressing
by
F9 on the keyboard). Colored OCT is the default.
• Save movie as...: Opens the Save As dialog so you can save the movie of the current
plane in video format. This option is available only for OCT viewports.
Note: When using the Zoom or Brightness/Contrast feature on the ONH and RNFL OU or
RNFL Thickness analysis screens (Chapter 5), do not click and drag the mouse inside the
circle on the fundus image; instead of expected results, this will cause the circle to move to
a different location on the image.
Exporting/Saving to the Hard Drive
Note: Do not export or save data—including images and movies—to the C: drive of a
Cirrus instrument, which includes the desktop. The Cirrus hard drive is partitioned into C:
and either a D: or an E: drive, and the C: drive is reserved for operating system and Cirrus
application files. The C: drive is relatively small and can be filled up quickly, which renders
the system unusable. The D: (or E:) drive is reserved for data and therefore is relatively
large. If you want to export or save data to the Cirrus hard drive, either locally or to a
connected Cirrus system on the network, select (a location in) the D: (or E:) drive as the
target.

Cirrus HD-OCT User Manual

2660021146510 A
Analyze Scans: Macula 4-13
Macular Change Analysis
Selecting the Macular Change Analysis1 (MCA) option allows you to compare two Macular
Cube 512x128 scans or two Macular Cube 200x200 scans side by side, as shown in Figure
4-8. The default is to compare the two most recent scan dates. The Cirrus automatically
registers the en face images from the two dates so that the images you see are
synchronized to show the equivalent location of the retina in each image. In addition, the
color-coded thickness maps for the two images, as well as the thickness difference map,
are displayed.
When automatic registration occurs, the current image (which appears on the right-hand
side) is aligned to the prior image (which appears on the left-hand side). Both the en face
image and the fundus image are compensated for the differences in scan locations during
acquisition. The registration process maps similar anatomical structures, such as blood
vessels, to each other to obtain the proper registration. Rotation of an image due to the
patient’s eye being rotated from one session to another is also accounted for in the
registration.
Areas of the current image that do not overlap with the prior image are not included in the
final registered image. This causes the thickness map on the right side and the fundus
image to display a black border around the outside edge(s) of each view. The size of the
border depends on how much the current image was shifted to align with the prior image.
In addition, the right-hand B-scan will show an incomplete view in the areas where data
was not acquired in both scans.
The ETDRS Grid position circle is automatically positioned over the fundus image of the
older scan data. You can adjust this position by clicking anywhere within the OCT scan
boundary, and dragging the ETDRS Grid to a new position. Thickness values are
automatically recalculated corresponding to the new ETDRS Grid position.
The Thickness Difference Map is seen at the far right of the display. It displays the thickness
differences between the two scan dates (current thickness minus prior thickness, in
micrometers) at each pixel location. The difference map has a different color scale to
represent the thickness change. This color map is indicated to the right. Warmer colors
indicate an increase in the thickness; cooler colors indicate a decrease in thickness. The
transparency slider beneath each overlay can be adjusted, as required, to enhance the
image.

1.

Macular Change Analysis is an optional feature that may not be available in all markets, and when available in a market, may not
be activated on all instruments. If you do not have this feature and want to purchase it, contact Carl Zeiss Meditec. In the U.S.A.,
call 1-877-486-7473; outside the U.S.A., contact your local Carl Zeiss Meditec affiliate or distributor.

Cirrus HD-OCT User Manual

2660021146510 A
Analyze Scans: Macula

4-14

1
6

2
3

7

4

5

8

Figure 4-8 Macular Change Analysis screen
1

Sync Lock

2

Foveal Target

3

Thickness Map

4

ETDRS Grid boundary (black circle)

5

OCT scan boundary (yellow square)

6

Thickness Difference Map

7

Thickness Map

8

Slider Navigator

ETDRS Grid Location
Default ETDRS Grid center
When you enter Macula Change Analysis, Cirrus loads the saved fovea for each exam. This
fovea location is determined by the last saved fovea location for that exam. Typically, this
will be the fovea that Cirrus found automatically. However, if you or another user change
the fovea location for the exam in the Macula Thickness Analysis, and save the analysis
result, then that is the fovea used in Macula Change Analysis.

Cirrus HD-OCT User Manual

2660021146510 A
Analyze Scans: Macula 4-15
1. When automatic registration is successful, or when manual registration is applied, the
initial location of the ETDRS Grid center for both loaded scans is determined by the
location of the fovea in the prior (left-hand) image. This is because successful
registration implies that each pixel in the current image maps directly to the same
pixel in the prior image. Thus, the foveas do not need to be independently identified.
2. When No Registration is applied, the initial location of the ETDRS grid center for both
scans is taken from the saved value for that scan.
Synchronized Data Review
When the images are synchronized, the analysis allows the user to manipulate the data on
one exam image, while the identical movements are tracked on the second exam for a side
by side comparison.
When the sync lock is selected,
, you can adjust the slice navigator or image slider
bar to simultaneously move through the images and view the data. If the sync is not
locked,
, adjustments to one overlay do not effect the other.
Adjusting the ETDRS Grid centers
You can adjust the position of the ETDRS Grid center. If Sync lock is on, you can make the
adjustment on either image, and it will be applied to the other image. If Sync lock is off,
you must adjust each center individually.
Registration Successful
The Registration Succeeded message along with the green flag indicate that the two
chosen images did register reliably. A red flag appears if the registration fails. This could be
caused by weak signal strength, poor alignment, opacities, large differences in the scan
areas or larger differences in retinal anatomy. When that occurs, you may attempt to use
Manual registration by selecting from the Registration dialog box or, if available, select
another image for comparison. In the Registration dialog box, you may also choose No
Registration.
Note: The indication for success or failure of the registration algorithm is based on a
cross-correlation metric computed from the two images after registration. A threshold is
used on this metric to make a binary decision of success or failure.

Cirrus HD-OCT User Manual

2660021146510 A
4-16

Analyze Scans: Macula
Registration Review
Registration between the two fundus images may be compared by selecting the
Registration Review button:
. The results are displayed on a pop-up screen, as shown
in Figure 4-9.

Figure 4-9 Registration between Fundus Images

In this screen, image 1 is the original image. Image 2 is the en face image from the most
recent visit that has been registered to Image 1. The bottom image is an overlay of the two
exams. The image slider allows you to adjust the view of the overlaid images: slide to the
left to view image 1, to the right for image 2. Black borders might be seen in Image 2. This
is the area of the second image that does not correspond to the first image when the two
images were registered to each other.
To manually adjust the registration, select the Manual Registration button. Select three to
five corresponding points on Image 1 and Image 2 by using the mouse click. See Figure
4-10. Place each point over an identifiable feature that appears in both scans that you
expect to be constant across scans. For example, a blood vessel bifurcation or a bend in a
blood vessel can be used.
Undo
buttons

Figure 4-10 Manual Registration

Cirrus HD-OCT User Manual

2660021146510 A
Analyze Scans: Macula 4-17
Select Review Registration to view your manually adjusted overlay. Use the slider above the
overlay, as needed, to change the transparency to see more of Image 1 or Image 2. By
moving the slider back and forth, you can see if blood vessels or other features from one
image align with the identical features in the other image. To return the registration to the
original setting, press the Reset Overlay button. If you are not satisfied with the positioning
of the points, click on the Undo button,
, to delete all points and then make new point
selections.
Darker areas on the lower registration screen occur where there is no data to compare. This
will occur when the data points selected create an offset of the images. To see the final
registered image, move the slider all the way to the right. This black border will also be
seen on the thickness map and the thickness difference map on the MCA screen. When
you are satisfied with the resulting overlay, select OK. To reset the values to the original
registration, click Cancel.
The XML export from the MACULAR CHANGE ANALYSIS screen is performed by clicking on the
XML Export button (shown on the left). For further details on XML export, see XML Export
in Chapter 9.

Cirrus HD-OCT User Manual

2660021146510 A
4-18

Analyze Scans: Macula
Macular Change Analysis – Manual Selection
When there are two or more scans taken on the same day, the most recent scan (the one
with the latest time stamp) is chosen as the default scan to be used in Macular Change
Analysis. Sometimes, this scan is not the best to use for comparison. The scan may not
have the best signal strength or the scan was taken in a position away from the center and,
therefore, would not be a good match. You are able to manually choose a different scan
using the manual selection process.
1. At the top of the Analysis screen, select the scan date and the scan you wish to use as
the more current scan (the scan information that will appear on the right side of the
screen).
2. Select Macular Change Analysis – Manual Selection from the far right column.
3. A list of eligible scans will appear in a dialog box (see Figure 4-11).
4. Click on the scan you wish to include in the MCA. A green check mark will appear next
to the scan.
5. Click on Next to proceed. The window will collapse and the scan you chose will
appear as the scan on the left-hand side of the MCA screen.
Note: You may not choose two scans from different visits from the manual selection
window. You may only select one scan in this way to use as the earlier of the two scans.

Figure 4-11 Macular Change Analysis–Manual Selection screen

Cirrus HD-OCT User Manual

2660021146510 A
Analyze Scans: Macula 4-19
Advanced Visualization
1

5

2

4

3

Figure 4-12 Advanced Visualization Analyze Screen
1

Z slice or slab through cube top

4
Top of cube
en face scan pl= Z
yellow scan lin ane
lower right view e
port

X slice through cube front

3

Data Cube Orientation

Exam (date), OD and OS scan lists for selected exam, analysis list

2

Y slice through cube side

5

Fundus image with scan cube overlay

The ANALYZE SCREEN for Advanced Visualization, Figure 4-12, presents an interactive
multi-planar reformat (MPR), which enables you to view image cross-sections through
X
three dimensions. The example above is for a Macular Cube 200x200. The upper left
Side of cube =
slow B-scan plane viewport shows the saved fundus image with an optional en face scan overlay. The other
magenta scan line
Front of cube =
lower left viewport three viewports show cross-sectional scan images in three planes. Thinking of the data as a
fast B-scan plane
cube, the viewports show the data in planes parallel to the side of the cube (Y plane, lower
blue scan line
Y
upper right viewport
left viewport), the front of the cube (X plane, upper right viewport) and the top of the cube
(Z plane, lower right viewport), as shown in Figure 4-12 and to the left. Multi-Planar
Reformat (MPR)
• The viewports are interactive: Click and drag the triangles or click on a scan viewport
and use the mouse scroll wheel to “move through” the active plane of the viewport;
En Face Explained
you will see the resulting cross-sections update simultaneously in the other viewports.
En face, from the French, means
This functionality enables you to quickly search through the data cube and stop when
literally, “on the face;” that is,
you see an area of interest.
looking directly into the eye,
which is the same perspective as
the fundus image.

Cirrus HD-OCT User Manual

2660021146510 A
Analyze Scans: Macula

4-20

Retinal Layers Automatically Detected and Displayed
• Cube scan analyses incorporate an algorithm to automatically find and display the
inner limiting membrane (ILM) and the retinal pigment epithelium (RPE). Cirrus also
calculates and presents a layer called RPEfit, which is a representation of a normal
parabolic RPE for this eye, based on the retina’s overall curvature. You can use the
RPEfit line to view variations from normal in the actual RPE contour.
In the scan images, which are cross-sections (slices), the layers appear as colored
lines that trace the anatomical feature on which they are based. The ILM is represented by a white line, the RPE by a black line, and the RPEFit line is magenta in
color. These lines are also known as segmentation lines. You can customize the colors
used to display each of these lines, as explained below. These layers serve as the basis
for the macular thickness and volume measurements in the Macular Thickness
Analysis (page 4-3). In the Macular Thickness Analysis, the ILM and RPE layers
are presented in their entirety as three-dimensional surface maps.

ILM = inner limiting membrane
RPE = retinal pigment epithelium

Fundus Image Overlay Options
• Use the Overlay drop-down menu to select which overlay to use on the fundus image:
None (default), Slice, OCT Fundus, Slab, ILM - RPE, ILM - RPEfit or RPE - RPEfit. The
slice and slab options correspond to the en face image in the lower right viewport.
(The options ILM, RPE and RPEfit are variations of the slab. See Slice and Slab
Options on page 4-21 page for a description.) You can adjust the associated
Transparency slider from 0% (opaque) to 100% (fully transparent). The OCT Fundus
option is the same overlay (en face) shown on the fundus image in the REVIEW SCREEN.

Cirrus HD-OCT User Manual

2660021146510 A
Analyze Scans: Macula 4-21
Slice and Slab Options
The lower right viewport, Figure 4-13, has a drop-down menu to select Slice
(default), Slab, ILM, RPE or RPEfit.

Figure 4-13 Analyze Screen showing a slab

When you select Slab, the other two scan viewports show two same-color dashed
lines separated by a small distance. This separation is the slab thickness, which you
can adjust in either of the other viewports by dragging the posterior line by its handle
on the edge. Dragging the anterior line handle moves both lines of the slab together
to reposition it in the scan image. The resulting slab image you see represents an
average signal intensity value for each A-scan location through the selected depth of
the slab.

ILM = inner limiting membrane
RPE = retinal pigment epithelium

• The drop-down options ILM, RPE and RPEfit are variations of the slab. When you
select any of these, you view the slab (of selected thickness—you can adjust it as
above) relative to the selected layer. For example, if you select ILM (Figure 4-13),
a dashed line of the same color as the ILM appears posterior to it, and the
resulting scan image appears in the lower right viewport (and in the scan cube
overlay when Slab is selected there). You cannot raise the lower dashed line above
the upper one, and the minimum separation is 2 micrometers.

Cirrus HD-OCT User Manual

2660021146510 A
4-22

Analyze Scans: Macula
Function Buttons in Advanced Visualization
The buttons shown on the left appear from left to right in the Advanced Visualization
analysis, above the scan images at right. If you mouse over them, their function appears in
the form of a tool tip.
•

Ruler button: Click Ruler and then click and drag in a scan image or the
fundus image to draw a straight line that measures distance between the start and
stop points. The resulting measurement appears next to the line in micrometers.
• You can select and adjust the lines you draw: click and drag an endpoint to adjust
its placement (and the line length), or click and drag the middle of the line to
move it as a whole.
• Click Ruler again to create additional measurement lines.
• These measurements are saved after you close the analysis and will appear on
reports (printouts) you make while they are present.
•

Delete Measurements button: Click Delete to delete the currently selected
measurement lines. You can select lines in more than one image at a time. To
deselect a line, click anywhere on the same image but off the line.

•

Show/Hide Layers button: Click Layers to hide or show the colored lines
indicating the layers (ILM, RPE and RPEfit).

•

Configure Layers button: Click Configure Layers to open the Layer Configuration
Dialog, Figure 4-14, where you can select the colors of the layers for ILM, RPE and
RPEfit, and whether to display them or not.

Figure 4-14 Layer Configuration Dialog and Color picker

• Click a Color button for ILM, RPE or RPE-fit to open a standard color picker, where
you can select a new color for that layer, or even define a custom color.
• The layers with their Display checkbox selected appear in scan images for
Advanced Visualization and Macular Thickness analyses for the scan you are
viewing. Click to select or clear Display checkboxes as desired.

Cirrus HD-OCT User Manual

2660021146510 A
Analyze Scans: Macula 4-23
Note: Switching to a different scan or leaving the Analysis screen causes the selected
segmentation colors to default to the original colors.
•

Center button: Click Center to return the current slices to their default central
positions.

•

Tagged Images button: Click the Tagged Images button to view and adjust
which images are tagged for custom printing. This button is active when one or more
images have been tagged for printing by selecting Tag for print from the right-click
menu. (See Custom Print on page 4-54 for details.)

The Advanced Visualization screen also uses the image display options available by using
the right mouse click. See Image Display Options During Analysis on page 4-11.
Note: Brightness/Contrast and Color adjustments apply simultaneously to all X, Y and Z
slices on screen (in OCT viewports or as the fundus overlay). If two Z slabs are on screen,
one as the fundus overlay and one in the lower right viewport, Brightness/Contrast and
Color adjustments made on either slab will apply to both. Between the fundus image and
its overlay, Brightness/Contrast and Color operate independently. Right-click on one or the
other to apply such changes. Some image display options function as a distinct display
mode and that viewport or overlay remains in that mode until you click Reset, Normal or
select another mode.
• For example, if you select Brightness/Contrast for one viewport, the brightness and/or
contrast changes every time you click and drag your mouse over that viewport, until
you select Normal or Reset. Note that selecting Normal would not reset the viewport
to its initial brightness and contrast settings.
Fundus Image, Overlay and Scan Image Options
Note: Not all display options apply to every kind of image, and in these cases they are not
available. For example, Movie does not apply to the fundus image or its overlay, since
these are single images. For the fundus overlay, the Brightness/Contrast and Color options
are available only for Slice and Slab, not for OCT Fundus nor for the calculated thickness
overlays (e.g., ILM-RPE). Another example is that Tag for print is available only in the
Advanced Visualization analysis.

Cirrus HD-OCT User Manual

2660021146510 A
4-24

Analyze Scans: Macula
Advanced RPE Analysis
The Advanced RPE Analysis allows you to examine the status of the RPE in more detail than
the Macular Thickness Analysis. In particular, Cirrus provides two algorithms, one to
identify and measure elevations in the RPE, and one to identify and measure areas of
sub-RPE illumination where the OCT beam is able to penetrate through to the choroid,
indicating that the RPE is atrophic. Maps based on each analysis, as well as a map that
integrates both analyses are presented to visualize these disturbances in the RPE, and
numerical results are provided to summarize them.
Within the Advanced RPE Analysis, there are two screens available for reviewing the
results. The first screen shows both the RPE elevation and the sub-RPE illumination results
separately as en face images. The second screen shows the integrated analysis along with
calculated values.
The RPE Advanced Analysis can be performed on both the Macula 512x128 and Macula
200x200 scan data.
Performing an Advanced RPE Analysis
To perform an analysis:
1. Select the scan you want to analyze.
2. Select Advanced RPE Analysis. For comparison, the best scan of the same type from
the most recent prior visit is selected by default. If you want to select a different scan
for comparison, select Advanced RPE Analysis - Manual Selection. If there is only data
from one visit, the prior area will be blank on the Advanced RPE Analysis and the
report.

Cirrus HD-OCT User Manual

2660021146510 A
Analyze Scans: Macula 4-25
Advanced RPE Analysis Screen 1

1
2

8

3
4

7

5

6
Figure 4-15 Advanced RPE Analysis - Screen 1
1

RPE Elevation Map overlaid on fundus image

2

Circles on the RPE Elevation Map centered on the fovea location

3

Transparency adjustment for RPE Elevation Map

4

Line from fovea connecting closest sub-RPE illumination area

5

Transparency control for Sub-RPE Slab overlaid on OCT Fundus image

6

Sub-RPE Slab with overlaid segmentation of Sub-RPE Illumination

7

Horizontal tomogram showing RPE Elevation segmentation line

8

Fovea location for exam shown above

RPE Elevation Map
The analysis displays an RPE Elevation Map as an overlay on the fundus image. The
transparency is preset, however you can adjust transparency on the analysis screen using
the control to the side (3 in Figure 4-15).
The pseudo-color aids in identifying bumps and discontinuities in the RPE. The map shows
circles corresponding to 3 mm and 5 mm in diameter centered on the fovea. On the side of
the map the legend shows how the colors correspond to the height of the elevations.

Cirrus HD-OCT User Manual

2660021146510 A
4-26

Analyze Scans: Macula
Note: The RPE elevation measurements can be affected by the presence, size, or extent of
geographic atrophy, choroidal neovascularization, extensive epiretinal membrane, or
vitreomacular traction. The user may evaluate the possible impact on the analysis by
reviewing the individual B-scans and determining if the areas of RPE elevation overlap with
these other pathologies.
As with all retinal pathology, the user is encouraged to check the retinal segmentation in
questionable cases. View the horizontal tomogram and check the black and lavender lines
indicating the borders of the RPE elevation measurement.
Note: The RPE Elevation algorithm was not tested on subjects who had geographic
atrophy, choroidal neovascularization, or pigment epithelial detachments. The
performance of the RPE Elevation algorithm on subjects with these conditions has not
been determined. Since pigment epithelial detachments are elevations to the RPE, the
Advanced RPE Analysis may be of clinical use. See Appendix G for the performance of
Advanced RPE Analysis measurements.
Note: Repeatability of measurements of RPE elevation are dependent on consistent and
accurate identification of the fovea location. The system has an automatic fovea finder. The
user should check that the software was able to find the fovea location and evaluate if the
location is correct. If the user determines that the location was not correct, the clinician
should manually correct it.
Note: The minimum RPE elevation that the software will include in the quantitative result is
19.5 μm. Drusen below this threshold are not included in the area and volume
calculations. In some cases, drusen may be observed in color fundus photographs that are
not seen in the Advanced RPE Analysis because either the drusen does not represent any
elevation, or because the drusen is accompanied by an elevation that does not meet the
minimum threshold for detection. Only small, shallow drusen are likely to be missed.
Note: RPE elevation measurements are not meant to replace other means of clinical
evaluation such as color fundus photographs for drusen documentation and measurement.
Note: The clinical utility of this feature in therapeutic dry AMD trials has yet to be
established.
Sub-RPE Slab
The Sub-RPE slab represents the summed reflectivity in the region below Bruch's
membrane. This slab indicates the fovea location with a dot and a circle corresponding to 5
mm in diameter centered on the fovea. It also shows a red line from the fovea to the
closest area with sub-RPE illumination (6 in Figure 4-15).
The Sub-RPE Slab is shown as an overlay on the OCT Fundus image. The transparency is
preset, however you can adjust transparency on the analysis screen using the control below
the slab (5 in Figure 4-15).

Cirrus HD-OCT User Manual

2660021146510 A
Analyze Scans: Macula 4-27
The automatic sub-RPE illumination segmentation is shown with an outline. The
boundaries can be toggled on or off. If the sub-RPE illumination segmentation outlines are
toggled on, these will become transparent to the same degree as the sub-RPE slab.
The Advanced RPE Analysis includes a horizontal tomogram. This tomogram shows the RPE
elevation segmentation lines, but not the segmentation lines for the sub-RPE slab
segmentation. The segmentation lines may be toggled on or off.
Note: Repeatability of measurements of sub-RPE illumination are dependent on consistent
and accurate identification of the fovea location. The system has an automatic fovea finder.
The user should check that the software was able to find the fovea location and evaluate if
the location is correct. If the user determines that the location was not correct, the clinician
should manually correct it.
Note: This feature was tested on subjects who had lesion diameters no smaller than 1.25
mm nor greater than 5 mm and who had no peripapillary atrophy or choroidal
neovascularization. The performance of the Advanced RPE Analysis on subjects who do not
meet these criteria has not been determined. See Appendix G for the performance of
Advanced RPE Analysis measurements.
Note: Increased sub-RPE illumination is not specific to geographic atrophy and can occur
in any condition that causes RPE atrophy or thinning, absence or breaks, such as retinal
dystrophies, scarring due to infections, and laser photocoagulation of the retina. In
addition, poor signal strength, pigmentation of the fundus, and peripapilliary atrophy can
occasionally cause misleading sub-RPE illumination findings.
Note: The clinical utility of this feature in therapeutic dry AMD trials has yet to be
established.

Cirrus HD-OCT User Manual

2660021146510 A
4-28

Analyze Scans: Macula
Sub-RPE Illumination Editing
To edit the sub-RPE illumination:
1. Open an edit screen by clicking on the Segmentation Tool (shown at left). The screen
displays the sub-RPE illumination segmentation as a colored region on the sub-RPE
slab. The current sub-RPE illumination segmentation becomes active for editing. The
edit screen also includes the OCT en face image with slice navigators and the
Horizontal B-Scan tied to the navigator position.

Slice
indicators

Figure 4-16 Edit Sub-RPE Segmentation Dialog

2. Use one of the available edit tools (shown clockwise at left) to modify the
segmentation boundaries:
• Pencil: click and drag to draw with fine detail.
• Floodfill: adds gross detail. To fill in a full lesion, draw the boundary of the lesion
with the pencil tool or the floodfill tool, click on the floodfill icon, and then click
on the lesion to fill it in.
• Eraser: removed gross detail. To remove a large area, draw the boundary of the
area with the knife or eraser, click on the eraser icon, then click on the area to
erase.
• Knife: click and drag to delete with fine detail.
3. Once you have completed editing, click on the Apply button to complete the operation
and return to the Analysis screen with the updated segmentation. On the analysis
screen, the segmentation is shown as an outline around the area that had been filled
in on the edit screen.
Note: You are able to edit the automatic sub-RPE illumination boundaries for the current
visit only. If you want to edit the segmentation for the prior visit, highlight the scan for the
prior visit and run the Advanced RPE Analysis. The prior visit then becomes the current
visit, and you can edit segmentation.

Cirrus HD-OCT User Manual

2660021146510 A
Analyze Scans: Macula 4-29
Advanced RPE Analysis Screen 2

Figure 4-17 Advanced RPE Analysis - Screen 2

The analysis includes an image that combines the RPE Elevation Map and the sub-RPE
illumination segmentation. The sub-RPE illumination segmentation is overlaid on the RPE
Elevation Map. The sub-RPE illumination segmentation is shown with an outline. This
image shows the fovea location with a dot marking and a circle corresponding to 3 mm
and 5 mm diameter circles centered on the fovea. This image is superimposed on top of the
fundus image.
• A caliper is available to measure distances on the RPE Profile Map. The measurements
made with this tool will not be saved.
Calculated values: The analysis includes the following values as well as a calculation of
current minus prior and percent change:
• Area of RPE elevations in 3 mm and 5 mm circle, with the unit of measure mm2
rounded up to one decimal place.
• Volume of RPE elevations in 3 mm and 5 mm circle, with the unit of measure mm3
rounded up to two decimal places.
• Area of sub-RPE illumination in 5 mm circle, with the unit of measure mm2 rounded
up to one decimal point. If no sub-RPE illumination is seen in the circle, the value
shown is 0.0.
• Distance measurement from nearest sub-RPE i llumination to fovea, with the unit of
measure mm identified and with values rounded up to one decimal place.
Note: The calculated difference does not consider test-retest variability.
The analysis and report indicate if the fovea has been found and the fovea location. If the
fovea was not found, the analysis will center the measurement circles within the 6mm

Cirrus HD-OCT User Manual

2660021146510 A
4-30

Analyze Scans: Macula
square. The user may edit the fovea location by clicking on the outer circle in the RPE
Elevation Map and dragging to the desired location. Or, the user may snap to the slice
navigator position.
A warning message will appear if the 5mm circle extends outside of the scan window.
A warning message will appear if the scan is too low in the B-Scan window.
Note: The Advanced RPE Analysis may occasionally identify RPE elevations or areas of
sub-RPE illumination in normal subjects. In a post-hoc analysis of 115 subjects from the
diversified normative database, the software identified RPE elevations in the 5 mm circle in
2.6% of the subjects, with a mean of 0.006 mm2 for area and 0.0002 mm3 for volume. In
the same analysis, the software identified areas of sub-RPE illumination in 6.1% of the
subjects, with a mean area of 0.08 mm2.
Note: Signal strength and image quality can be significantly reduced when the imaging
aperture (the lens) is dirty or smudged. If you suspect this problem, follow the instructions
to clean The Imaging Aperture (page 11-6).

Cirrus HD-OCT User Manual

2660021146510 A
Cirrus 6.0.2 user manual english dr.boonsong

Más contenido relacionado

La actualidad más candente

Keratoconus managment
Keratoconus managmentKeratoconus managment
Keratoconus managmentHasan Mokbel
 
Progressive addition lenses and brands
Progressive addition lenses and brandsProgressive addition lenses and brands
Progressive addition lenses and brandsAnurag Shukla
 
Contracted eye socket reconstruction
Contracted eye socket reconstructionContracted eye socket reconstruction
Contracted eye socket reconstructionMohammed Aljodah
 
Indirect ophthalmoscopy
Indirect ophthalmoscopy Indirect ophthalmoscopy
Indirect ophthalmoscopy Shruti Laddha
 
Lenses of slit lamp biomicroscope & indirect ophthalmoscope.
Lenses of slit lamp biomicroscope & indirect ophthalmoscope.Lenses of slit lamp biomicroscope & indirect ophthalmoscope.
Lenses of slit lamp biomicroscope & indirect ophthalmoscope.Ayat AbuJazar
 
A scan anu101 updated
A scan anu101 updatedA scan anu101 updated
A scan anu101 updatedAnurag Shukla
 
Pentacam analysis
Pentacam analysisPentacam analysis
Pentacam analysisNikhil Rp
 
Ocular surface disease
Ocular surface diseaseOcular surface disease
Ocular surface diseaseJessica Griego
 
Presbyopia & Accommodation.pptx
Presbyopia & Accommodation.pptxPresbyopia & Accommodation.pptx
Presbyopia & Accommodation.pptxSangita Sarma
 
Lens anatomy and physiology with clinical correlation
Lens anatomy and physiology with clinical correlationLens anatomy and physiology with clinical correlation
Lens anatomy and physiology with clinical correlationSrijana Lamichhane
 
Subjective methods of Refraction
Subjective methods of Refraction Subjective methods of Refraction
Subjective methods of Refraction Harsh Jain
 
A Scan- Basics and Update
A Scan- Basics and UpdateA Scan- Basics and Update
A Scan- Basics and UpdatePravin Bhat
 
A scan biometry | How to Use A-scan? Types of A-Scan Biometry?
A scan biometry | How to Use A-scan? Types of A-Scan Biometry?A scan biometry | How to Use A-scan? Types of A-Scan Biometry?
A scan biometry | How to Use A-scan? Types of A-Scan Biometry?Naeem Ahmad
 
Lenstar ls 900[1]
Lenstar ls 900[1]Lenstar ls 900[1]
Lenstar ls 900[1]nacho163
 

La actualidad más candente (20)

Keratoconus managment
Keratoconus managmentKeratoconus managment
Keratoconus managment
 
Progressive addition lenses and brands
Progressive addition lenses and brandsProgressive addition lenses and brands
Progressive addition lenses and brands
 
Contracted eye socket reconstruction
Contracted eye socket reconstructionContracted eye socket reconstruction
Contracted eye socket reconstruction
 
Indirect ophthalmoscopy
Indirect ophthalmoscopy Indirect ophthalmoscopy
Indirect ophthalmoscopy
 
Near point of convergence
Near point of convergenceNear point of convergence
Near point of convergence
 
Lenses of slit lamp biomicroscope & indirect ophthalmoscope.
Lenses of slit lamp biomicroscope & indirect ophthalmoscope.Lenses of slit lamp biomicroscope & indirect ophthalmoscope.
Lenses of slit lamp biomicroscope & indirect ophthalmoscope.
 
A scan anu101 updated
A scan anu101 updatedA scan anu101 updated
A scan anu101 updated
 
Pentacam analysis
Pentacam analysisPentacam analysis
Pentacam analysis
 
IOL Power Calculation in Normal Eyes
IOL Power Calculation in Normal EyesIOL Power Calculation in Normal Eyes
IOL Power Calculation in Normal Eyes
 
Ocular surface disease
Ocular surface diseaseOcular surface disease
Ocular surface disease
 
Orbital implants
Orbital implantsOrbital implants
Orbital implants
 
Presbyopia & Accommodation.pptx
Presbyopia & Accommodation.pptxPresbyopia & Accommodation.pptx
Presbyopia & Accommodation.pptx
 
Retinoscopy
RetinoscopyRetinoscopy
Retinoscopy
 
Lens anatomy and physiology with clinical correlation
Lens anatomy and physiology with clinical correlationLens anatomy and physiology with clinical correlation
Lens anatomy and physiology with clinical correlation
 
Subjective methods of Refraction
Subjective methods of Refraction Subjective methods of Refraction
Subjective methods of Refraction
 
Final oct
Final octFinal oct
Final oct
 
A Scan- Basics and Update
A Scan- Basics and UpdateA Scan- Basics and Update
A Scan- Basics and Update
 
A scan biometry | How to Use A-scan? Types of A-Scan Biometry?
A scan biometry | How to Use A-scan? Types of A-Scan Biometry?A scan biometry | How to Use A-scan? Types of A-Scan Biometry?
A scan biometry | How to Use A-scan? Types of A-Scan Biometry?
 
Binocular balance (review)
Binocular balance (review)Binocular balance (review)
Binocular balance (review)
 
Lenstar ls 900[1]
Lenstar ls 900[1]Lenstar ls 900[1]
Lenstar ls 900[1]
 

Destacado

Pages from cirrus 6.0.2 user manual english dr.boonsong 2
Pages from cirrus 6.0.2 user manual english dr.boonsong 2Pages from cirrus 6.0.2 user manual english dr.boonsong 2
Pages from cirrus 6.0.2 user manual english dr.boonsong 2Khwanying Monsiri
 
Spectralis oct normal anatomy & systematic interpretation.
Spectralis oct normal anatomy & systematic interpretation.Spectralis oct normal anatomy & systematic interpretation.
Spectralis oct normal anatomy & systematic interpretation.oxfordshireloc
 
City of Dharma Realm field research report
City of Dharma Realm field research reportCity of Dharma Realm field research report
City of Dharma Realm field research reportCortney Copeland
 
Conventions of music videos
Conventions of music videosConventions of music videos
Conventions of music videoshelkin
 
Collection development plan ngss
Collection development plan   ngssCollection development plan   ngss
Collection development plan ngssKim Kanofsky
 
Disaster recovery shouldn’t run on late nights and coffee alone
Disaster recovery shouldn’t run on late nights and coffee aloneDisaster recovery shouldn’t run on late nights and coffee alone
Disaster recovery shouldn’t run on late nights and coffee aloneJosh Mazgelis
 
Автоматизированное влияние на социальные факторы ранжирования
Автоматизированное влияние на социальные факторы ранжированияАвтоматизированное влияние на социальные факторы ранжирования
Автоматизированное влияние на социальные факторы ранжированияNikolay Khivrin
 
Target audience research on draft 1 of synopsis
Target audience research on draft 1 of synopsisTarget audience research on draft 1 of synopsis
Target audience research on draft 1 of synopsisChloe_ann07
 
Nhóm 1 kỹ sư vật lý
Nhóm 1 kỹ sư vật lýNhóm 1 kỹ sư vật lý
Nhóm 1 kỹ sư vật lýnhok_violet
 
Content analysis
Content analysisContent analysis
Content analysishelkin
 
Evaluation of audience research
Evaluation of audience researchEvaluation of audience research
Evaluation of audience researchhelkin
 
Target audience research objective iv done
Target audience research objective iv doneTarget audience research objective iv done
Target audience research objective iv doneChloe_ann07
 
Analysing a pop music video conventions (5sos)
Analysing a pop music video conventions (5sos)Analysing a pop music video conventions (5sos)
Analysing a pop music video conventions (5sos)helkin
 
English cat.
English cat.English cat.
English cat.chan2580
 
Piosenki patriotyczne
Piosenki patriotycznePiosenki patriotyczne
Piosenki patriotyczneLusia100
 

Destacado (20)

Pages from cirrus 6.0.2 user manual english dr.boonsong 2
Pages from cirrus 6.0.2 user manual english dr.boonsong 2Pages from cirrus 6.0.2 user manual english dr.boonsong 2
Pages from cirrus 6.0.2 user manual english dr.boonsong 2
 
OCT
OCTOCT
OCT
 
Spectralis oct normal anatomy & systematic interpretation.
Spectralis oct normal anatomy & systematic interpretation.Spectralis oct normal anatomy & systematic interpretation.
Spectralis oct normal anatomy & systematic interpretation.
 
Oct in glaucoma
Oct in glaucomaOct in glaucoma
Oct in glaucoma
 
City of Dharma Realm field research report
City of Dharma Realm field research reportCity of Dharma Realm field research report
City of Dharma Realm field research report
 
Conventions of music videos
Conventions of music videosConventions of music videos
Conventions of music videos
 
Collection development plan ngss
Collection development plan   ngssCollection development plan   ngss
Collection development plan ngss
 
Disaster recovery shouldn’t run on late nights and coffee alone
Disaster recovery shouldn’t run on late nights and coffee aloneDisaster recovery shouldn’t run on late nights and coffee alone
Disaster recovery shouldn’t run on late nights and coffee alone
 
Advertising campaigns
Advertising campaignsAdvertising campaigns
Advertising campaigns
 
Q2
Q2Q2
Q2
 
Автоматизированное влияние на социальные факторы ранжирования
Автоматизированное влияние на социальные факторы ранжированияАвтоматизированное влияние на социальные факторы ранжирования
Автоматизированное влияние на социальные факторы ранжирования
 
Target audience research on draft 1 of synopsis
Target audience research on draft 1 of synopsisTarget audience research on draft 1 of synopsis
Target audience research on draft 1 of synopsis
 
Fundamental activity
Fundamental activityFundamental activity
Fundamental activity
 
Nhóm 1 kỹ sư vật lý
Nhóm 1 kỹ sư vật lýNhóm 1 kỹ sư vật lý
Nhóm 1 kỹ sư vật lý
 
Content analysis
Content analysisContent analysis
Content analysis
 
Evaluation of audience research
Evaluation of audience researchEvaluation of audience research
Evaluation of audience research
 
Target audience research objective iv done
Target audience research objective iv doneTarget audience research objective iv done
Target audience research objective iv done
 
Analysing a pop music video conventions (5sos)
Analysing a pop music video conventions (5sos)Analysing a pop music video conventions (5sos)
Analysing a pop music video conventions (5sos)
 
English cat.
English cat.English cat.
English cat.
 
Piosenki patriotyczne
Piosenki patriotycznePiosenki patriotyczne
Piosenki patriotyczne
 

Similar a Cirrus 6.0.2 user manual english dr.boonsong

Minimal and Professional Startup Pitch Deck Presentation (1).pdf
Minimal and Professional Startup Pitch Deck Presentation (1).pdfMinimal and Professional Startup Pitch Deck Presentation (1).pdf
Minimal and Professional Startup Pitch Deck Presentation (1).pdfsakshi167333
 
Optovue iVue 510k Summary_TN
Optovue iVue 510k Summary_TNOptovue iVue 510k Summary_TN
Optovue iVue 510k Summary_TNTom Navarro, RAC
 
Digitech Ophthalmologist (Techlead Image Processing)
Digitech Ophthalmologist (Techlead Image Processing)Digitech Ophthalmologist (Techlead Image Processing)
Digitech Ophthalmologist (Techlead Image Processing)techlead-india
 
Logiq e9 xd clear 2.0
Logiq e9 xd clear 2.0 Logiq e9 xd clear 2.0
Logiq e9 xd clear 2.0 Madhuka Perera
 
Design of gaussian spatial filter to determine the amount of refraction error...
Design of gaussian spatial filter to determine the amount of refraction error...Design of gaussian spatial filter to determine the amount of refraction error...
Design of gaussian spatial filter to determine the amount of refraction error...eSAT Publishing House
 
Go 2 d3d ceph_cataloge
Go 2 d3d ceph_catalogeGo 2 d3d ceph_cataloge
Go 2 d3d ceph_catalogeYenDoan19
 
Eye sight determination on tablet based hand held device with image processin...
Eye sight determination on tablet based hand held device with image processin...Eye sight determination on tablet based hand held device with image processin...
Eye sight determination on tablet based hand held device with image processin...eSAT Publishing House
 
Panoura 18S with Ceph Operator Training Quick Guide
Panoura 18S with Ceph Operator Training Quick GuidePanoura 18S with Ceph Operator Training Quick Guide
Panoura 18S with Ceph Operator Training Quick GuideDon Vibbert
 
HS40_V1.05_GI_CE_220915_spread.pdf
HS40_V1.05_GI_CE_220915_spread.pdfHS40_V1.05_GI_CE_220915_spread.pdf
HS40_V1.05_GI_CE_220915_spread.pdfRevinaAmandha1
 
ZMPCZM019000.12.03 Chiro Scan User's guide
ZMPCZM019000.12.03 Chiro Scan User's guideZMPCZM019000.12.03 Chiro Scan User's guide
ZMPCZM019000.12.03 Chiro Scan User's guidePainezee Specialist
 
NEW GE Volusons in Stock! The E8 BT14 2014 and 2015 never used models at Reds...
NEW GE Volusons in Stock! The E8 BT14 2014 and 2015 never used models at Reds...NEW GE Volusons in Stock! The E8 BT14 2014 and 2015 never used models at Reds...
NEW GE Volusons in Stock! The E8 BT14 2014 and 2015 never used models at Reds...Keith Rubenstein
 
seminarppt-180313082529.pdf
seminarppt-180313082529.pdfseminarppt-180313082529.pdf
seminarppt-180313082529.pdfSathwika7
 

Similar a Cirrus 6.0.2 user manual english dr.boonsong (20)

Minimal and Professional Startup Pitch Deck Presentation (1).pdf
Minimal and Professional Startup Pitch Deck Presentation (1).pdfMinimal and Professional Startup Pitch Deck Presentation (1).pdf
Minimal and Professional Startup Pitch Deck Presentation (1).pdf
 
iScan80 brochure
iScan80 brochureiScan80 brochure
iScan80 brochure
 
Optovue iVue 510k Summary_TN
Optovue iVue 510k Summary_TNOptovue iVue 510k Summary_TN
Optovue iVue 510k Summary_TN
 
Digitech Ophthalmologist (Techlead Image Processing)
Digitech Ophthalmologist (Techlead Image Processing)Digitech Ophthalmologist (Techlead Image Processing)
Digitech Ophthalmologist (Techlead Image Processing)
 
GE Healthcare
GE HealthcareGE Healthcare
GE Healthcare
 
Logiq e9 xd clear 2.0
Logiq e9 xd clear 2.0 Logiq e9 xd clear 2.0
Logiq e9 xd clear 2.0
 
Optovue iSeries Brochure
Optovue iSeries BrochureOptovue iSeries Brochure
Optovue iSeries Brochure
 
Optis felipe hernández
Optis felipe hernándezOptis felipe hernández
Optis felipe hernández
 
Design of gaussian spatial filter to determine the amount of refraction error...
Design of gaussian spatial filter to determine the amount of refraction error...Design of gaussian spatial filter to determine the amount of refraction error...
Design of gaussian spatial filter to determine the amount of refraction error...
 
Go 2 d3d ceph_cataloge
Go 2 d3d ceph_catalogeGo 2 d3d ceph_cataloge
Go 2 d3d ceph_cataloge
 
Eyestar 900 brochure
Eyestar 900 brochureEyestar 900 brochure
Eyestar 900 brochure
 
HS-UK Octopus 900 Brochure
HS-UK Octopus 900 BrochureHS-UK Octopus 900 Brochure
HS-UK Octopus 900 Brochure
 
Eye sight determination on tablet based hand held device with image processin...
Eye sight determination on tablet based hand held device with image processin...Eye sight determination on tablet based hand held device with image processin...
Eye sight determination on tablet based hand held device with image processin...
 
Octopus 900 Brochure
Octopus 900 BrochureOctopus 900 Brochure
Octopus 900 Brochure
 
Panoura 18S with Ceph Operator Training Quick Guide
Panoura 18S with Ceph Operator Training Quick GuidePanoura 18S with Ceph Operator Training Quick Guide
Panoura 18S with Ceph Operator Training Quick Guide
 
HS40_V1.05_GI_CE_220915_spread.pdf
HS40_V1.05_GI_CE_220915_spread.pdfHS40_V1.05_GI_CE_220915_spread.pdf
HS40_V1.05_GI_CE_220915_spread.pdf
 
ZMPCZM019000.12.03 Chiro Scan User's guide
ZMPCZM019000.12.03 Chiro Scan User's guideZMPCZM019000.12.03 Chiro Scan User's guide
ZMPCZM019000.12.03 Chiro Scan User's guide
 
NEW GE Volusons in Stock! The E8 BT14 2014 and 2015 never used models at Reds...
NEW GE Volusons in Stock! The E8 BT14 2014 and 2015 never used models at Reds...NEW GE Volusons in Stock! The E8 BT14 2014 and 2015 never used models at Reds...
NEW GE Volusons in Stock! The E8 BT14 2014 and 2015 never used models at Reds...
 
seminarppt-180313082529.pdf
seminarppt-180313082529.pdfseminarppt-180313082529.pdf
seminarppt-180313082529.pdf
 
Solix brochure
Solix brochureSolix brochure
Solix brochure
 

Último

Arihant handbook biology for class 11 .pdf
Arihant handbook biology for class 11 .pdfArihant handbook biology for class 11 .pdf
Arihant handbook biology for class 11 .pdfchloefrazer622
 
Interactive Powerpoint_How to Master effective communication
Interactive Powerpoint_How to Master effective communicationInteractive Powerpoint_How to Master effective communication
Interactive Powerpoint_How to Master effective communicationnomboosow
 
BAG TECHNIQUE Bag technique-a tool making use of public health bag through wh...
BAG TECHNIQUE Bag technique-a tool making use of public health bag through wh...BAG TECHNIQUE Bag technique-a tool making use of public health bag through wh...
BAG TECHNIQUE Bag technique-a tool making use of public health bag through wh...Sapna Thakur
 
fourth grading exam for kindergarten in writing
fourth grading exam for kindergarten in writingfourth grading exam for kindergarten in writing
fourth grading exam for kindergarten in writingTeacherCyreneCayanan
 
social pharmacy d-pharm 1st year by Pragati K. Mahajan
social pharmacy d-pharm 1st year by Pragati K. Mahajansocial pharmacy d-pharm 1st year by Pragati K. Mahajan
social pharmacy d-pharm 1st year by Pragati K. Mahajanpragatimahajan3
 
Holdier Curriculum Vitae (April 2024).pdf
Holdier Curriculum Vitae (April 2024).pdfHoldier Curriculum Vitae (April 2024).pdf
Holdier Curriculum Vitae (April 2024).pdfagholdier
 
Nutritional Needs Presentation - HLTH 104
Nutritional Needs Presentation - HLTH 104Nutritional Needs Presentation - HLTH 104
Nutritional Needs Presentation - HLTH 104misteraugie
 
Accessible design: Minimum effort, maximum impact
Accessible design: Minimum effort, maximum impactAccessible design: Minimum effort, maximum impact
Accessible design: Minimum effort, maximum impactdawncurless
 
APM Welcome, APM North West Network Conference, Synergies Across Sectors
APM Welcome, APM North West Network Conference, Synergies Across SectorsAPM Welcome, APM North West Network Conference, Synergies Across Sectors
APM Welcome, APM North West Network Conference, Synergies Across SectorsAssociation for Project Management
 
General AI for Medical Educators April 2024
General AI for Medical Educators April 2024General AI for Medical Educators April 2024
General AI for Medical Educators April 2024Janet Corral
 
Measures of Central Tendency: Mean, Median and Mode
Measures of Central Tendency: Mean, Median and ModeMeasures of Central Tendency: Mean, Median and Mode
Measures of Central Tendency: Mean, Median and ModeThiyagu K
 
Z Score,T Score, Percential Rank and Box Plot Graph
Z Score,T Score, Percential Rank and Box Plot GraphZ Score,T Score, Percential Rank and Box Plot Graph
Z Score,T Score, Percential Rank and Box Plot GraphThiyagu K
 
Q4-W6-Restating Informational Text Grade 3
Q4-W6-Restating Informational Text Grade 3Q4-W6-Restating Informational Text Grade 3
Q4-W6-Restating Informational Text Grade 3JemimahLaneBuaron
 
Sanyam Choudhary Chemistry practical.pdf
Sanyam Choudhary Chemistry practical.pdfSanyam Choudhary Chemistry practical.pdf
Sanyam Choudhary Chemistry practical.pdfsanyamsingh5019
 
Grant Readiness 101 TechSoup and Remy Consulting
Grant Readiness 101 TechSoup and Remy ConsultingGrant Readiness 101 TechSoup and Remy Consulting
Grant Readiness 101 TechSoup and Remy ConsultingTechSoup
 
Kisan Call Centre - To harness potential of ICT in Agriculture by answer farm...
Kisan Call Centre - To harness potential of ICT in Agriculture by answer farm...Kisan Call Centre - To harness potential of ICT in Agriculture by answer farm...
Kisan Call Centre - To harness potential of ICT in Agriculture by answer farm...Krashi Coaching
 
Unit-IV- Pharma. Marketing Channels.pptx
Unit-IV- Pharma. Marketing Channels.pptxUnit-IV- Pharma. Marketing Channels.pptx
Unit-IV- Pharma. Marketing Channels.pptxVishalSingh1417
 

Último (20)

Arihant handbook biology for class 11 .pdf
Arihant handbook biology for class 11 .pdfArihant handbook biology for class 11 .pdf
Arihant handbook biology for class 11 .pdf
 
Interactive Powerpoint_How to Master effective communication
Interactive Powerpoint_How to Master effective communicationInteractive Powerpoint_How to Master effective communication
Interactive Powerpoint_How to Master effective communication
 
INDIA QUIZ 2024 RLAC DELHI UNIVERSITY.pptx
INDIA QUIZ 2024 RLAC DELHI UNIVERSITY.pptxINDIA QUIZ 2024 RLAC DELHI UNIVERSITY.pptx
INDIA QUIZ 2024 RLAC DELHI UNIVERSITY.pptx
 
BAG TECHNIQUE Bag technique-a tool making use of public health bag through wh...
BAG TECHNIQUE Bag technique-a tool making use of public health bag through wh...BAG TECHNIQUE Bag technique-a tool making use of public health bag through wh...
BAG TECHNIQUE Bag technique-a tool making use of public health bag through wh...
 
Código Creativo y Arte de Software | Unidad 1
Código Creativo y Arte de Software | Unidad 1Código Creativo y Arte de Software | Unidad 1
Código Creativo y Arte de Software | Unidad 1
 
fourth grading exam for kindergarten in writing
fourth grading exam for kindergarten in writingfourth grading exam for kindergarten in writing
fourth grading exam for kindergarten in writing
 
social pharmacy d-pharm 1st year by Pragati K. Mahajan
social pharmacy d-pharm 1st year by Pragati K. Mahajansocial pharmacy d-pharm 1st year by Pragati K. Mahajan
social pharmacy d-pharm 1st year by Pragati K. Mahajan
 
Holdier Curriculum Vitae (April 2024).pdf
Holdier Curriculum Vitae (April 2024).pdfHoldier Curriculum Vitae (April 2024).pdf
Holdier Curriculum Vitae (April 2024).pdf
 
Nutritional Needs Presentation - HLTH 104
Nutritional Needs Presentation - HLTH 104Nutritional Needs Presentation - HLTH 104
Nutritional Needs Presentation - HLTH 104
 
Accessible design: Minimum effort, maximum impact
Accessible design: Minimum effort, maximum impactAccessible design: Minimum effort, maximum impact
Accessible design: Minimum effort, maximum impact
 
APM Welcome, APM North West Network Conference, Synergies Across Sectors
APM Welcome, APM North West Network Conference, Synergies Across SectorsAPM Welcome, APM North West Network Conference, Synergies Across Sectors
APM Welcome, APM North West Network Conference, Synergies Across Sectors
 
General AI for Medical Educators April 2024
General AI for Medical Educators April 2024General AI for Medical Educators April 2024
General AI for Medical Educators April 2024
 
Measures of Central Tendency: Mean, Median and Mode
Measures of Central Tendency: Mean, Median and ModeMeasures of Central Tendency: Mean, Median and Mode
Measures of Central Tendency: Mean, Median and Mode
 
Z Score,T Score, Percential Rank and Box Plot Graph
Z Score,T Score, Percential Rank and Box Plot GraphZ Score,T Score, Percential Rank and Box Plot Graph
Z Score,T Score, Percential Rank and Box Plot Graph
 
Q4-W6-Restating Informational Text Grade 3
Q4-W6-Restating Informational Text Grade 3Q4-W6-Restating Informational Text Grade 3
Q4-W6-Restating Informational Text Grade 3
 
Sanyam Choudhary Chemistry practical.pdf
Sanyam Choudhary Chemistry practical.pdfSanyam Choudhary Chemistry practical.pdf
Sanyam Choudhary Chemistry practical.pdf
 
Mattingly "AI & Prompt Design: Structured Data, Assistants, & RAG"
Mattingly "AI & Prompt Design: Structured Data, Assistants, & RAG"Mattingly "AI & Prompt Design: Structured Data, Assistants, & RAG"
Mattingly "AI & Prompt Design: Structured Data, Assistants, & RAG"
 
Grant Readiness 101 TechSoup and Remy Consulting
Grant Readiness 101 TechSoup and Remy ConsultingGrant Readiness 101 TechSoup and Remy Consulting
Grant Readiness 101 TechSoup and Remy Consulting
 
Kisan Call Centre - To harness potential of ICT in Agriculture by answer farm...
Kisan Call Centre - To harness potential of ICT in Agriculture by answer farm...Kisan Call Centre - To harness potential of ICT in Agriculture by answer farm...
Kisan Call Centre - To harness potential of ICT in Agriculture by answer farm...
 
Unit-IV- Pharma. Marketing Channels.pptx
Unit-IV- Pharma. Marketing Channels.pptxUnit-IV- Pharma. Marketing Channels.pptx
Unit-IV- Pharma. Marketing Channels.pptx
 

Cirrus 6.0.2 user manual english dr.boonsong

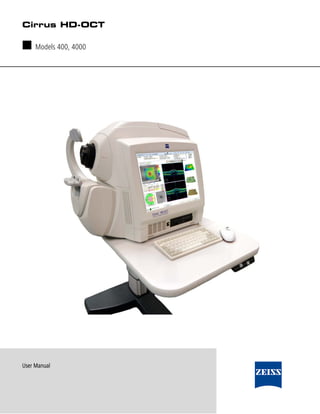
  • 1. Cirrus HD-OCT ■ Models 400, 4000 User Manual
  • 2. Introduction 1-7 Cirrus HD-OCT System Hardware With the exception of the keyboard, mouse and printer, the Cirrus HD-OCT integrates all hardware components in a unit, which includes the scan acquisition optics, the interferometer and spectrometer, the system computer and video monitor. Carl Zeiss Meditec offers an optional wheelchair accessible motorized power table (shown below), which accommodates elevation adjustment to each patient's height. The illustration below labels hardware elements. System specifications are in Chapter (12). 5 6 4 3 7 2 1 8 10 12 13 9 11 Figure 1-1 Cirrus HD-OCT system hardware 1 3D Motorized Patient Alignment Unit 8 Media/USB Port 2 Dual Chin Rest with Automatic Right/Left Sensors 9 Table Height Controls 3 Imaging Aperture 10 Mouse 4 Head Rest 11 Keyboard 5 Port for External Fixation Arm 12 System Power Switch 6 Integrated Video Monitor 13 (Optional) Power Table 7 Connectors (USB, network, etc.) and labels under rear cover Cirrus HD-OCT User Manual 2660021146510 A
  • 3. Acquire Scans 3-5 Add New Patient Tab To add a new patient, click the Add New Patient tab and fill in at least the required fields, which are indicated in bold type. Figure 3-3 Add New Patient tab of the ID Patient Screen Note: The date of birth must be entered in the correct format that matches your Windows regional settings, and always appears this way in the software and printouts. • If you want to enter additional information, click More and continue. The Patient Edit dialog will appear. For details, see Edit Patient Record on page 8-15. • A Patient ID is required for all patient files. No patient data can be saved without a patient ID. If you choose not to assign an ID, you may click on Generate ID to have the system create a unique ID automatically for this patient. Patient ID’s generated by Cirrus all start with the prefix “CZMI”. Because a Patient ID is required for DICOM-compliant import and export of patient data, the system also creates a unique Patient ID when you export data for any patient that was created without a Patient ID (under previous software versions). • Entering Patient Refractive Error: You may enter the refractive error in spherical equivalents for each eye on the patient demographic entry screen if desired. If you have entered a refractive error for a patient, the instrument will automatically set the focus based on this information when you advance to the acquisition screen. You may not need to use the Auto Focus feature if you entered a refractive error. You may need to use the focus arrows to manually adjust the focus for optimal clarity. • The Cirrus HD-OCT instrument has two Normative Databases to which you may compare your patient’s scanned data. The original database is called the Diversified Database (see Appendices D, E, and F for more information). An additional database, the Asian Normative Database (see Appendix G) is also available as a separately Cirrus HD-OCT User Manual 2660021146510 A
  • 4. Acquire Scans 3-9 • Anterior Segment Cube 512x128. • 5 Line Raster: The original version of the 5 Line Raster with less resolution than the HD 5 Line Raster. Before the patient puts his or her head in the chinrest, click to select the desired scan type for either eye. The automated chinrest will go to the default position for the selected scan type and eye. Proceed to Acquire Scan below. Preparing the Patient for the Exam Experience The patient’s exam experience with the Cirrus HD-OCT is normally brief and comfortable. An experienced operator can acquire several scans from each eye in the space of 5-7 minutes. An exam usually requires the patient to look inside the imaging aperture for 1-3 minutes at a time for each eye, depending on the number of scans desired. The instrument acquires most scans in about two seconds. The additional time is required to align the patient before scanning and to optimize scan quality. The patient need not remain in the head rest between scans since the operator can reposition the head rest as needed. Note that the Cirrus HD-OCT is never to contact the patient's eye. Note: It is not necessary for the patient to put their head on the chinrest until after the desired scan type is selected. If you are using the Repeat Setup (see page 3-28) feature on a patient, the patient must wait until the Repeat Setup function has been selected and the chinrest motions are complete before placing their head in the chinrest. Reducing the amount of time the patient spends in the chinrest improves patient comfort. Optional Dilation of Patient’s Eye(s) The minimum pupil size for Cirrus HD-OCT is 2mm. This can usually be achieved without dilation. If dilation is performed on a subject for an exam, we recommend that dilation be used on subsequent visits if quantitative comparisons will be made. Dilation should not directly affect the quantitative measurements, but it may affect them indirectly by allowing more variability in how the OCT beam enters the eye. Although such an effect should be small, optimal repeatability will be achieved by imaging the patient in the same way at every visit. Select the Fixation Method Cirrus HD-OCT provides for internal fixation as the default method. This method is preferred for its reproducibility and ease of use. However, if the patient’s visual acuity in the subject eye precludes internal fixation, you have the option of attaching and using the external fixation device, which is a light-emitting diode on the end of an adjustable arm. Plug it into the port on the top of the instrument, and position the arm manually in the desired position. Cirrus HD-OCT User Manual 2660021146510 A
  • 5. 3-10 Acquire Scans What the Patient Sees Model 4000 Instrument Before scan acquisition, the patient looks into the imaging aperture and sees a green star-shaped target against a black background. When scanning starts, the background changes to a bright, flickering red, and the patient may see thin bright lines of light, which is the scan beam moving across the field of view. Normally, the patient can look inside the imaging aperture for several minutes at a time without discomfort or tiredness. Note: Instruct the patient to look at the center of the green target, and not at the moving lights (the scan beam). Model 400 Instrument Before scan acquisition, the patient looks into the imaging aperture and sees a green star-shaped target against a black background. At the same time the patient will see thin bright lines of light scrolling from the top of the screen to the bottom, which is the scan beam moving across the field of view. Normally, the patient can look inside the imaging aperture for several minutes at a time without discomfort or tiredness. When scan acquisition starts, the patient may notice the thin, bright red lines of light scrolling more slowly and in some cases at a different angle. Note: Instruct the patient to look at the center of the green target, and not at the moving lights (the scan beam). Cirrus HD-OCT User Manual 2660021146510 A
  • 6. Acquire Scans 3-11 Acquire Scan When you select Acquire in the previous screen, the ACQUIRE SCREEN appears. The example below shows a Optic Disc Cube 200x200 scan. 1 3 2 4 5 6 7 13 12 8 11 10 9 Figure 3-7 Sample Acquire Screen 1 Patient information 8 Scan display and controls 2 OD Scan List 9 Controls for Reset Scan, Target Placement, adjust 5 Line Raster scans, Focus, Video and Overlay Transparency, Optimize and Capture Buttons 3 Click to select type 10 Click to drag fixation target or scan pattern 4 Current Eye indicator 11 Fundus Viewport with scan overlay and controls 5 OS Scan List 12 Iris Viewport and controls and Repeat setup 6 Menus 13 Click pupil center to align eye 7 User name X, Y and Z Controls Explained X, Y and Z refer to plane of motion. X means left and right movement. Y means up and down movement. Z means forward and back movement. All screen features are the same for all scan types, except that there will be one or five viewports in the scan display for the HD 5 Line Raster scan. Beneath the scan list, the screen is divided into three working areas: • The iris viewport is at upper left, where you see a live video image of the iris and pupil. You use this to center the scan beam through the pupil by clicking on the pupil center and/or using the X-Y and Z controls to the right. (X means left and right; Y means up and down; Z means forward and back.) The circular X-Y control is for centering the pupil; it provides 8 directional options for moving the chinrest. The Z controls (left-right arrows or mouse scroll wheel) help you to reach the proper working distance Cirrus HD-OCT User Manual 2660021146510 A
  • 7. Acquire Scans 3-13 You will begin to see an iris image once the patient is positioned in the chinrest (although the image may be poorly resolved until properly focused). Alignment progresses through a series of steps, although the order in which many of the steps are performed (and whether they are repeated) will vary depending on the cooperativeness of the patient (e.g., whether patients can fixate steadily at a requested location, opacity of their eye, etc.). In general, the sequence of user steps for non-repeat visits is as follows. Align Eye Using Iris Viewport 1. Adjust the region of the iris visible in the iris viewport. Typically, you will make coarse adjustments using the X-Y controls (that move the chinrest) as needed until the pupil is visible. 2. Focus the iris image using the controls to the right of the viewport. For focusing, you will primarily use the Z controls. The mouse scroll wheel works well for fine adjustments. Try to get the iris as clear as possible before proceeding to the next step. X-Y Controls Align Z Controls Focus Centering target shows path of scan beam Click pupil center to align Figure 3-8 Iris viewport 3. Center the pupil in the iris viewport by clicking the center of the pupil. (Clicking anywhere in the iris viewport centers the field of view of the camera over the click point). The centering target overlays the video image. It remains in the center of the image and illustrates the path of the scan beam. Note for the Model 4000 only: You may see a reflection of a rectangular band over the pupil, as seen in Figure 3-8 above. This artifact has no significance. Repeat Setup Button: The Repeat Setup available if you ✐ saved from a previous visit the same scan typebutton is patient and eye. have for this Click Repeat Setup to repeat the chinrest alignment and other parameters used the last time you acquired this scan type on this patient and eye during a previous visit. This should get you close to the correct alignment for the current scan, although you still may have to make small adjustments. See Repeating Scan Setup and Alignment on page 3-28. Cirrus HD-OCT User Manual 2660021146510 A
  • 8. 3-14 Acquire Scans Options and Reset buttons The iris viewport area has a pair of buttons. The Options button opens to additional controls, which allow adjustment of the image settings for that viewport. These controls alter contrast (left vertical slider), brightness and illumination (right vertical slider). The area also has a Reset button , which resets the chinrest position to default. The reset button within the options screen resets the contrast, brightness, and illumination. Place Scan Using Fundus Viewport 1. Focus fundus viewport: The Auto Focus button will attempt to compensate for the patient’s refractive error by automatically changing the focus adjustment. This may help clear up a dim fundus view and will also help clear up the fixation target for a patient whose refractive error is considerable. In addition to improving the overall focus, the Auto Focus feature will do an additional adjustment on the brightness and contrast of the fundus image. The focus arrows allow you to manually compensate for the patient’s refractive error. Click the left arrow to add minus (-) power to compensate for myopic corrections; click the right arrow for adding plus (+) to compensate for hyperopic corrections. Asking the patient if the fixation target has cleared up after making a focus adjustment can help in some cases. When optimized, these focus settings will be retained and can be used in the future via the Repeat Setup button. Auto Focus and Z focus controls Overlay Transparency control for repeat scans Click and drag scan pattern and/or fixation target to adjust their placement. Double-click on the point you wish to center. The fixation target moves accordingly. Figure 3-9 Fundus viewport Note: Ask the patient to hold their gaze and head steady during Auto Focus, as the chinrest assembly moves during this procedure. After Auto Focus, it may be necessary to check the Iris Viewport to ensure that the pupil is still centered. If the fundus viewport turns dark following Auto Focus, center the pupil, click , then click the Auto B/C button. If additional brightness and contrast changes are necessary, use the appropriate slider controls (page 3-15). Cirrus HD-OCT User Manual 2660021146510 A
  • 9. Acquire Scans 3-15 When you mouse over the fixation target or the scan pattern, the cursor becomes a hand or move symbol, indicating that you can click and drag to move it. 2. (Optional)–Adjust scan pattern placement: To do this, move the mouse so the cursor hovers within the space of the scan pattern or the alignment target. The cursor will turn into a move symbol. Hold the left mouse button down and drag the mouse to control the position of the scan pattern box. Release the mouse button to set the scan pattern in its new position. If the cursor hovers over the fixation target icon, the cursor turns into a hand with a pointing finger. For the Model 400 instrument, when moving the scan pattern box, the Live OCT Fundus technology view also moves with the scan pattern box. (Optional)–Adjust region of view: There are a number of ways to adjust the region of the fundus image visible within the fundus viewport. You can change the patient’s fixation by either double-clicking anywhere on the fundus image to bring that point into the center of view, or click and drag the fixation target. In either case, instruct the patient to follow the fixation target, which has the effect of changing the region of view. It is desirable to center the area of interest in the field of view so that you always are scanning the deepest part of the bowl of the retina, which helps maintain the scan image in the vertical center of the display. To reset either the scan pattern or the fixation target that had been moved from the default position, press the appropriate button below: • Reset scan pattern • Reset fixation target Note: If you adjust the scan pattern placement, check the OCT scan display at right to make sure that the retinal images are not too high in the viewport. When the edges of scan images are near the upper boundary, they tend to “fold over,” reflecting a “mirror image” back into the viewport. If this occurs, or if the scan image is completely inverted, you must adjust the image using the Optimize button or Center controls. See Optimize the Scan Display on page 3-17. Note: For Optic Disc Cube 200x200 scans, it is not necessary to precisely center the optic disc in the scan image because the analysis algorithm can correctly place the Calculation Circle around the optic disc even when it is not well centered. Though it is sufficient to keep the optic disc within the outer dashed circle, it is best to center the scan on the optic disc as well as possible. Options and Reset buttons The fundus viewport area has a pair of buttons. The Options button opens to additional controls, which allow adjustment of the image settings for that viewport. These controls alter contrast (left vertical slider) and brightness (right vertical slider). An example appears at the left for the fundus image. The area also has a Reset button , which resets the focus position to default. The reset button within the options screen resets the contrast and brightness. In addition to the contrast and brightness controls, the fundus image options window also contains these features: Cirrus HD-OCT User Manual 2660021146510 A
  • 10. 3-16 Acquire Scans Select Auto B/C to have Cirrus automatically adjust the brightness and contrast levels of the fundus image. An optional Show Alignment checkbox is available among the Fundus Image options. For either Macular Cube Scan, this checkbox toggles display of an alignment tool that is locked in position relative to the scan pattern; the alignment tool moves when you move the scan pattern and vice versa. This tool is designed to be placed over the optic disc to assist in accurately repeating scan pattern placement for future scans of the same eye. For macular scans, placing the alignment tool over the optic disc results in the scan center being within 1 mm of the fovea for most patients. This tool is helpful when the fovea is difficult to find in extreme edema, cataract, or floater situations. For optic disc scans, the alignment tool is centered on the scan pattern and on by default. Figure 3-10 Fundus images showing alignment tools: Macula and Optic Disc Note for the Model 400 only: The Live OCT FundusTM view can be seen in Figure 3-11. For patients with unsteady fixation, you may change the rate in which the screen refreshes by right-clicking on the image and selecting Rapid Refresh View. When moving the scan pattern box, the Live OCT Fundus technology view also moves with the scan pattern box. You may also select Auto B/C from the same right-mouse click menu as shown on the left. Figure 3-11 Standard viewport on the Model 400 Cirrus HD-OCT User Manual 2660021146510 A
  • 11. 3-18 Acquire Scans • Corneal opacities may be minimized by realignment of the pupil. 3. The OCT scan: To optimize signal strength for the best possible OCT images, follow these guidelines: • Center the OCT scan in the mid to upper part of the scan acquisition screen. Click on Optimize or Center to aid in placement. • The OCT B-scan should be complete in all windows without missing data. • A tilted retina may be corrected for by moving the pupil alignment off-center to allow for a more level OCT scan. • Media opacities may be minimized by searching different pupil positions for the brightest OCT image. • Adjust the enhancement setting to achieve the brightest and clearest scan. • Ask the patient to blink once before obtaining the scan. Patients with severe dry eye should use artificial tears prior to scanning. Obtaining Images Suitable for Advanced RPE Analysis In order to detect sub-RPE illumination, Cirrus looks for contrast in a slab created below the RPE. If the retinal tissue is captured too low in the axial field of view of the scan, then the algorithm will not produce a good result, because there will not be enough sub-RPE pixels to create good contrast. See the figure below for an example of a scan with sub-RPE illumination, with the retina too low in the scan for acceptable detection of sub-RPE illumination. If you obtain an image like this, it is best to retake the scan before running Advanced RPE Analysis (see Chapter 4). Figure 3-12 Example of Scan with Retina Too Low in Field Capture the Image Briefly review the scan windows as described in Criteria for Reviewing Good Quality Cirrus HD-OCT Scans on page 3-27. Click Capture—or press Enter on the keyboard— to capture the images. The REVIEW SCREEN appears automatically to display the captured images. Cirrus HD-OCT User Manual 2660021146510 A
  • 12. Acquire Scans 3-19 Review Scan and Save or Try Again Review the captured data to ensure it is of acceptable quality. See Review Screen on page 3-22 and Criteria for Reviewing Good Quality Cirrus HD-OCT Scans on page 3-27 for more information. Note: Besides the observed image quality, an important element of acceptable quality is the Signal Strength indicator, which should be 6 or higher. Note: Signal strength and image quality can be significantly reduced when the imaging aperture (the lens) is dirty or smudged. If you suspect this problem, follow the instructions to clean The Imaging Aperture (page 11-6). If the captured scan is of good quality, click Save and continue. (You will return to the ACQUIRE SCREEN to acquire another scan, if desired.) If it is not, click Try Again to return to the ACQUIRE SCREEN. When you are finished acquiring scans, click Finish in the ACQUIRE SCREEN. You will return to the ID PATIENT SCREEN. Acquire Screen, HD 5 Line Raster From the Acquire Screen, select scan type HD 5 Line Raster, as shown in Figure 3-13. The operation of the HD 5 Line Raster scan is identical to the operation of the original 5 Line Raster scan. To access the HD Single Line scan, select the button, which is located below the fundus image at the bottom of Figure 3-13. Clicking this button will create the setting to acquire the HD Single Line scan. The button can be used to toggle between the Single and the 5 Line modes. Figure 3-13 HD 5 Line Raster Acquire Screen Cirrus HD-OCT User Manual 2660021146510 A
  • 13. 3-20 Acquire Scans The toggle button remains available until the Single Line scan pattern is moved within the acquisition window. To move the scan pattern and keep the toggle button active, toggle to 5 Line mode before moving the scan pattern, then switch back to Single Line mode. If you move the Single Line pattern and want to switch back to 5 Line mode, use the scan pattern settings button, , to access full controls. Note: By default, all screens associated with the HD 5 Line Raster and HD Single Line scans display the scans in color. However, switch to black and white to assist in showing the additional resolution gained by using the HD scans. Adjustments to brightness and contrast as well as switching the scans to black and white images are available using the existing menus. Enhanced Depth Imaging (EDI) Enhanced Depth Imaging is an optional mode for the HD 5 Line Raster scan pattern. The signal to noise ratio in OCT scans varies across the axial range. The default Cirrus setup is such that the best signal is obtained at the top portion of the scan. Enhanced Depth Imaging allows you to change the acquisition settings for the HD 5 Line Raster so that the best signal to noise ratio is obtained at the bottom of the B-scan. This allows you to obtain an HD image that is optimized in the region that is of interest for a particular scan. You can toggle between this scanning mode and the standard scanning mode while on the acquisition screen. The scan will be optimized for the bottom half of the screen. Cirrus HD-OCT User Manual 2660021146510 A
  • 14. Acquire Scans 3-21 Acquire an HD 5 Line Raster Scan Using EDI Mode Figure 3-14 Enhanced Depth Imaging Acquire Screen 1. Select the HD 5 Line Raster from the scan selections. 2. Align the iris image and focus the fundus. 3. Choose the length, distance, and angle of the scan desired using the icons located under the LSO image. 4. Click the EDI button. 5. Adjust the scan by using the icons on the LSO screen image. 6. Center and enhance the OCT image until you have an acceptable scan fundus and scan quality. 7. Click on the Capture button, review and Save. Cirrus HD-OCT User Manual 2660021146510 A
  • 15. Acquire Scans 3-22 Review Screen After you acquire a scan, the REVIEW SCREEN appears. The REVIEW SCREEN format depends on which scan type you have acquired. Review Screen for Cube Scans 5 1 2 4 3 Figure 3-15 Review Screen for cube scans 1 Current X slice through front (fast B-scan) 2 Current Y slice through side (slow B-scan) 3 X slices through front and back (fast B-scans) 4 Fundus image with scan cube overlay 5 Frozen iris image For cube scans, the REVIEW SCREEN presents the captured iris and fundus images, along with an interactive multi-planar reformat (MPR), which enables you to view image cross-sections through two dimensions. The exam protocol (ALL SCANS) appears at top left, with the eye and name of the scan type below it. The example above is for a Macular Cube 512x128. • Signal Strength Indicator: This appears in the center near the top. It ranges from 0-10, with 10 being maximum signal strength. When values are less than 6, the indicator color is red (below acceptable threshold); when 6 or higher, the color is green (acceptable). Click on the Information button for additional suggestions on how to obtain better signal strength. Note: The Signal Strength indicator applies to the scan as a whole. Cirrus HD-OCT User Manual 2660021146510 A
  • 16. Acquire Scans 3-23 • Overlay Options: You can select OCT (default) or None in the Overlay drop-down menu. The OCT overlay is an en face OCT scan image of the scanned area. (En face, from the French, means literally, “on the face;” that is, looking directly into the eye, which is the same perspective as the fundus image.) • Transparency Slider: The Transparency slider is present when the OCT overlay is selected. Use the Transparency slider to adjust the transparency of the overlay. Default is 0% transparency (opaque); 100% is fully transparent. • Snap To Center Button: The Snap to Center button is present when the OCT overlay is selected. Click Snap to Center to return the slice navigators (see below) to their default central positions. En Face Explained En face, from the French, means literally, “on the face;” that is, looking directly into the eye, which is the same perspective as the fundus image. Reviewing Image Data using Multi-Planar Reformat (MPR) • The viewports are interactive: Click and drag the triangles or click on a scan viewport and use the mouse scroll wheel to “move through” the active plane of the viewport; you will see the resulting cross-sections update simultaneously in the other viewports. This functionality enables you to quickly search through the data cube and stop when you see an area of interest. The upper left viewport shows the frozen iris image, while the lower left shows the fundus image with the high definition en face scan image overlay that shows the area scanned. Note that the Model 4000 instrument displays the LSO fundus image, while the Model 400 instrument displays the captured Live OCT Fundus technology image. Drag triangles on slice navigators to change currently displayed slices Blue line & slice number indicate current fast B-scan (X slice) seen in top scan viewport Data Cube Orientation Top of cube Z en face imag= e X Front of cube = fast B-scan plane blue line upper viewport Side of cube = slow B-scan plane magenta line middle viewport Y Magenta line & slice number indicate current slow B-scan (Y slice) seen in middle scan viewport Figure 3-16 Fundus Image with Overlay in Review Screen The overlay also has two lines that are centered by default, called slice navigators. These lines indicate the currently selected cross-sections (slices) seen in the upper two viewports on the right. The horizontal blue line in the overlay corresponds to the top scan viewport, which presents the fast B-scan. The vertical magenta line in the overlay corresponds to the middle scan viewport, which presents the slow B-scan. You can drag these slice navigators by the triangles on the edge to change the currently selected slices. To better understand the perspectives, think of the data as a cube. The top and middle (larger) viewports show the data in planes parallel to the front of the cube and the side of Cirrus HD-OCT User Manual 2660021146510 A
  • 17. Acquire Scans 3-24 the cube, respectively. The X slice parallel to the front of the cube (top viewport) is also known as the fast B-scan because this is the direction in which each line of A-scans is acquired extremely quickly (in milliseconds). (This is the direction of a horizontal line scan in first-generation OCT.) The Y slice parallel to the side of the cube (middle viewport) is also known as the slow B-can because this scan comprises a reformatting of vertically parallel A-scans acquired in successive line scans. These re-combined lines are acquired relatively slowly, one per line of horizontal A-scans, in comparison to the fast B-scans. The smaller, bottom two scan viewports are static and show the front and back X slices of the cube. Scan Display Left to Right Orientation Left to Right Scan Display Summarized For horizontal scans, left equals left and right equals right. For vertical scans, left to right equals bottom to top. For diagonal scans, left takes precedence over bottom. Cirrus always displays left to right scan images as follows: • For horizontal scans, left of scan equals left of scan display and right of scan equals right of scan display. • For vertical scans, bottom of scan equals left of scan display and top of scan equals right of scan display. • For diagonal scans in 5 Line Raster, left takes precedence over bottom, so that left of scan equals left of scan display and right of scan equals right of scan display. Image Display Options During Review Right-click on the fundus image, on its overlay, or on a scan image to access the image display options seen in the menu at left, or a subset of them. A checkmark indicates when an option is selected. • Normal: Selected initially, clicking Normal exits other display-change modes, and thereby fixes or freezes the changes you have made to that point. • Reset: Resets the current display to default settings. • Zoom: Gives access to the following options: • Zoom/Unzoom (toggle) • Rectangle: When selected, click and drag to select a rectangular area to fill the screen. • Continuous: When selected, click and drag up to increase the zoom; click and drag down to decrease the zoom. • Pan: This option is present only when the image is zoomed. When selected, click and drag the image to view other parts of it. • Full screen: Select to view the image in full screen. also double-click ✐ Tip: You cana full-screen image toany image to open it Double-click return to normal view. in full screen. • Save image as...: Saves the current image on screen in the location you select. • Brightness/Contrast: When selected, the brightness (B) and contrast (C) values appear numerically on the image; moving the cursor horizontally changes the contrast (noise) and vertically changes the brightness (OCT color range). They also work in combination when you move the mouse diagonally. Cirrus HD-OCT User Manual 2660021146510 A
  • 18. Acquire Scans 3-25 Brightness and Contrast can be adjusted in two different screens during the acquisition process: On the acquisition screen and on the review screen. • Acquisition: When you enter the acquisition screen for the first time, Brightness/Contrast for both fundus and OCT images are set to a default values. These values may be adjusted manually or by Auto Focus and Auto B/C (fundus viewport only), as desired. Any user-initiated changes made on the acquisition screen become the new instrument default settings, which are persistant for all new scans for all operators until the settings are changed again. • Brightness/Contrast values adjusted in scan review for both fundus and OCT images are saved and later used when displaying those images during analysis. Note: Cirrus may override adjusted extreme values that could compromise image quality by saving default values. No further adjustments will be saved after the user saves the scan; for example, adjustments made on an analysis screen will not be saved. • Auto/BC: Optimizes brightness and contrast settings of the fundus view. Tip: You can switch between color and grayscale globally, for all viewports, by selecting or deselecting Colored OCT in the Tools menu (or by pressing F9 on the keyboard). Colored OCT is the default. • Image Adjustment Tools: When you scroll over the upper right-hand corner of the Fundus Viewport or the Scan Display, the following image adjustment tools appear: Adjust Black Level: adjusts the lower limit of the intensity histogram, allowing you to adjust the contrast in the displayed image. Auto Brightness/Contrast Reset Note: Brightness/Contrast and Color adjustments apply simultaneously to all scan viewports. For example, if you select Brightness/Contrast for one viewport, the brightness and/or contrast changes every time you click and drag your mouse over that viewport, until you select Normal. Cirrus HD-OCT User Manual 2660021146510 A
  • 19. Acquire Scans 3-26 Note: Between the fundus image and its overlay, Brightness/Contrast and Color operate independently. Right-click on one or the other to apply such changes. Some options function as a distinct display mode and that viewport or overlay remains in that mode until you click Reset, Normal or select another mode. Selecting Normal does not reset the viewport to its initial brightness and contrast settings. You must press Reset to return to the original Brightness and Contrast settings. Note: Additional right-click menu options are available when viewing saved images in Analyze mode. See Image Display Options During Analysis on page 4-11 for details. Fundus Image, Overlay and Scan Image Options Note: Not all display options apply to every kind of image, and in these cases they are not available. For example, Movie does not apply to the fundus image or its overlay, since these are single images. For more information on the Movie option, go to page 4-12. Review Screen for HD 5 Line Raster Scan Frozen Iris Image 5 Line Scans– Selected Scan Larger Fundus Image with 5 Lines Overlay Figure 3-17 Review Screen for HD 5 Line Raster Scan For the HD 5 Line Raster scan, the REVIEW SCREEN presents the frozen iris and fundus images, along with all five lines of the scan. The exam protocol (ALL SCANS) appears at top left, with the eye and name of the scan type below it. The upper left viewport shows the frozen iris image, while the lower left shows the fundus image with a scan image overlay that shows the placement of the 5 line scans with the currently selected line in blue. The five viewports on the right show each of the line scans from top to bottom. The center Cirrus HD-OCT User Manual 2660021146510 A
  • 20. Acquire Scans 3-27 viewport (third line) is seen in larger view, by default. When you click any of the smaller scan images, it becomes the largest so you can view it in more detail. • Signal Strength Indicator: This appears in the center near the top. It ranges from 0-10, with 10 being maximum signal strength. When values are less than 6, the indicator color is red (below acceptable threshold); when 6 or higher, the color is green (acceptable). Note: The Signal Strength indicator applies to the scan as a whole. Note: Signal strength and image quality can be significantly reduced when the imaging aperture (the lens) is dirty or smudged. If you suspect this problem, follow the instructions to clean The Imaging Aperture (page 11-6). The applicable image display options are available—see Image Display Options During Review on page 3-24 for details. Review Screen, HD 5 Line Raster Initially after scan acquisition, unenhanced line scans are shown in the viewports. The enhanced scans appear a few seconds later. The enhancement process can be stopped at any time in order to return to the acquisition screen by clicking on the Try Again button on the Enhancing Image dialog box. Review and Save or Try Again The purpose of the REVIEW SCREEN is for you to evaluate the scan image quality, whereupon you can either save the scan or delete it and try again: • To save the scan, click Save (or press Enter on the keyboard). You will return to the ACQUIRE SCREEN, where Cirrus marks the scan as complete with a checkmark on the left, and puts a number on the right showing how many of that scan you have saved. Or • Click Try Again (or press the Esc key on the keyboard) to delete the captured images and return to the ACQUIRE SCREEN to capture another scan using the same scan type. • If you click Finish without saving first, a prompt will appear asking you if you want to save before returning to the ACQUIRE SCREEN. Criteria for Reviewing Good Quality Cirrus HD-OCT Scans During scan review, use the following criteria to ensure that an image you have captured is suitable. 1. The fundus image: • The focus should be sharp and clear, preferably with good visibility of the branching blood vessels. • The scan overlay should be centered on the fovea or optic nerve head. • The fundus image should have uniform illumination without dark corners. • There should be few, if any, artifacts that may cast shadows on the OCT scan. Cirrus HD-OCT User Manual 2660021146510 A
  • 21. Acquire Scans 3-28 • The OCT en-face image should have minimal saccades and no saccades through the area of interest (macula, for example). 2. The OCT scan image: • OCT scan should be complete in all windows without missing data. • Color density should be the same from end to end. • Signal strength should be 6 or greater. Repeating Scan Setup and Alignment Cirrus HD-OCT contains automatic and manual functions to repeat scan setup and alignment during follow-up patient visits. Auto Repeat and Repeat Setup are available if you have saved the same scan type for a patient and eye on a previous visit. They repeat all the relevant parameters from the previously acquired scan for the patient. The repeated parameters include chinrest alignment, scan pattern and fixation target placement, Enhance (polarization) and Center (z-alignment) settings, focus, brightness, contrast and illumination settings. Tools menu Auto Repeat is a global setting available in the Tools menu. When enabled, the instrument automatically adjusts the ocular lens and chinrest to the previous settings for the same patient, eye, and acquisition function. These adjustments occur with the patients chin in or out of the chinrest. It takes a few moments for the chinrest to move and all parameters to be applied. The Repeat Setup button is available to manually apply the repeat parameters if the Auto Repeat global option is not selected or not licensed. The button is enabled when a scan pattern for an eye that was previously saved for the patient is selected. The functionality when the button is selected is the same as when Auto Repeat is enabled. Auto Repeat and Repeat Setup should get you close to the correct alignment for the current scan, although you still may have to make small adjustments. Both options also load the fundus image and scan pattern from the previous visit and display the previous fundus image and scan pattern statically within the fundus viewport. You cannot use Auto Repeat or Repeat Setup to repeat a scan you have saved today, nor to repeat a scan type other than those currently selected. The Acquire Screen, HD 5 Line Raster on page 3-19 offers these options, enabling you to select any previous scan of any type to repeat. Repeat Scan Alignment Using Saved Scan Overlay When you use Repeat Scan, the previously saved OCT fundus image of the scan you wish to repeat is overlaid in the scan pattern box on the live fundus image. This helps you to align the previous scan to the one you are attempting to acquire. Click on the scan pattern box to drag it to the desired position. The Transparency slider activates when you are repeating a scan, so you can adjust the transparency of the opaque overlay and view the Cirrus HD-OCT User Manual 2660021146510 A
  • 22. Acquire Scans 3-29 correspondence of the underlying live fundus image with the saved overlay. You may need to increase the overlay transparency to see the fixation target location. Figure 3-18 Acquire Screen Displaying Overlay The factory default setting for Auto Repeat is off. If you activate the Auto Repeat feature, the system will automatically position the chinrest and ocular lens according to the position used in the previous visit for the given scan type selected. Depending upon the patient's current position, adjustments may need to be done to obtain optimal focus of the LSO and OCT scan. When you switch to another scan type, the chinrest and ocular lens position will move accordingly to align with the previous visit scan. This may require more adjustments to obtain the correct patient position. Auto Repeat can aid your workflow in the following situations: • You perform only one type of scan per visit. • You perform multiple scans and scan types but in different scan areas, for example Macula Cube 512 x 128 followed by Optic Disc Cube 200x200. • The patient is able to maintain head position between scans. Auto Repeat may not be desirable for use in the following situations: • You perform multiple scans using different scan types in the same scan area per visit, for example: Macula Cube 512 x 128 followed by HD 5-line raster, or Macula Cube 512 x 128 followed by Macula Cube 200 x 200. In this instance, using settings from the current visit is more efficient. • The patient has difficulty or is unpredictable in maintaining head position. In this instance, the repeat scan may be very different from the current position. If you do not want the chinrest and ocular lens to move from the currently aligned position when switching to another scan type, you have the following options: Cirrus HD-OCT User Manual 2660021146510 A
  • 23. 3-30 Acquire Scans • Leave the factory default setting of Auto Repeat off. The Repeat Setup button is available if you want to use previous scan settings for any scan you wish to acquire. • Turn off Auto Repeat prior to scan acquisition by deselecting Auto Repeat in the Tools Menu. • Turn off Auto Repeat after the initial chinrest and focus adjustments are in place, or after acquiring the first scan, and prior to choosing the second scan. This will ensure that the settings used for the first scan will be maintained. Click on the Capture button to save the image. Repeat Scan Function When you reach the ACQUIRE SCREEN for any patient with previous scans in the Cirrus database, the Repeat Scan... option becomes available in the Tools menu. Click Tools > Repeat Scan... or press F6 on the keyboard to open the Repeat Scan dialog, where you can select a scan to repeat. Figure 3-19 Repeat Scan dialog The REPEAT SCAN dialog lists all previous scans for this patient by exam date and eye and shows the fundus image for the scan you select. This option allows you to select a scan taken on the same day. This is especially useful when a scan had been taken away from the central fixation area or if a patient had been scanned previously with a Macular Cube 200x200 scan but now will be scanned using the Macular Cube 512x128 scan. The previous Macular Cube 200x200 scan can be used as reference in this manner whereas it could not be referenced via the Repeat Setup button. Click OK to return to the ACQUIRE SCREEN and apply the parameters of the scan you selected to repeat. It takes a few moments for the chinrest to move and all parameters to be applied. You can use the repeated parameters as a starting point for further adjustments you may wish to make. Cirrus HD-OCT User Manual 2660021146510 A
  • 24. Analyze Scans: Macula 4-1 EQF=^å~äóòÉ=pÅ~åëW=j~Åìä~ Chapter Overview This chapter explains how to use the macula analysis portion of Cirrus HD-OCT software. Topics covered in this chapter include: • Access Analysis, page 4-1 • Macular Thickness Analysis, page 4-3 • Macular Change Analysis, 4-13 • Advanced Visualization, 4-19 • Advanced RPE Analysis, page 4-24 • HD 5 Line Raster Analysis, page 4-31 • High Definition Image Analysis – 5 Line Raster, page 4-32 • Ganglion Cell OU Analysis, page 4-33 • Reports and Printing, page 4-37 Note: See Appendix D for information on the RNFL Normative Database. See Appendix F for information on the Ganglion Cell Normative Database. Access Analysis To access analysis, click the Analyze button when it is active; it is active when a patient record with saved exams is selected or is open. Usually you will access it after selecting a patient from the ID PATIENT SCREEN. When you click the Analyze button, the ANALYZE SCREEN appears (see Figure 4-11 on page 4-18). Initially it shows four columns near the top, which list: • the patient’s exams by date (left column), with the most recent exam date selected by default; • for the selected exam, the right eye OD scans (center left column) and left eye OS scans (center right column) by scan type; • the column on the right where you can select among available analyses for the selected scan type, after you select a scan. The image display portion of the screen is blank until you select a scan from the OD or OS column and then select the desired analysis. Click to select any scan from the OD or OS list, and click the corresponding analysis at the right. The images will appear in the image screen below, after a few seconds. The ANALYZE SCREEN enables you to view and measure anatomical structures depicted in the scan images. Cirrus HD-OCT provides the following analyses for the macula: • Macular Thickness Analysis for cube scans, page 4-3 • Advanced RPE Analysis for cube scans, page 4-24 • High Definition Image Analysis – 5 Line Raster, page 4-32 • Ganglion Cell OU Analysis, page 4-33 Cirrus HD-OCT User Manual 2660021146510 A
  • 25. Analyze Scans: Macula 4-2 Analyze Screen Common Functionality The following information applies to the ANALYZE SCREEN in general, independent of the type of scan you are viewing. • Delete Scan button: Click the Delete Scan button to delete the currently selected scan. A dialog will prompt you to confirm your choice, as shown on the left. If a scan is not archived to DICOM Archive, you can delete the scan from the scan list, or delete it after the analysis is loaded. This button is disabled if the scan is already archived. • Print button: Click Print to initiate printing. You can print to paper, create a PDF, or export a number of image types, including PDF, TIFF, and JPEG to name a few. See Reports and Printing on page 4-37 for details. • Save Analysis button: Click Save Analysis to save the current analysis with the changes currently applied. The next time you open this analysis on the same scan, the saved analysis will appear initially. You can discard saved changes at any time and return to the original analysis by using the Discard Changes button. • Discard Changes button: Click Discard Changes to reload the original analysis, discarding all changes previously saved. Scan Display Left to Right Orientation Left to Right Scan Display Summarized For horizontal scans, left equals left and right equals right. For vertical scans, left to right equals bottom to top. For diagonal scans, left takes precedence over bottom. Cirrus always displays left to right scan images as follows: • For horizontal scans, left of scan equals left of scan display and right of scan equals right of scan display. • For vertical scans, bottom of scan equals left of scan display and top of scan equals right of scan display. • For diagonal scans in 5 Line Raster, left takes precedence over bottom, so that left of scan equals left of scan display and right of scan equals right of scan display. Retinal Layers Automatically Detected and Displayed • Cube scan analyses incorporate an algorithm to automatically find and display the inner limiting membrane (ILM) and the retinal pigment epithelium (RPE). In the scan images, which are cross-sections (slices), the layers appear as colored lines that trace the anatomical feature on which they are based. The ILM is represented by a white line, the RPE by a black line. These lines are also known as segmentation lines. These layers serve as the basis for the macular thickness and volume measurements in the Macular Thickness Analysis (page 4-3). In the Macular Thickness Analysis, the ILM and RPE layers are presented in their entirety as three-dimensional surface maps. • Show/Hide Layers button: Click Layers to hide or show the colored lines indicating the ILM and RPE layers Cirrus HD-OCT User Manual 2660021146510 A
  • 26. Analyze Scans: Macula 4-3 Macular Thickness Analysis The Macular Thickness Analysis (MTA) provides interactive scan images as well as the fundus image with scan cube overlay. To see this analysis after selecting a cube scan, select Macular Thickness from the list on the right. The default screen, shown in displays: • the identified fovea location. • the fundus image with scanned cube overlay or colored thickness map. • the ETDRS grid map with normative data. • a table containing average thickness and volume measurements. • a colored 3-D thickness map. • 3-D surface maps of the ILM and RPE. You may also manipulate the fovea location on this screen, which will update the data table and the ETDRS grid thickness measurements. 1 12 2 3 11 10 5 4 9 6 7 8 Figure 4-1 The Analyze Screen for Macular Thickness 1 Exam (date), OD and OS scan lists for selected exam, analysis list 2 Slice through cube front 8 OCT fundus image 3 ILM to RPE Thickness Map 9 Average thickness and volume measurements 4 3-D Surface Maps 10 Normative Data Details 5 Anterior Layer (ILM) 11 Fundus image with scan cube overlay 6 Posterior Layer (RPE) 12 Color code for thickness overlays Cirrus HD-OCT User Manual 7 Slice through cube side 2660021146510 A
  • 27. Analyze Scans: Macula 4-4 3-D Surface Maps ILM = inner limiting membrane RPE = retinal pigment epithelium Interactive three-dimensional (3-D) surface maps appear down the right side. The top map displays the thickness between the ILM and RPE as a color coded three-dimensional surface. The middle map shows the upper (anterior) of the two layers, the ILM. The lower map shows the lower (posterior) of the two layers, the RPE. • The surface maps are fully interactive. Click and drag to rotate a map in any direction and thereby view it from any perspective. The maps include the same slice navigators you are accustomed to seeing on the scan images and fundus overlay. As usual, you can click and drag each line to change the currently selected slices and the corresponding scan image updates immediately. You can double-click a map to view it in full screen (or right-click and select Full screen). As in normal view, you can rotate full screen maps in three dimensions. initial rotated clockwise and front tipped down rotated counterclockwise and front tipped up slightly from underneath, front tipped backward Figure 4-2 Same full screen 3-D surface map, showing rotated views • Right-click display options for 3-D surface maps. Right-click on a 3-D surface map to access the display options at left, which function as in other contexts. See on page 4-11 for details. Cirrus HD-OCT User Manual 2660021146510 A
  • 28. Analyze Scans: Macula 4-5 Fundus Image Overlay Options En Face Explained En face, from the French, means literally, “on the face;” that is, looking directly into the eye, which is the same perspective as the fundus image. By default, the fundus image overlay displays ILM - RPE, where you view on the fundus image a corresponding (in terms of color) thickness representation from above (en face) as appears on the contoured thickness map to the right. The drop-down menu below the fundus image gives you the following options: None, ILM - RPE, OCT Fundus, and ETDRS Position. Use the Transparency slider below the drop-down menu to adjust the transparency of the overlay. Numerical Average Thickness and Volume Measurements The area at lower left presents average thickness and volume numerically. ETDRS Grid Figure 4-3 Numerical average thickness and volume information It includes a table with central subfield thickness for the central circle of the circular map known as the ETDRS Grid, and total volume and overall average thickness for the ILM - RPE tissue layer over the entire 6 x 6 mm square scanned area. The ETDRS Grid shows overall average thickness in nine sectors. This circular map is composed of three concentric circles with diameters of 1 mm, 3 mm and 6 mm, and except for the central circle, is divided into superior, nasal, inferior and temporal quadrants. The central circle has a radius of 500 micrometers (1 mm diameter). The OCT fundus image to the right shows the surface of the area over which the individual thickness measurements were made that contribute to the subfield averages. FoveaFinderTM: Automatic Fovea Identification This feature is active in the Macular Thickness Analysis and the Macular Change Analysis. Cirrus identifies the fovea location automatically by looking for the reduced reflectivity below the retina. When the analysis screen first comes up, the fovea location has been determined and is indicated by the overlay position, the position of the slice navigators in the cube, and on the 3-D surface maps. The ETDRS grid in Figure 4-3, shows the values, in micrometers (μm), of the ILM-RPE thickness, calculated as described above. You can change the position of the ETDRS grid. If you change it, the reported values also change. Cirrus HD-OCT User Manual 2660021146510 A
  • 29. 4-6 Analyze Scans: Macula The position of the fovea and the center of the ETDRS grid is shown below the grid. In the example above, the fovea is located at the intersection of slice 253 and 64. If Cirrus cannot identify a fovea in the scan, it reports: “Fovea not found.” In this case, the center of the scan is used for the initial placement (position 256 and 64 for 512x128 scans and position 100 and 100 for 200x200 scans). It is also possible for the algorithm to find a depression in the reflectivity around the ILM that is not related to the fovea – in this case, the reported fovea will be wrong. In both of these cases, the user can set the fovea manually using the buttons described below. The most common pathologic conditions that cause failure of the fovea-finding algorithm are those that cause the greatest disturbance of the foveal architecture, such as AMD, other causes of macular edema, and proliferative diabetic retinopathy. Epiretinal membranes and other vitreoretinal interface disorders where the vitreoretinal interface becomes distorted can also cause the algorithm to fail. If the fovea is very far from the center, the algorithm may fail to find it. In order to ensure that the fovea is within a reasonable distance of the center, it helps to use the alignment tool during acquisition (see Place Scan Using Fundus Viewport, on page 3-14 and Options and Reset buttons on page 3-15). It also helps for subsequent visits to use the Repeat Setup and Repeat Scan Alignment feature (see Acquire Screen, HD 5 Line Raster on page 3-19 and Repeating Scan Setup and Alignment on page 3-28). Working with Scan Cube Overlays In the ILM-RPE overlay, the colors on the overlay correspond to the color-coded side bar scale on the right. The colors denote retinal thickness in micrometers (μm). When ETDRS Position is selected from the overlay menu, a small red circle appears centered around the Cirrus-calculated fovea position. This calculated ETDRS Grid position can be repositioned by clicking and dragging the circle using the mouse. Cirrus HD-OCT User Manual 2660021146510 A
  • 30. Analyze Scans: Macula 4-7 The thickness grid also moves in conjunction with the repositioning of the ETDRS Grid position on the overlay, as shown in Figure 4-4. ETDRS Grid position moved Thickness grid moves in conjunction with ETDRS Grid Figure 4-4 Thickness Grid Movement Interactive function buttons for ETDRS include: • Snap slice navigators to ETDRS Grid center position: Moves the slice navigators to the ETDRS Grid center position. • Reset ETDRS Grid: Moves the ETDRS Grid back to the Cirrus-calculated fovea center location. • Set ETDRS Grid center to slice navigator position: Moves the ETDRS Grid center to the center defined by the slice navigators position. • Snap to Center: Moves slice navigators to the center of the 6x6 mm square. These tools can be used to establish a new ETDRS Grid position after adjusting the position with the slice navigator in any of the various screen options. Also, as you adjust the ETDRS Grid position, the thickness grid also reflects the new values associated with the new setting. To save the new fovea position for future analysis, click on the Save button in the upper right-hand corner of the screen. This interactive analysis screen gives you several options to view patient data. For example, when you move one of the slice navigator bars and then select , the thickness grid reflects that change as the grid moves and the values change. Select to move the ETDRS Grid back to its original location. Select to move the slice navigators to the ETDRS Grid center. Use the button tools to line up the slice navigators with ETDRS Grid position and vice versa. For example, manually drag the ETDRS Grid to a new position on the overlay, then: • Select to center the slice navigators over the new ETDRS Grid position, as shown on the left. Note that the thickness grid does not change location. Cirrus HD-OCT User Manual 2660021146510 A
  • 31. 4-8 Analyze Scans: Macula • Select to reset the ETDRS Grid position to the original Cirrus-calculated position. The slice navigators also move back to their original positions over the ETDRS Grid position. Now move the slice navigators to a new position, as shown in Figure 4-5. The ETDRS Grid position does not change, nor does the thickness grid position. Figure 4-5 No Movement of Thickness Grid • Select • Select location. to align the ETDRS Grid position with the slice navigators. to move the ETDRS Grid and the slice navigators back to their original Macula Normative Database The Macular Thickness Analysis supports the clinician in identifying areas of the macula that may be of clinical concern by comparing the measured macular thickness to age-matched data in the Cirrus Macula Normative Database1. Normative data that is age-matched to the patient appears when you perform a Macular Thickness analysis on patients at least 18 years old. Data was not collected from subjects less than 18 years old. The Normative Database uses a color code, as seen in the legend at left, to indicate the normal distribution percentiles. The color code applies to the ETDRS grid average thickness values and the data table (see Figure 4-5 above). Among same-age individuals in the normal population, the percentiles apply to each particular retinal thickness measurement as follows: • The thickest 1% of measurements fall in the light red area. Measurements in light red are considered outside normal limits. (light red > 99%, above normal limits). 1. The Macula Normative Database is an optional feature that may not be available in all markets, and when available in a market, may not be activated on all instruments. If you do not have this feature and want to purchase it, contact Carl Zeiss Meditec. In the U.S.A., call 1-877-486-7473; outside the U.S.A., contact your local Carl Zeiss Meditec affiliate or distributor. Cirrus HD-OCT User Manual 2660021146510 A
  • 32. Analyze Scans: Macula 4-9 • The thickest 5% of measurements fall in the light yellow area or above (95% < light yellow  99%, suspect above normal) • 90% of measurements fall in the green area (5%  green  95%). • The thinnest 5% of measurements fall in the yellow area or below (1%  yellow < 5%, suspect below normal). • The thinnest 1% of measurements fall in the red area. Measurements in red are considered below normal limits (red < 1%, below normal limits). Note: Clinicians must exercise judgment in the interpretation of the macula normative data. For any particular measurement, note that 2 out of 20 normal eyes (10%) will fall either above or below green. Interpretation of the 1st Percentile: Values color-coded as “1st percentile” are lower than 99% of the database sample, but may not extrapolate well to the general population with less than 300 subjects in the reference database. Results falling in this region should be interpreted with caution. Interpretation of the 5th Percentile: Values color-coded as “5th percentile” are lower than 95% of the database sample. The 95% Confidence Interval on the 5th Percentile extends from the 2.5th percentile to the 7.7th percentile of the normative database. Information icons displayed on the Analysis screen offer additional information about the normative database limits. Hovering over the icon will display a tooltip, and clicking the icon will create a printout of the additional information presented. See Normative Data Details Report on page 4-41 for more information. Additional Features in Macular Thickness Analysis The buttons above appear from left to right in the Macular Thickness analysis. If you mouse over the buttons, their function appears in the form of a tool tip. The following paragraphs describe the additional features available on the Macular Thickness analysis screen: High-Res Images button: A pair of high-definition scans are taken at the beginning of each Macular Cube 512x128 and Macular Cube 200x200 scan. Select this button to display these central X and Y slices in high resolution. These two slices are composed of 1000 A-scans (for Macular Cube 200x200) or 1024 A-scans (for Macular Cube 512x128). The system provides this feature to enhance resolution in the central area of the scan, which corresponds to the center of the fixation target. The EDTRS Grid will not change position when the High-Res Images button is selected. These high-definition images may be enlarged to a full-screen view. The slice navigators will be set to slice 256 and 64 with the Macular Cube 512x128 or will be set to slice 100 and 100 with the Macular Cube 200x200 scan. To return to the standard resolution scans, re-select the High-Res Images button or move either the X or Y slice navigator to a different position. Edit Layers1 button: Click Edit Layers to open the EDIT SEGMENTATION screen, as shown in the following figure. Here you can edit the currently selected X and Y slice Cirrus HD-OCT User Manual 2660021146510 A
  • 33. Analyze Scans: Macula 4-10 placement on the ILM and RPE layers; Cirrus calculates thickness between these layers. Figure 4-6 Edit Segmentation Dialog This feature is especially useful in cases where the retina has structural anomalies or pathology that may cause the algorithms to incorrectly trace the actual boundaries. Click and drag the ILM line or the RPE line, shaping and placing it in the desired location by your mouse movement. You can draw and redraw the line or any portion of it repeatedly, selecting any point on a line to start each successive drawing action. Note that when you mouse over a line, it “pops,” or becomes thicker. The boundary lines you trace will never break. However, they will not cross each other. The buttons (shown at left) enable you to copy changes from one slice to the next slice or to the prior slice 1 2 3 4 Buttons 1 and 4 allow you to move through the layers. Button 2 copies your changes to the prior slice, and button 3 copies your changes to the next slice. Your changes are not saved as part of the Macular Thickness analysis until you click the Save button, , on the ANALYZE SCREEN. Then they will persist with the analysis until you re-edit the same layers and click Save again, or click Discard Changes, , when viewing the edited analysis. The segmentation changes affect only the specific X and Y slices you edit, but do take immediate effect in the 3D surface maps and all other ILM to RPE thickness measurements. Ruler button: Click Ruler and then click and drag in a scan image or the fundus image to draw a straight line that measures distance between the start and stop points. The resulting measurement appears next to the line in micrometers. • You can select and adjust the lines you draw: click and drag an endpoint to adjust its placement (and the line length), or click and drag the middle of the line to move it as a whole. • Click Ruler again to create additional measurement lines. 1. Edit Layers is an optional feature that may not be available in all markets, and when available in a market, may not be activated on all instruments. If you do not have this feature and want to purchase it, contact Carl Zeiss Meditec. In the U.S.A., call 1-877-486-7473; outside the U.S.A., contact your local Carl Zeiss Meditec affiliate or distributor. Cirrus HD-OCT User Manual 2660021146510 A
  • 34. Analyze Scans: Macula 4-11 • These measurements are saved when you close the analysis. The changes will appear on the Macular Thickness Analysis printout, but not in the Advanced RPE Analysis. Note: You may use the ruler tools with the high definition images. Delete Measurements button: Click Delete to delete the currently selected measurement lines. You can select lines in more than one image at a time. To deselect a line, click anywhere on the same image but off the line. Image Display Options During Analysis Right-click on the fundus image, on its overlay, or on a scan image to access the image display options seen in the menu at left, or a subset of them. A checkmark indicates when an option is selected. (Right-click menu options are not available for 3D volume renderings.) • Normal: Selected initially, clicking Normal exits other display-change modes, and thereby fixes or freezes the changes you have made to that point. • Reset: Resets the current display to default settings. • Zoom: Gives access to the following options: • Unzoom: Unzooms the image. • Rectangle: When selected, click and drag to select a rectangular area to fill the screen. • Continuous: When selected, click and drag up to increase the zoom; click and drag down to decrease the zoom. • Pan: This option is present only when the image is zoomed. When selected, click and drag the image to view other parts of it. • Full screen: Select to view the image in full screen. to open them in full screen. ✐ Tip: You can aalso double-click most images normal view or click the Back Double-click full-screen image to return to button. • Save image as...: Saves the current image on screen in the location you select. See the Exporting/Saving to the Hard Drive below (page 4-12). • Tag for print: Tags the current image for inclusion in a custom report printout. This option is available only for Advanced Visualization. See Custom Print on page 4-54 for details. • Movie: Changes the display to movie mode—movie controls will appear—so you can view all slices in the current plane in succession as a movie. This option is available Cirrus HD-OCT User Manual 2660021146510 A
  • 35. 4-12 Analyze Scans: Macula only for OCT viewports. Movie is only available for Macular Thickness and Advanced Visualization analyses. Figure 4-7 Movie Controls • Hide Slice Navigator: Hides the slice navigator, including the colored outline around the image. • Brightness/Contrast: When this feature is used, values appear on the image that reflect the numerical parameter values you select. Left-click the mouse and hold while moving the mouse up and down changes the brightness; moving the mouse left or right changes contrast. They also work in combination when you move the mouse diagonally. To retain the settings for this session, right-click the image to bring up the menu, then select Normal. • Color: Selected by default; deselect to view in grayscale. You can switch between color and grayscale globally, for all viewports, ✐ Tip:selecting or deselecting Colored OCT in the Tools menu (or by pressing by F9 on the keyboard). Colored OCT is the default. • Save movie as...: Opens the Save As dialog so you can save the movie of the current plane in video format. This option is available only for OCT viewports. Note: When using the Zoom or Brightness/Contrast feature on the ONH and RNFL OU or RNFL Thickness analysis screens (Chapter 5), do not click and drag the mouse inside the circle on the fundus image; instead of expected results, this will cause the circle to move to a different location on the image. Exporting/Saving to the Hard Drive Note: Do not export or save data—including images and movies—to the C: drive of a Cirrus instrument, which includes the desktop. The Cirrus hard drive is partitioned into C: and either a D: or an E: drive, and the C: drive is reserved for operating system and Cirrus application files. The C: drive is relatively small and can be filled up quickly, which renders the system unusable. The D: (or E:) drive is reserved for data and therefore is relatively large. If you want to export or save data to the Cirrus hard drive, either locally or to a connected Cirrus system on the network, select (a location in) the D: (or E:) drive as the target. Cirrus HD-OCT User Manual 2660021146510 A
  • 36. Analyze Scans: Macula 4-13 Macular Change Analysis Selecting the Macular Change Analysis1 (MCA) option allows you to compare two Macular Cube 512x128 scans or two Macular Cube 200x200 scans side by side, as shown in Figure 4-8. The default is to compare the two most recent scan dates. The Cirrus automatically registers the en face images from the two dates so that the images you see are synchronized to show the equivalent location of the retina in each image. In addition, the color-coded thickness maps for the two images, as well as the thickness difference map, are displayed. When automatic registration occurs, the current image (which appears on the right-hand side) is aligned to the prior image (which appears on the left-hand side). Both the en face image and the fundus image are compensated for the differences in scan locations during acquisition. The registration process maps similar anatomical structures, such as blood vessels, to each other to obtain the proper registration. Rotation of an image due to the patient’s eye being rotated from one session to another is also accounted for in the registration. Areas of the current image that do not overlap with the prior image are not included in the final registered image. This causes the thickness map on the right side and the fundus image to display a black border around the outside edge(s) of each view. The size of the border depends on how much the current image was shifted to align with the prior image. In addition, the right-hand B-scan will show an incomplete view in the areas where data was not acquired in both scans. The ETDRS Grid position circle is automatically positioned over the fundus image of the older scan data. You can adjust this position by clicking anywhere within the OCT scan boundary, and dragging the ETDRS Grid to a new position. Thickness values are automatically recalculated corresponding to the new ETDRS Grid position. The Thickness Difference Map is seen at the far right of the display. It displays the thickness differences between the two scan dates (current thickness minus prior thickness, in micrometers) at each pixel location. The difference map has a different color scale to represent the thickness change. This color map is indicated to the right. Warmer colors indicate an increase in the thickness; cooler colors indicate a decrease in thickness. The transparency slider beneath each overlay can be adjusted, as required, to enhance the image. 1. Macular Change Analysis is an optional feature that may not be available in all markets, and when available in a market, may not be activated on all instruments. If you do not have this feature and want to purchase it, contact Carl Zeiss Meditec. In the U.S.A., call 1-877-486-7473; outside the U.S.A., contact your local Carl Zeiss Meditec affiliate or distributor. Cirrus HD-OCT User Manual 2660021146510 A
  • 37. Analyze Scans: Macula 4-14 1 6 2 3 7 4 5 8 Figure 4-8 Macular Change Analysis screen 1 Sync Lock 2 Foveal Target 3 Thickness Map 4 ETDRS Grid boundary (black circle) 5 OCT scan boundary (yellow square) 6 Thickness Difference Map 7 Thickness Map 8 Slider Navigator ETDRS Grid Location Default ETDRS Grid center When you enter Macula Change Analysis, Cirrus loads the saved fovea for each exam. This fovea location is determined by the last saved fovea location for that exam. Typically, this will be the fovea that Cirrus found automatically. However, if you or another user change the fovea location for the exam in the Macula Thickness Analysis, and save the analysis result, then that is the fovea used in Macula Change Analysis. Cirrus HD-OCT User Manual 2660021146510 A
  • 38. Analyze Scans: Macula 4-15 1. When automatic registration is successful, or when manual registration is applied, the initial location of the ETDRS Grid center for both loaded scans is determined by the location of the fovea in the prior (left-hand) image. This is because successful registration implies that each pixel in the current image maps directly to the same pixel in the prior image. Thus, the foveas do not need to be independently identified. 2. When No Registration is applied, the initial location of the ETDRS grid center for both scans is taken from the saved value for that scan. Synchronized Data Review When the images are synchronized, the analysis allows the user to manipulate the data on one exam image, while the identical movements are tracked on the second exam for a side by side comparison. When the sync lock is selected, , you can adjust the slice navigator or image slider bar to simultaneously move through the images and view the data. If the sync is not locked, , adjustments to one overlay do not effect the other. Adjusting the ETDRS Grid centers You can adjust the position of the ETDRS Grid center. If Sync lock is on, you can make the adjustment on either image, and it will be applied to the other image. If Sync lock is off, you must adjust each center individually. Registration Successful The Registration Succeeded message along with the green flag indicate that the two chosen images did register reliably. A red flag appears if the registration fails. This could be caused by weak signal strength, poor alignment, opacities, large differences in the scan areas or larger differences in retinal anatomy. When that occurs, you may attempt to use Manual registration by selecting from the Registration dialog box or, if available, select another image for comparison. In the Registration dialog box, you may also choose No Registration. Note: The indication for success or failure of the registration algorithm is based on a cross-correlation metric computed from the two images after registration. A threshold is used on this metric to make a binary decision of success or failure. Cirrus HD-OCT User Manual 2660021146510 A
  • 39. 4-16 Analyze Scans: Macula Registration Review Registration between the two fundus images may be compared by selecting the Registration Review button: . The results are displayed on a pop-up screen, as shown in Figure 4-9. Figure 4-9 Registration between Fundus Images In this screen, image 1 is the original image. Image 2 is the en face image from the most recent visit that has been registered to Image 1. The bottom image is an overlay of the two exams. The image slider allows you to adjust the view of the overlaid images: slide to the left to view image 1, to the right for image 2. Black borders might be seen in Image 2. This is the area of the second image that does not correspond to the first image when the two images were registered to each other. To manually adjust the registration, select the Manual Registration button. Select three to five corresponding points on Image 1 and Image 2 by using the mouse click. See Figure 4-10. Place each point over an identifiable feature that appears in both scans that you expect to be constant across scans. For example, a blood vessel bifurcation or a bend in a blood vessel can be used. Undo buttons Figure 4-10 Manual Registration Cirrus HD-OCT User Manual 2660021146510 A
  • 40. Analyze Scans: Macula 4-17 Select Review Registration to view your manually adjusted overlay. Use the slider above the overlay, as needed, to change the transparency to see more of Image 1 or Image 2. By moving the slider back and forth, you can see if blood vessels or other features from one image align with the identical features in the other image. To return the registration to the original setting, press the Reset Overlay button. If you are not satisfied with the positioning of the points, click on the Undo button, , to delete all points and then make new point selections. Darker areas on the lower registration screen occur where there is no data to compare. This will occur when the data points selected create an offset of the images. To see the final registered image, move the slider all the way to the right. This black border will also be seen on the thickness map and the thickness difference map on the MCA screen. When you are satisfied with the resulting overlay, select OK. To reset the values to the original registration, click Cancel. The XML export from the MACULAR CHANGE ANALYSIS screen is performed by clicking on the XML Export button (shown on the left). For further details on XML export, see XML Export in Chapter 9. Cirrus HD-OCT User Manual 2660021146510 A
  • 41. 4-18 Analyze Scans: Macula Macular Change Analysis – Manual Selection When there are two or more scans taken on the same day, the most recent scan (the one with the latest time stamp) is chosen as the default scan to be used in Macular Change Analysis. Sometimes, this scan is not the best to use for comparison. The scan may not have the best signal strength or the scan was taken in a position away from the center and, therefore, would not be a good match. You are able to manually choose a different scan using the manual selection process. 1. At the top of the Analysis screen, select the scan date and the scan you wish to use as the more current scan (the scan information that will appear on the right side of the screen). 2. Select Macular Change Analysis – Manual Selection from the far right column. 3. A list of eligible scans will appear in a dialog box (see Figure 4-11). 4. Click on the scan you wish to include in the MCA. A green check mark will appear next to the scan. 5. Click on Next to proceed. The window will collapse and the scan you chose will appear as the scan on the left-hand side of the MCA screen. Note: You may not choose two scans from different visits from the manual selection window. You may only select one scan in this way to use as the earlier of the two scans. Figure 4-11 Macular Change Analysis–Manual Selection screen Cirrus HD-OCT User Manual 2660021146510 A
  • 42. Analyze Scans: Macula 4-19 Advanced Visualization 1 5 2 4 3 Figure 4-12 Advanced Visualization Analyze Screen 1 Z slice or slab through cube top 4 Top of cube en face scan pl= Z yellow scan lin ane lower right view e port X slice through cube front 3 Data Cube Orientation Exam (date), OD and OS scan lists for selected exam, analysis list 2 Y slice through cube side 5 Fundus image with scan cube overlay The ANALYZE SCREEN for Advanced Visualization, Figure 4-12, presents an interactive multi-planar reformat (MPR), which enables you to view image cross-sections through X three dimensions. The example above is for a Macular Cube 200x200. The upper left Side of cube = slow B-scan plane viewport shows the saved fundus image with an optional en face scan overlay. The other magenta scan line Front of cube = lower left viewport three viewports show cross-sectional scan images in three planes. Thinking of the data as a fast B-scan plane cube, the viewports show the data in planes parallel to the side of the cube (Y plane, lower blue scan line Y upper right viewport left viewport), the front of the cube (X plane, upper right viewport) and the top of the cube (Z plane, lower right viewport), as shown in Figure 4-12 and to the left. Multi-Planar Reformat (MPR) • The viewports are interactive: Click and drag the triangles or click on a scan viewport and use the mouse scroll wheel to “move through” the active plane of the viewport; En Face Explained you will see the resulting cross-sections update simultaneously in the other viewports. En face, from the French, means This functionality enables you to quickly search through the data cube and stop when literally, “on the face;” that is, you see an area of interest. looking directly into the eye, which is the same perspective as the fundus image. Cirrus HD-OCT User Manual 2660021146510 A
  • 43. Analyze Scans: Macula 4-20 Retinal Layers Automatically Detected and Displayed • Cube scan analyses incorporate an algorithm to automatically find and display the inner limiting membrane (ILM) and the retinal pigment epithelium (RPE). Cirrus also calculates and presents a layer called RPEfit, which is a representation of a normal parabolic RPE for this eye, based on the retina’s overall curvature. You can use the RPEfit line to view variations from normal in the actual RPE contour. In the scan images, which are cross-sections (slices), the layers appear as colored lines that trace the anatomical feature on which they are based. The ILM is represented by a white line, the RPE by a black line, and the RPEFit line is magenta in color. These lines are also known as segmentation lines. You can customize the colors used to display each of these lines, as explained below. These layers serve as the basis for the macular thickness and volume measurements in the Macular Thickness Analysis (page 4-3). In the Macular Thickness Analysis, the ILM and RPE layers are presented in their entirety as three-dimensional surface maps. ILM = inner limiting membrane RPE = retinal pigment epithelium Fundus Image Overlay Options • Use the Overlay drop-down menu to select which overlay to use on the fundus image: None (default), Slice, OCT Fundus, Slab, ILM - RPE, ILM - RPEfit or RPE - RPEfit. The slice and slab options correspond to the en face image in the lower right viewport. (The options ILM, RPE and RPEfit are variations of the slab. See Slice and Slab Options on page 4-21 page for a description.) You can adjust the associated Transparency slider from 0% (opaque) to 100% (fully transparent). The OCT Fundus option is the same overlay (en face) shown on the fundus image in the REVIEW SCREEN. Cirrus HD-OCT User Manual 2660021146510 A
  • 44. Analyze Scans: Macula 4-21 Slice and Slab Options The lower right viewport, Figure 4-13, has a drop-down menu to select Slice (default), Slab, ILM, RPE or RPEfit. Figure 4-13 Analyze Screen showing a slab When you select Slab, the other two scan viewports show two same-color dashed lines separated by a small distance. This separation is the slab thickness, which you can adjust in either of the other viewports by dragging the posterior line by its handle on the edge. Dragging the anterior line handle moves both lines of the slab together to reposition it in the scan image. The resulting slab image you see represents an average signal intensity value for each A-scan location through the selected depth of the slab. ILM = inner limiting membrane RPE = retinal pigment epithelium • The drop-down options ILM, RPE and RPEfit are variations of the slab. When you select any of these, you view the slab (of selected thickness—you can adjust it as above) relative to the selected layer. For example, if you select ILM (Figure 4-13), a dashed line of the same color as the ILM appears posterior to it, and the resulting scan image appears in the lower right viewport (and in the scan cube overlay when Slab is selected there). You cannot raise the lower dashed line above the upper one, and the minimum separation is 2 micrometers. Cirrus HD-OCT User Manual 2660021146510 A
  • 45. 4-22 Analyze Scans: Macula Function Buttons in Advanced Visualization The buttons shown on the left appear from left to right in the Advanced Visualization analysis, above the scan images at right. If you mouse over them, their function appears in the form of a tool tip. • Ruler button: Click Ruler and then click and drag in a scan image or the fundus image to draw a straight line that measures distance between the start and stop points. The resulting measurement appears next to the line in micrometers. • You can select and adjust the lines you draw: click and drag an endpoint to adjust its placement (and the line length), or click and drag the middle of the line to move it as a whole. • Click Ruler again to create additional measurement lines. • These measurements are saved after you close the analysis and will appear on reports (printouts) you make while they are present. • Delete Measurements button: Click Delete to delete the currently selected measurement lines. You can select lines in more than one image at a time. To deselect a line, click anywhere on the same image but off the line. • Show/Hide Layers button: Click Layers to hide or show the colored lines indicating the layers (ILM, RPE and RPEfit). • Configure Layers button: Click Configure Layers to open the Layer Configuration Dialog, Figure 4-14, where you can select the colors of the layers for ILM, RPE and RPEfit, and whether to display them or not. Figure 4-14 Layer Configuration Dialog and Color picker • Click a Color button for ILM, RPE or RPE-fit to open a standard color picker, where you can select a new color for that layer, or even define a custom color. • The layers with their Display checkbox selected appear in scan images for Advanced Visualization and Macular Thickness analyses for the scan you are viewing. Click to select or clear Display checkboxes as desired. Cirrus HD-OCT User Manual 2660021146510 A
  • 46. Analyze Scans: Macula 4-23 Note: Switching to a different scan or leaving the Analysis screen causes the selected segmentation colors to default to the original colors. • Center button: Click Center to return the current slices to their default central positions. • Tagged Images button: Click the Tagged Images button to view and adjust which images are tagged for custom printing. This button is active when one or more images have been tagged for printing by selecting Tag for print from the right-click menu. (See Custom Print on page 4-54 for details.) The Advanced Visualization screen also uses the image display options available by using the right mouse click. See Image Display Options During Analysis on page 4-11. Note: Brightness/Contrast and Color adjustments apply simultaneously to all X, Y and Z slices on screen (in OCT viewports or as the fundus overlay). If two Z slabs are on screen, one as the fundus overlay and one in the lower right viewport, Brightness/Contrast and Color adjustments made on either slab will apply to both. Between the fundus image and its overlay, Brightness/Contrast and Color operate independently. Right-click on one or the other to apply such changes. Some image display options function as a distinct display mode and that viewport or overlay remains in that mode until you click Reset, Normal or select another mode. • For example, if you select Brightness/Contrast for one viewport, the brightness and/or contrast changes every time you click and drag your mouse over that viewport, until you select Normal or Reset. Note that selecting Normal would not reset the viewport to its initial brightness and contrast settings. Fundus Image, Overlay and Scan Image Options Note: Not all display options apply to every kind of image, and in these cases they are not available. For example, Movie does not apply to the fundus image or its overlay, since these are single images. For the fundus overlay, the Brightness/Contrast and Color options are available only for Slice and Slab, not for OCT Fundus nor for the calculated thickness overlays (e.g., ILM-RPE). Another example is that Tag for print is available only in the Advanced Visualization analysis. Cirrus HD-OCT User Manual 2660021146510 A
  • 47. 4-24 Analyze Scans: Macula Advanced RPE Analysis The Advanced RPE Analysis allows you to examine the status of the RPE in more detail than the Macular Thickness Analysis. In particular, Cirrus provides two algorithms, one to identify and measure elevations in the RPE, and one to identify and measure areas of sub-RPE illumination where the OCT beam is able to penetrate through to the choroid, indicating that the RPE is atrophic. Maps based on each analysis, as well as a map that integrates both analyses are presented to visualize these disturbances in the RPE, and numerical results are provided to summarize them. Within the Advanced RPE Analysis, there are two screens available for reviewing the results. The first screen shows both the RPE elevation and the sub-RPE illumination results separately as en face images. The second screen shows the integrated analysis along with calculated values. The RPE Advanced Analysis can be performed on both the Macula 512x128 and Macula 200x200 scan data. Performing an Advanced RPE Analysis To perform an analysis: 1. Select the scan you want to analyze. 2. Select Advanced RPE Analysis. For comparison, the best scan of the same type from the most recent prior visit is selected by default. If you want to select a different scan for comparison, select Advanced RPE Analysis - Manual Selection. If there is only data from one visit, the prior area will be blank on the Advanced RPE Analysis and the report. Cirrus HD-OCT User Manual 2660021146510 A
  • 48. Analyze Scans: Macula 4-25 Advanced RPE Analysis Screen 1 1 2 8 3 4 7 5 6 Figure 4-15 Advanced RPE Analysis - Screen 1 1 RPE Elevation Map overlaid on fundus image 2 Circles on the RPE Elevation Map centered on the fovea location 3 Transparency adjustment for RPE Elevation Map 4 Line from fovea connecting closest sub-RPE illumination area 5 Transparency control for Sub-RPE Slab overlaid on OCT Fundus image 6 Sub-RPE Slab with overlaid segmentation of Sub-RPE Illumination 7 Horizontal tomogram showing RPE Elevation segmentation line 8 Fovea location for exam shown above RPE Elevation Map The analysis displays an RPE Elevation Map as an overlay on the fundus image. The transparency is preset, however you can adjust transparency on the analysis screen using the control to the side (3 in Figure 4-15). The pseudo-color aids in identifying bumps and discontinuities in the RPE. The map shows circles corresponding to 3 mm and 5 mm in diameter centered on the fovea. On the side of the map the legend shows how the colors correspond to the height of the elevations. Cirrus HD-OCT User Manual 2660021146510 A
  • 49. 4-26 Analyze Scans: Macula Note: The RPE elevation measurements can be affected by the presence, size, or extent of geographic atrophy, choroidal neovascularization, extensive epiretinal membrane, or vitreomacular traction. The user may evaluate the possible impact on the analysis by reviewing the individual B-scans and determining if the areas of RPE elevation overlap with these other pathologies. As with all retinal pathology, the user is encouraged to check the retinal segmentation in questionable cases. View the horizontal tomogram and check the black and lavender lines indicating the borders of the RPE elevation measurement. Note: The RPE Elevation algorithm was not tested on subjects who had geographic atrophy, choroidal neovascularization, or pigment epithelial detachments. The performance of the RPE Elevation algorithm on subjects with these conditions has not been determined. Since pigment epithelial detachments are elevations to the RPE, the Advanced RPE Analysis may be of clinical use. See Appendix G for the performance of Advanced RPE Analysis measurements. Note: Repeatability of measurements of RPE elevation are dependent on consistent and accurate identification of the fovea location. The system has an automatic fovea finder. The user should check that the software was able to find the fovea location and evaluate if the location is correct. If the user determines that the location was not correct, the clinician should manually correct it. Note: The minimum RPE elevation that the software will include in the quantitative result is 19.5 μm. Drusen below this threshold are not included in the area and volume calculations. In some cases, drusen may be observed in color fundus photographs that are not seen in the Advanced RPE Analysis because either the drusen does not represent any elevation, or because the drusen is accompanied by an elevation that does not meet the minimum threshold for detection. Only small, shallow drusen are likely to be missed. Note: RPE elevation measurements are not meant to replace other means of clinical evaluation such as color fundus photographs for drusen documentation and measurement. Note: The clinical utility of this feature in therapeutic dry AMD trials has yet to be established. Sub-RPE Slab The Sub-RPE slab represents the summed reflectivity in the region below Bruch's membrane. This slab indicates the fovea location with a dot and a circle corresponding to 5 mm in diameter centered on the fovea. It also shows a red line from the fovea to the closest area with sub-RPE illumination (6 in Figure 4-15). The Sub-RPE Slab is shown as an overlay on the OCT Fundus image. The transparency is preset, however you can adjust transparency on the analysis screen using the control below the slab (5 in Figure 4-15). Cirrus HD-OCT User Manual 2660021146510 A
  • 50. Analyze Scans: Macula 4-27 The automatic sub-RPE illumination segmentation is shown with an outline. The boundaries can be toggled on or off. If the sub-RPE illumination segmentation outlines are toggled on, these will become transparent to the same degree as the sub-RPE slab. The Advanced RPE Analysis includes a horizontal tomogram. This tomogram shows the RPE elevation segmentation lines, but not the segmentation lines for the sub-RPE slab segmentation. The segmentation lines may be toggled on or off. Note: Repeatability of measurements of sub-RPE illumination are dependent on consistent and accurate identification of the fovea location. The system has an automatic fovea finder. The user should check that the software was able to find the fovea location and evaluate if the location is correct. If the user determines that the location was not correct, the clinician should manually correct it. Note: This feature was tested on subjects who had lesion diameters no smaller than 1.25 mm nor greater than 5 mm and who had no peripapillary atrophy or choroidal neovascularization. The performance of the Advanced RPE Analysis on subjects who do not meet these criteria has not been determined. See Appendix G for the performance of Advanced RPE Analysis measurements. Note: Increased sub-RPE illumination is not specific to geographic atrophy and can occur in any condition that causes RPE atrophy or thinning, absence or breaks, such as retinal dystrophies, scarring due to infections, and laser photocoagulation of the retina. In addition, poor signal strength, pigmentation of the fundus, and peripapilliary atrophy can occasionally cause misleading sub-RPE illumination findings. Note: The clinical utility of this feature in therapeutic dry AMD trials has yet to be established. Cirrus HD-OCT User Manual 2660021146510 A
  • 51. 4-28 Analyze Scans: Macula Sub-RPE Illumination Editing To edit the sub-RPE illumination: 1. Open an edit screen by clicking on the Segmentation Tool (shown at left). The screen displays the sub-RPE illumination segmentation as a colored region on the sub-RPE slab. The current sub-RPE illumination segmentation becomes active for editing. The edit screen also includes the OCT en face image with slice navigators and the Horizontal B-Scan tied to the navigator position. Slice indicators Figure 4-16 Edit Sub-RPE Segmentation Dialog 2. Use one of the available edit tools (shown clockwise at left) to modify the segmentation boundaries: • Pencil: click and drag to draw with fine detail. • Floodfill: adds gross detail. To fill in a full lesion, draw the boundary of the lesion with the pencil tool or the floodfill tool, click on the floodfill icon, and then click on the lesion to fill it in. • Eraser: removed gross detail. To remove a large area, draw the boundary of the area with the knife or eraser, click on the eraser icon, then click on the area to erase. • Knife: click and drag to delete with fine detail. 3. Once you have completed editing, click on the Apply button to complete the operation and return to the Analysis screen with the updated segmentation. On the analysis screen, the segmentation is shown as an outline around the area that had been filled in on the edit screen. Note: You are able to edit the automatic sub-RPE illumination boundaries for the current visit only. If you want to edit the segmentation for the prior visit, highlight the scan for the prior visit and run the Advanced RPE Analysis. The prior visit then becomes the current visit, and you can edit segmentation. Cirrus HD-OCT User Manual 2660021146510 A
  • 52. Analyze Scans: Macula 4-29 Advanced RPE Analysis Screen 2 Figure 4-17 Advanced RPE Analysis - Screen 2 The analysis includes an image that combines the RPE Elevation Map and the sub-RPE illumination segmentation. The sub-RPE illumination segmentation is overlaid on the RPE Elevation Map. The sub-RPE illumination segmentation is shown with an outline. This image shows the fovea location with a dot marking and a circle corresponding to 3 mm and 5 mm diameter circles centered on the fovea. This image is superimposed on top of the fundus image. • A caliper is available to measure distances on the RPE Profile Map. The measurements made with this tool will not be saved. Calculated values: The analysis includes the following values as well as a calculation of current minus prior and percent change: • Area of RPE elevations in 3 mm and 5 mm circle, with the unit of measure mm2 rounded up to one decimal place. • Volume of RPE elevations in 3 mm and 5 mm circle, with the unit of measure mm3 rounded up to two decimal places. • Area of sub-RPE illumination in 5 mm circle, with the unit of measure mm2 rounded up to one decimal point. If no sub-RPE illumination is seen in the circle, the value shown is 0.0. • Distance measurement from nearest sub-RPE i llumination to fovea, with the unit of measure mm identified and with values rounded up to one decimal place. Note: The calculated difference does not consider test-retest variability. The analysis and report indicate if the fovea has been found and the fovea location. If the fovea was not found, the analysis will center the measurement circles within the 6mm Cirrus HD-OCT User Manual 2660021146510 A
  • 53. 4-30 Analyze Scans: Macula square. The user may edit the fovea location by clicking on the outer circle in the RPE Elevation Map and dragging to the desired location. Or, the user may snap to the slice navigator position. A warning message will appear if the 5mm circle extends outside of the scan window. A warning message will appear if the scan is too low in the B-Scan window. Note: The Advanced RPE Analysis may occasionally identify RPE elevations or areas of sub-RPE illumination in normal subjects. In a post-hoc analysis of 115 subjects from the diversified normative database, the software identified RPE elevations in the 5 mm circle in 2.6% of the subjects, with a mean of 0.006 mm2 for area and 0.0002 mm3 for volume. In the same analysis, the software identified areas of sub-RPE illumination in 6.1% of the subjects, with a mean area of 0.08 mm2. Note: Signal strength and image quality can be significantly reduced when the imaging aperture (the lens) is dirty or smudged. If you suspect this problem, follow the instructions to clean The Imaging Aperture (page 11-6). Cirrus HD-OCT User Manual 2660021146510 A