
Recomendados
Más contenido relacionado
La actualidad más candente
La actualidad más candente (20)
Destacado
Similar a Wgr ne presentation(1)
Similar a Wgr ne presentation(1) (20)
Más de krgc
Más de krgc (15)
Wgr ne presentation(1)
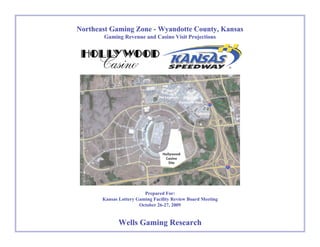
- 1. Northeast Gaming Zone - Wyandotte County, KansasNortheast Gaming Zone - Wyandotte County, Kansas Gaming Revenue and Casino Visit ProjectionsGaming Revenue and Casino Visit Projections Prepared For:Prepared For: Kansas Lottery Gaming Facility Review Board MeetingKansas Lottery Gaming Facility Review Board Meeting October 26-27, 2009October 26-27, 2009 Wells Gaming ResearchWells Gaming Research
- 2. October 26-27, 2009October 26-27, 2009 Wells Gaming ResearchWells Gaming Research 11 MethodologyMethodology • Used WGR’s proprietary gravity model • Used 2009 annualized data as status quo for baseline projections • Population data at census tract level for 2000 and 2008-2015 • Defined and ran 3 primary scenarios and 3 supplemental scenarios that show a single midpoint estimate and the percent expected variance at a 68% confidence interval
- 3. October 26-27, 2009October 26-27, 2009 Wells Gaming ResearchWells Gaming Research 22 NE Kansas Trade AreaNE Kansas Trade Area • Trade area (approximate 125-mile radius) includes 31 counties in Kansas, 38 counties in Missouri, and 3 counties in Nebraska • The trade area population is 3,217,151; of which 2,240,306 are adults • Of the adult population, 1,123,704 (50%) live in Wyandotte County and the five contiguous counties
- 4. October 26-27, 2009October 26-27, 2009 Wells Gaming ResearchWells Gaming Research 33 NE Kansas Trade Area MapNE Kansas Trade Area Map
- 5. October 26-27, 2009October 26-27, 2009 Wells Gaming ResearchWells Gaming Research 44 Existing CasinosExisting Casinos • Existing competition includes 13 casinos 1 casino in Iowa 5 casinos in Kansas 6 casinos in Missouri 1 casino in Oklahoma • Total existing capacity: 16,379 slots, 348 pit tables, and 70 poker tables
- 6. October 26-27, 2009October 26-27, 2009 Wells Gaming ResearchWells Gaming Research 55 Impact of Loss Limit RemovalImpact of Loss Limit Removal • Missouri abolished loss limits in November of 2008 • WGR used ARIMA modeling techniques to estimate impact on MO gaming revenues and casino visits 1.57% annualized impact on gaming revenues 6.76% annualized impact on casino visits • Impact percentages were used to create base annual revenue and visits numbers with a full year of impact factored in
- 7. October 26-27, 2009October 26-27, 2009 Wells Gaming ResearchWells Gaming Research 66 Capacity Comparison - 2009 vs. 2008Capacity Comparison - 2009 vs. 2008 2009 Application Hollywood Casino Kansas 2008 Applications (Projections Made by WGR for 2012) 1 Capacities & Amenities Phase I (2012) Full Build Out (2015) Golden Heartland Phase I Hard Rock Legends Sun Pinnacle Entertainment Casino: # of Slots 2,300 3,000 2,500 3,000 2,000 2,300 # of Tables Games (inc Poker) 86 100 98 140 85 85 Hotel Rooms 0 500 300 300 350 500 Restaurants/Entertainment: # of Restaurants 3 5 5 10 2 5 8 # of Entertainment Venues 1 2 3 10 2 3 3 Convention Square Footage 0 60,000 1 25,000 40,000 40,500 68,540 Sports/Recreation Facilities: Not Specified Not Specified 4 3 3 2 Parking: 2,785 4,685 3,249 6,926 3,500 2,820 # of Retail Outlets 2 2 1 3 5 4 # of FTE's (full time equivalents) 1,129 Not Specified 1,625 1,991 1,776 2,074 Footnotes: 1. Multipurpose meeting and entertainment venue. 2. The Hard Rock includes the Retail/Dining/Entertainment District proposed by The Cordish Company in the 2008 application. It includes 165,600 sq ft of dining and entertainment with 6 restaurants and 7 clubs, 100,000 sq ft of promenade space for live performances, for a total of 265,500 sq ft.
- 8. October 26-27, 2009October 26-27, 2009 Wells Gaming ResearchWells Gaming Research 77 Revenue and Visits Comparison - 2009 vs. 2008Revenue and Visits Comparison - 2009 vs. 2008 (Numbers in Millions)(Numbers in Millions) 2009 Application Hollywood Casino Kansas 2008 Applications (Projections Made by WGR for 2012) 1 Capacities & Amenities Phase I (2012) Full Build Out (2015) Golden Heartland Phase I Hard Rock Legends Sun Pinnacle Entertainment Capital Investment $361.0 $627.5 $660.0 $706.0 $767.0 $650.0 Gaming Revenues: Applicant $201.5 $326.8 $266.1 $358.1 $281.6 $401.5 WGR $151.9 2 $255.1 2 $178.3 $226.7 $163.4 $193.2 Difference $49.6 $71.7 $87.8 $131.3 $118.2 $208.3 % Difference 24.6% 21.9% 33.0% 36.7% 42.0% 51.9% Visitor Projections: Applicant 2.86 4.35 3.67 4.51 2.98 3.97 WGR 2.15 3.29 2.48 3.15 2.27 2.69 Difference 0.71 1.06 1.19 1.36 0.72 1.28 % Difference 24.8% 24.4% 32.4% 30.2% 24.2% 32.2% Footnotes: 1. Recap of WGR's projections as presented to the Board in September 2008. 2. At a 68% confidence interval, revenues can be expected to vary by +16% and -18% for Phase I, and +8% and -10% for Full Build Out.
- 9. October 26-27, 2009October 26-27, 2009 Wells Gaming ResearchWells Gaming Research 88 Capacity Comparison to ExistingCapacity Comparison to Existing Kansas City, MO CasinosKansas City, MO Casinos Kansas City, Missouri Casinos (Actual 2009) 1 Capacities & Amenities Phase I (2012) Full Build Out (2015) Ameristar Argosy Harrah's Isle of Capri Casino: # of Slots 2,300 3,000 3,022 1,962 1,793 1,525 # of Tables Games (inc Poker) 86 100 105 47 75 16 Hotel Rooms 0 500 184 258 392 0 Restaurants/Bars/Entertainment: # of Restaurants 3 5 10 5 6 5 # of Entertainment Venues 1 2 3 3 1 1 Convention Square Footage 0 60,000 14,520 19,000 10,000 0 Sports/Recreation Facilities: Not Specified Not Specified 1 1 0 0 Parking: # of Parking Spaces 2,785 4,685 2,660 2,535 3,122 1,618 Covered Parking Availability Yes Yes Yes Yes Yes No # of Retail Outlets 2 2 1 1 1 0 # of FTE's (full time equivalents) 1,129 Not Specified 1,360 1,100 1,295 Not Specified Footnotes: 1. Gaming revenues and visits for Kansas City, MO casinos are based on 12 months of actual performance ending on July 2009. Hollywood
- 10. October 26-27, 2009October 26-27, 2009 Wells Gaming ResearchWells Gaming Research 99 Revenue and Visits Comparison to ExistingRevenue and Visits Comparison to Existing Kansas City, MO CasinosKansas City, MO Casinos (Numbers in Millions)(Numbers in Millions) Kansas City, Missouri Casinos (Actual 2009) 1 Capacities & Amenities Phase I (2012) Full Build Out (2015) Ameristar Argosy Harrah's Isle of Capri Gaming Revenues: Applicant $201.5 $326.8 $242.4 $199.0 $197.5 $81.7 WGR $151.9 2 $255.1 2 N/A N/A N/A N/A Difference $49.6 $71.7 N/A N/A N/A N/A % Difference 24.6% 21.9% N/A N/A N/A N/A Visitor Projections: Applicant 2.86 4.35 3.57 2.70 2.82 1.53 WGR 2.15 3.29 N/A N/A N/A N/A Difference 0.71 1.06 N/A N/A N/A N/A % Difference 24.8% 24.4% N/A N/A N/A N/A Footnotes: 1. Gaming revenues and visits for Kansas City, MO casinos are based on 12 months of actual performance ending on July 2009. 2. At a 68% confidence interval, revenues can be expected to vary by +16% and -18% for Phase I, and +8% and -10% for Full Build Out. Hollywood
- 11. October 26-27, 2009October 26-27, 2009 Wells Gaming ResearchWells Gaming Research 1010