Multi-k-mer de novo transcriptome assembly and assembly of assemblies using 454 and illumina data.
•
2 recomendaciones•2,576 vistas

Jennifer Shelton KSU Multi-k-mer de novo transcriptome assembly and assembly of assemblies using 454 and illumina data. http://bioinformaticsk-state.blogspot.com/ http://bioinformatics.k-state.edu/index.html

Recomendados
Recomendados
Más contenido relacionado
Similar a Multi-k-mer de novo transcriptome assembly and assembly of assemblies using 454 and illumina data.
Similar a Multi-k-mer de novo transcriptome assembly and assembly of assemblies using 454 and illumina data. (20)
Más de Jennifer Shelton
Más de Jennifer Shelton (9)
Último
Último (20)
Multi-k-mer de novo transcriptome assembly and assembly of assemblies using 454 and illumina data.
- 1. 1/12/13 K-INBRE Bioinformatics Core Training and Education Resource 1 Leveraging multiple sequencing technologies, assembly algorithms, and assembly parameters to create a de novo transcript libraries for four non-models. Jennifer Shelton Bioinformatics Core Outreach Coordinator Kansas State University
- 2. Outline 1/12/13 K-INBRE Bioinformatics Core Training and Education Resource 2 I. Goals II. Metrics III. Background (multi-k assembly) IV. Workflow V. Results VI. Conclusions
- 3. Goals 1/12/13 K-INBRE Bioinformatics Core Training and Education Resource 3 Create a high quality reference transcriptomes of non-model plants in order to: - annotate lipid synthesis pathways - compare expression profiles
- 4. Outline 1/12/13 K-INBRE Bioinformatics Core Training and Education Resource 4 I. Goals II. Metrics III. Background (multi-k assembly) IV. Workflow V. Results VI. Conclusions
- 5. Quality metrics 1/12/13 K-INBRE Bioinformatics Core Training and Education Resource 5 1) Cumulative lengths of contigs 2) Number of contigs 3) N25, N50, N75: Order contigs smallest to largest report shortest contig representing 25, 50 or 75% of the cumulative contig length 4) Ortholog Hit Ratio: length of the putative coding region (High Scoring Pairs (HSP)) by the length of the protein
- 6. ‘Ideal’ quality metrics 1/12/13 K-INBRE Bioinformatics Core Training and Education Resource 6 1) Cumulative lengths of contigs: small 2) Number of contigs: 20-60 k 3) N25, N50, N75: Order contigs smallest to largest report shortest contig representing 25, 50 or 75% of the cumulative contig length: large 4) Ortholog Hit Ratio: length of the putative coding region (High Scoring Pairs (HSP)) by the length of the protein:1 ‘full length’
- 7. Recently reported N50 5/22/13 K-INBRE Bioinformatics Core Training and Education Resource 7 Schliesky, Simon, et al. "RNA-seq assembly–are we there yet?." Frontiers in plant science 3 (2012). Reference" Year of publication" N50" Bräutigam et al." 2011" 596 and 521" Lu et al." 2012" 884" Meyer et al. " 2012" 1308" Garg et al. " 2011" 1671" Mutasa-Göttgens" 2012" 1185 (1573 for loci above 0.5kb)" Xia et al." 2011" 485" Chibalina and Filatov" 2011" 1321" Wong" 2011" 948 and 938" Shi et al. " 2011" 506" Hyun et al. " 2012" 450" Hao et al." 2012" 408" Huang et al. " 2012" 887" Zhang et al. " 2012" 823 (616-664)"
- 8. Ortholog hit ratio in recent literature 1/12/13 K-INBRE Bioinformatics Core Training and Education Resource 8 62% ≥0.5 and 35% ≥0.8 for Daphnia pulex 64% ≥0.5 and 35% ≥0.9 for salt marsh beetle 64% ≥0.5 and 40% ≥0.8 for Gryllus bimaculatus 58% ≥0.5 and 41% ≥0.8 for Oncopeltus fasciatus Zeng V, et al. BMC Genomics. (2011) 12:581, Van Belleghem, Steven M., et al. PloS one 7.8 (2012): e42605, Zeng., et al. PLoS ONE (2013).
- 9. Outline 1/12/13 K-INBRE Bioinformatics Core Training and Education Resource 9 I. Goals II. Metrics III. Background (multi-k assembly) IV. Workflow V. Results VI. Conclusions
- 10. k-mers 1/12/13 K-INBRE Bioinformatics Core Training and Education Resource 10 http://homolog.us/Tutorials/index.php?p=3.4&s=1 A k-mer is a substring within the larger string (the read)
- 11. Assembly details: exploring the parameter space 1/12/13 K-INBRE Bioinformatics Core Training and Education Resource 11 Low expression: assembles best with low values of k High expression: assembles best with high values of k All levels of expression: assemble to full-length with a merged assembly of a range of values of k MANUSCRIPT CATEGORY: ORIGINAL PAPER Oases de novo RNA-seq assembly f Velvet and Oases assemblies on the human RNA- >100 bp Sens. (%) Spec. (%) Full Lgth. 80% lgth. 789 12.45 83.58 42 78 319 17.23 92.55 828 7437 042 16.13 89.62 92 516 504 14.97 93.0 754 6882 986 12.78 93.16 213 1986 878 10.55 94.63 429 3751 507 7.9 94.81 107 1660 012 6.67 95.99 196 1885 rags longer that 100 bp (Tfrags), nucleotide sensitivity and umber of full length or 80% length reconstructed Ensembl ers, we tested an array of parameters and ose datasets, namely n = 10, c = 3 and ABYSS (Supplementary Material). 08-20) was run with the default parameters. In length of 25 could not be modified. tails after assembly were removed using the om the EMBOSS package (Rice et al., 2000) 20 40 60 80 100 0200400600800 Expression Quantiles Reconstructedtoatleast80% Merged 19 35 k=19 k=21 k=27 k=31 k=35 Fig. 2. Comparison of single k-mer Oases assemblies and the merged assembly from kMIN=19 to kMAX=35 by Oases-M, on the human dataset. The total number of Ensembl transcripts assembled to 80% of their length is provided by RPKM gene expression quantiles of 1464 genes each. performed by Oases, it is possible to observe that this parameter http://bioinformatics.oDownloadedfrom Schulz M, et al. Bioinformatics (2012) 28:8 1086-1092.
- 12. Assembly details: exploring the parameter space 1/12/13 Gruenheit N, et al. BMC Genomics. (2012) 13:92. in assemblies that used one k-mer size. 392 of these sequences were assembled using exactly one parameter combination. Similarly, for P. cheesemanii the success of cutoffs but only 18 with all 20 k-mer sizes. 445 genes were only completely assembled with one coverage cutoff and 495 genes were only completely assembled with one 20 19 18 17 16 15 14 13 12 11 10 9 8 7 6 5 4 3 2 100 200 300 400 500 600 700 25 53 55 57 59 61 6351494745434139373533312927 k-mer coveragecutoff number of complete coding sequences Figure 1 Number of complete transcripts identified in different assemblies of P. fastigiatum reads. 380 different assemblies were made using ABySS [25,26] and a combination of (i) coverage cutoffs between 2 and 20 and (ii) k-mer sizes between 25 and 63. Transcripts covering the complete coding sequence of the homologue from A. lyrata or A. thaliana, respectively, were identified and counted. The maximum number (741) of complete transcripts was identified for coverage cutoff seven and k-mer size 41 while the lowest (70) number of complete transcripts was identified for coverage cutoff 19 and k-mer size 63. Gruenheit et al. BMC Genomics 2012, 13:92 http://www.biomedcentral.com/1471-2164/13/92 Page 4 of 19 Number of contigs assembled to full length was found to peak with k-mer values ~ 41 (~82% of genes were only assembled to over 80% with one k-mer)
- 13. Assembly details: exploring the parameter space 1/12/13 Multi-k-mer assembly improves assembly to full length and assembly of a broad range of expression quantiles
- 14. Outline 1/12/13 K-INBRE Bioinformatics Core Training and Education Resource 14 I. Goals II. Metrics III. Background (multi-k assembly) IV. Workflow V. Results VI. Conclusions
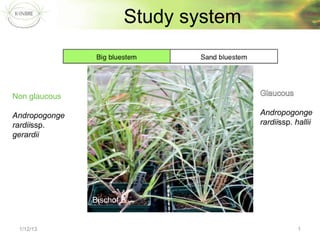
- 15. Sand bluestem assembly- complete, currently preparing reads for mapping and mapping them back, also running OHR for merged assembly. Current workflow: 454 reads A. geradii ssp. hallii ! and A. gerardii ssp. gerardii Illumina paired end reads A. geradii ssp. hallii ! and A. gerardii ssp. gerardii Tagcleaner to remove PrimeSmart sequences Prinseq to remove low quality reads and tails, reads <100bp, low entropy, poly A/T/N tails, remove identical reads MIRA MIRA assembly of 454 reads Merge MIRA assembly Oases-M Velvet assemblies using multi values of k (k=23 - k=61) Comparison of assemblies “Blind” metrics highest N25, N50, N75; cumulative length of contigs; number of contigs Blastx against Phytozome v9.0 S. bicolor protein database Ortholog hit ratio ((length of hit /3) / length of ortholog) Number of unique blast hits; number of putative paralog/ homeolog groups Sickle to remove reads with N, low quality, reads <50bp Prinseq to remove low quality reads and tails, poly A/T/N tails, remove identical reads Oases assemblies using multi values of k (k=23 - k=61) Assembly overview: workflow 1/12/13 K-INBRE Bioinformatics Core Training and Education Resource 15 1) Stringently clean 2) Assemble Illumina reads with a De Bruijn Graph assembler, and 454 with an Overlap Layout Consensus assembler 3) Merge with MIRA or CD-HIT 4) Compare assemblies with metrics based on contiguity and putative homology to closest relative
- 16. Length and number of contigs with a range of k-mers 1/12/13 K-INBRE Bioinformatics Core Training and Education Resource 16 60 145 230 315 400 23 25 27 29 31 33 35 37 39 41 43 45 47 49 51 53 55 57 59 61 MIRA(454) MIRAcluster 0 75 150 225 300 375 450 525 600 Sand bluestem assembly length and number of contigs Cumulativelengthofsequences(Mb) Assembly k-mer value or name Numberofsequences(k) Cumulative length of sequences (Mb) Number of sequences x 10^5 5.0 Sand bluestem N values 26,000 contigs after clustering
- 17. 47 57 merge CDH cluster MIRA cluster 1.168 1.948 2.932 129.331497 1.07545 1.218 1.974 2.95 111.672465 0.90385 1.404 2.23 3.299 418.762352 2.77833 1.399 2.274 3.339 96.411479 0.70852 CDH cluster 1399 2274 3 1.825 2.676 3.856 123.666263 0.59598 MIRA cluster 1825 2676 3 100 200 300 400 500 27 37 47 57 merge CDHcluster MIRAcluster 0 0.75 1.5 2.25 3 Bittersweet assembly length and number of contigs Cumulativelengthofsequences(Mb) Assembly k-mer value or name Numberofsequencesx10^5 Cumulative length of sequences (Mb) Number of sequences x 10^5 1.1 1.8 2.6 3.3 4.0 27 37 47 57 merge CDHcluster MIRAcluster Bittersweet N values Contiglength(kb) Assembly k-mer value or name N75 (kb) N50 (kb) N25 (kb) Length and number of contigs with a range of k-mers 1/12/13 K-INBRE Bioinformatics Core Training and Education Resource 17 60-70,000 contigs after clustering
- 18. 37 47 57 merge CDH cluster MIRA cluster 1.206 2.008 3.087 128.100083 1.1091 37 1.206 2.00 1.195 1.977 3.051 113.176134 0.93839 47 1.195 1.97 1.271 2.035 3.096 102.507455 0.82755 57 1.271 2.03 1.41 2.211 3.331 345.752982 2.31102 merge 1.41 2.21 1.44 2.27 3.422 84.202533 0.59174 CDH cluster 1440 2270 1.804 2.69 3.941 105.920843 0.50279 MIRA cluster 1804 2690 1.1 1.7 2.3 2.8 3.4 4.0 27 37 47 57 merge CDHcluster MIRAcluster Balsam N values Contiglength(kb) Assembly k-mer value or name N75 (kb) N50 (kb) N25 (kb) 80 185 290 395 500 27 37 47 57 merge CDHcluster MIRAcluster 0 0.75 1.5 2.25 3 Balsam assembly length and number of contigsCumulativelengthofsequences(Mb) Assembly k-mer value or name Numberofsequencesx10^5 Cumulative length of sequences (Mb) Number of sequences x 10^5 Length and number of contigs with a range of k-mers 1/12/13 K-INBRE Bioinformatics Core Training and Education Resource 18 50-60,000 contigs after clustering
- 19. N25, N50, N75 across a range of k-mer values 1/12/13 K-INBRE Bioinformatics Core Training and Education Resource 19 Duan, Jialei, et al. BMC genomics 13.1 (2012): 392. Meyer E, et al. The Plant Journal. (2012) 70: 879-890. Liu, Mingying, et al. PloS one (2012) 7.10. Chouvarine, Philippe, et al. PloS one 7.1 (2012): e29850. MIRA MIRAc Assembly k-mer value or name Cumulative length of sequences (Mb) Number of sequences x 10^5 0.4 1.6 2.7 3.9 5.0 23 25 27 29 31 33 35 37 39 41 43 45 47 49 51 53 55 57 59 61 MIRA(454) MIRAcluster Sand bluestem N values Contiglength(kb) Assembly k-mer value or name N75 (kb) N50 (kb) N25 (kb) Sand bluestem’s N50 is 3.2 kb after clustering Other published N50 values: wheat 1.4 kb Panicum hallii 1.3 kb Ma Bamboo 1.1 kb Miscanthus 0.7 kb
- 20. N25, N50, N75 across a range of k-mer values 1/12/13 K-INBRE Bioinformatics Core Training and Education Resource 20 Duan, Jialei, et al. BMC genomics 13.1 (2012): 392. Meyer E, et al. The Plant Journal. (2012) 70: 879-890. Liu, Mingying, et al. PloS one (2012) 7.10. Chouvarine, Philippe, et al. PloS one 7.1 (2012): e29850. Bittersweet’s N50 is 2.3-2.7 kb after clustering Other published N50 values: wheat 1.4 kb Panicum hallii 1.3 kb Ma Bamboo 1.1 kb Miscanthus 0.7 kb 0.59598 MIRA cluster 1825 2676 3856 123666263 59598Numberofsequencesx10^5 1.1 1.8 2.6 3.3 4.0 27 37 47 57 merge CDHcluster MIRAcluster Bittersweet N values Contiglength(kb) Assembly k-mer value or name N75 (kb) N50 (kb) N25 (kb)
- 21. N25, N50, N75 across a range of k-mer values 1/12/13 K-INBRE Bioinformatics Core Training and Education Resource 21 Duan, Jialei, et al. BMC genomics 13.1 (2012): 392. Meyer E, et al. The Plant Journal. (2012) 70: 879-890. Liu, Mingying, et al. PloS one (2012) 7.10. Chouvarine, Philippe, et al. PloS one 7.1 (2012): e29850. Bittersweet’s N50 is 2.3-2.7 kb after clustering Other published N50 values: wheat 1.4 kb Panicum hallii 1.3 kb Ma Bamboo 1.1 kb Miscanthus 0.7 kb 2.31102 merge 1.41 2.211 3.331 345.752982 2.31102 0.59174 CDH cluster 1440 2270 3422 84202533 59174 0.50279 MIRA cluster 1804 2690 3941 105920843 50279 1.1 1.7 2.3 2.8 3.4 4.0 27 37 47 57 merge CDHcluster MIRAcluster Balsam N values Contiglength(kb) Assembly k-mer value or name N75 (kb) N50 (kb) N25 (kb)
- 22. Ortholog hit ratio with a range of k-mers 1/12/13 K-INBRE Bioinformatics Core Training and Education Resource 22 Numberofcontigsx103 Ortholog hit ratio 0 8 16 24 32 0 0.1 0.2 0.3 0.4 0.5 0.6 0.7 0.8 0.9 1 1.1 1.2 1.3 1.4 1.5 mira 23 25 27 29 31 33 35 37 39 41 43 45 47 49 51 53 55 57 59 61 ** Note: This algorithm varies slightly from the final OHR alogorithm I used in slide 27
- 23. Ortholog hit ratio in recent literature 1/12/13 Gruenheit N, et al. BMC Genomics. (2012) 13:92. in assemblies that used one k-mer size. 392 of these sequences were assembled using exactly one parameter combination. Similarly, for P. cheesemanii the success of cutoffs but only 18 with all 20 k-mer sizes. 445 genes were only completely assembled with one coverage cutoff and 495 genes were only completely assembled with one 20 19 18 17 16 15 14 13 12 11 10 9 8 7 6 5 4 3 2 100 200 300 400 500 600 700 25 53 55 57 59 61 6351494745434139373533312927 k-mer coveragecutoff number of complete coding sequences Figure 1 Number of complete transcripts identified in different assemblies of P. fastigiatum reads. 380 different assemblies were made using ABySS [25,26] and a combination of (i) coverage cutoffs between 2 and 20 and (ii) k-mer sizes between 25 and 63. Transcripts covering the complete coding sequence of the homologue from A. lyrata or A. thaliana, respectively, were identified and counted. The maximum number (741) of complete transcripts was identified for coverage cutoff seven and k-mer size 41 while the lowest (70) number of complete transcripts was identified for coverage cutoff 19 and k-mer size 63. Gruenheit et al. BMC Genomics 2012, 13:92 http://www.biomedcentral.com/1471-2164/13/92 Page 4 of 19 Number of contigs assembled to full length was found to peak with k-mer values ~ 41 (similar to our peak at k = 47)
- 24. Ortholog hit ratio for bluestem 1/12/13 K-INBRE Bioinformatics Core Training and Education Resource 24 59 61 MIRA cluster 0.4768073818 0.2972410611 0.4619314293 0.2767591755 0.7127479439 0.5199564586 0 5000 10000 15000 20000 25000 30000 35000 40000 0 0.1 0.2 0.3 0.4 0.5 0.6 0.7 0.8 0.9 1 1.1 1.2 1.3 1.4 1.5 OHR histogram Numberofcontigs OHR bins 23 25 27 29 31 33 35 37 39 41 43 45 47 49 51 53 55 57 59 61 MIRA cluster The number of contigs is lower but the OHR histogram of the clustered assembly has proportionally fewer fragmented contigs
- 25. 1.5 ter 0% 10% 20% 30% 40% 50% 60% 70% 80% 23 25 27 29 31 33 35 37 39 41 43 45 47 49 51 53 55 57 59 61 MIRAcluster Percentage of > 50% and > 80% full length contigs with a blast hit Contigswithablashitoverthreshold Assembly Greater than 50% Greater than 80% Are the sequences with hits closer to full length? 1/12/13 K-INBRE Bioinformatics Core Training and Education Resource 25
- 26. Ortholog hit ratio in recent literature 1/12/13 K-INBRE Bioinformatics Core Training and Education Resource 26 51% ≥0.5 and 33% ≥0.8. for bluestem k(39-45) 71% ≥0.5 and 52% ≥0.8. for bluestem 62% ≥0.5 and 35% ≥0.8 for Daphnia pulex 64% ≥0.5 and 35% ≥0.9 for salt marsh beetle 64% ≥0.5 and 40% ≥0.8 for Gryllus bimaculatus 58% ≥0.5 and 41% ≥0.8 for Oncopeltus fasciatus Zeng V, et al. BMC Genomics. (2011) 12:581, Van Belleghem, Steven M., et al. PloS one 7.8 (2012): e42605, Zeng., et al. PLoS ONE (2013).
- 27. Conclusions 1/12/13 K-INBRE Bioinformatics Core Training and Education Resource 27 1) Metrics based on contiguity suggest that many of the Illumina assemblies are highly contiguous compared to recent de novo plant transcriptomes 2) Metrics based on OHR suggest the assembly is accurate and the multi-k-mer method and clustering steps are improving the quality of the assembly 3) 454 data appears to have been less cost efficient than the Illumina data (in terms of all metrics accept cumulative length of assembly)
- 28. Acknowledgments 1/12/13 K-INBRE Bioinformatics Core Training and Education Resource 28 Nic Herndon, Sanjay Chellapilla, Alina Akhunova, Eduard Akhunov, Hanquan Liang, Loretta C Johnson, Susan J. Brown
- 29. Questions? 1/12/13 K-INBRE Bioinformatics Core Training and Education Resource 29