SlideShare una empresa de Scribd logo
1 de 1
Descargar para leer sin conexión
1
Performance is calculated on I class shares, pre management fees of between 1.50% and 2.25% per annum
2
Performance inception date is 31 July 2009
3
The UBS Developed Infrastructure & Utilities Index is a USD hedged, total return index
IMPORTANT NOTES
This report has been prepared for information only, and it does not represent an offer to purchase or subscribe for shares. While Nucleus Global Investors Pty Ltd ( Nucleus ) believes that the information is correct at the date of
production, no warranty or representation is given to this effect and no liability can be assumed for the correctness or accuracy of the given information, which may be subject to change at any time, without notice. Returns can be
volatile, reflecting increases and decreases in the value of underlying investments. Changes in market conditions and exchange rates can cause a decrease or an increase in the share value. Past performance does not guarantee the same
results in the future.
The WIOF Global Listed Utilities Fund (the Fund ) is a sub fund of World Investment Opportunities Funds (the SICAV ), an open-ended investment company registered on the official list of collective investment undertakings pursuant to
part I of the Luxembourg law of 20th December 2002 on collective investment undertakings (the 2002 Law ). Julius Baer (Luxembourg) S.A is the designated management company of the SICAV, authorised under the provisions of
Chapter 13 of the 2002 Law. Applications can only be made on the form in the current WIOF Prospectus dated April 2010. Prospectus can be obtained by contacting the Nucleus investment team on
+61 2 9356 2866, by fax +61 2 9357 6640, or by emailing kteale@nucleusglobal.com.au or at http://www.wiof.eu/institutional/download/prospectus/. Before investing in the Fund, investors should contact their financial adviser and refer
to all relevant documents relating to the Fund, such as the latest annual report and prospectus, which specify the particular risks associated with the Fund, together with any specific restrictions applying, and the basis of dealing. In the
event an investor chooses not to seek advice from a financial adviser, he should consider whether the Fund is a suitable investment for him.
WIOF Global Listed Utilities Fund December
2011
Performance Summary (total return before fees) Performance 1
1 Month 3 Months 12 Months Inception 2
WIOF Global Listed Utilities Fund 1.8% 3.6% 6.6% 23.3%
Benchmark (UBS Developed Infrastructure & Utilities Index 3
) 1.3% 4.7% 1.2% 16.3%
Overview
The fund s share price increased by 3.6% over the quarter, compared to a 4.7%
increase in our benchmark index. Equity markets had a good quarter, driven
primarily by optimism about the US economy, which is growing faster than most
economists had predicted. The better economic performance has been driven
primarily by stronger consumer spending, as US consumers have become more
confident about the prospects for the US economy and unemployment levels
continue to fall. The S&P 500 rose by 11.2%, dragging most European markets
with it - the FTSE 350 rose by 7.9% and Germany s DAX increased by 7.2%.
Equities were flat in Italy and Spain though as markets continued to worry about
the possibility of sovereign default and the associated impact this would have on
the European banking sector.
The underperformance of the fund over the quarter was due to stock selection,
specifically the fact that the fund did not hold positions in El Paso Corp, The
Williams Companies or ONEOK Inc, which together account for approximately 4%
of our benchmark index. All three companies are integrated gas producers and
distributors who own and operate both gas exploration and production businesses
and large pipeline networks in the United States. During the quarter, Kinder
Morgan (a leading pipeline transportation and energy storage company in North
America) made a takeover bid for El Paso at a premium of almost 50% to its pre
bid share price. This also drove up the price of The Williams Companies and
ONEOK Inc, which were both seen as being in play after the bid. The share price
of both companies rose by over 30% in response. The fund did not own stakes in
any of these companies due to the fact that they derive a large part of their
income from gas exploration and production, which can exhibit very volatile
earnings and which we don t consider as a utility or infrastructure business.
The best performing stocks in the fund over the quarter were all US electricity
utilities - Idacorp +13.1%, Xcel Energy +13.0% and Ameren Corp +12.6%. The
worst performing were Inmarsat (a global satellite operator) -15.7%, CLP Holdings
(a Hong Kong electricity utility) -5.7% and Osaka Gas Co (a gas utility) -5.6%.
Portfolio Changes
During the quarter, we established positions in Atmos Energy Corp, Northeast
Utilities, Tokyo Gas Co and Xcel Energy. We exited positions in E.On, Flughafen
Wien, Fortum, and Cleco Corp.
Outlook
Whilst the ECB s provision of EUR 500 Bn in liquidity to just over 500 European banks in December has reduced the probability of a banking
crisis, Europe s banks are not out of the woods yet. According to the European Banking Authority, the continent s banks need to raise at least
EUR 115 Bn by June 2012 in order to comply with their minimum core tier one capital ratio requirements. We think the EBA s estimate is
hopelessly optimistic and the true amount needed to cope with the looming sovereign debt problems is more like three to five times this
amount. Not only are banks keen to avoid the earnings dilution associated with having to raise large amounts of equity at big discounts to
their already depressed share prices, they aren t finding the capital easy to raise. Many appear to have taken the view that they are happy to
shrink their balance sheets to minimise the amount they have to raise, meaning European credit markets will likely remain tight for some
time. This does not bode well for growth in the region. Whilst most of Europe looks to be sliding into recession, across the Atlantic the news
is far better. The US economy continues to grow steadily and importantly, employment continues to grow which in turn supports consumer
spending. Even the much maligned housing market appears to be showing signs of bottoming. We expect the US economy to continue to
outperform that of the Eurozone in 2012 and think it likely the fund will continue to maintain an overweight position in the US for some time.
The fund also holds an overweight position in regulated utilities. We think 2012 is likely to be a tough year for the world economy generally
and in addition to being quite attractive value, earnings for regulated utilities tend to hold up well even in poor economic conditions.
Regulated Utility
57%
Semi Regulated
Utility
29%
Communications
Infrastructure
6%
Rail
3%
Cash
5%
Sector Allocation
US
57%
Europe ex UK
4%
UK
11%
Japan
9%
Asia excl. Japan
7%
Canada
6%
Cash
5%
Geographic Allocation
Company Name Country Sector
% of
Portfolio
National Grid PLC UK Regulated Utility 5.5%
Consolidated Edison Inc US Regulated Utility 5.1%
Duke Energy Corp US Regulated Utility 4.6%
SES Luxembourg Communications Infrastructure 4.0%
Scottish & Southern Energy UK Semi Regulated Utility 4.0%
Top 5 Holdings

Más contenido relacionado

Más de Ken Teale

Quarterly reports - WIOF Global Listed Utilities Fund
Quarterly reports - WIOF Global Listed Utilities FundQuarterly reports - WIOF Global Listed Utilities Fund
Quarterly reports - WIOF Global Listed Utilities FundKen Teale
 
Sep 2011 Quarterly Report - WIOF Global Utilities Fund
Sep 2011 Quarterly Report - WIOF Global Utilities FundSep 2011 Quarterly Report - WIOF Global Utilities Fund
Sep 2011 Quarterly Report - WIOF Global Utilities FundKen Teale
 
Mar 2011 Quarterly Report - WIOF Global Utilities Fund
Mar 2011 Quarterly Report - WIOF Global Utilities FundMar 2011 Quarterly Report - WIOF Global Utilities Fund
Mar 2011 Quarterly Report - WIOF Global Utilities FundKen Teale
 
Sep 2010 Quarterly Report - WIOF Global Utilities Fund
Sep 2010 Quarterly Report - WIOF Global Utilities FundSep 2010 Quarterly Report - WIOF Global Utilities Fund
Sep 2010 Quarterly Report - WIOF Global Utilities FundKen Teale
 
Dec 2009 Quarterly Report - WIOF Global Utilities Fund
Dec 2009 Quarterly Report - WIOF Global Utilities FundDec 2009 Quarterly Report - WIOF Global Utilities Fund
Dec 2009 Quarterly Report - WIOF Global Utilities FundKen Teale
 

Más de Ken Teale (10)

Quarterly reports - WIOF Global Listed Utilities Fund
Quarterly reports - WIOF Global Listed Utilities FundQuarterly reports - WIOF Global Listed Utilities Fund
Quarterly reports - WIOF Global Listed Utilities Fund
 
Sep 2011 Quarterly Report - WIOF Global Utilities Fund
Sep 2011 Quarterly Report - WIOF Global Utilities FundSep 2011 Quarterly Report - WIOF Global Utilities Fund
Sep 2011 Quarterly Report - WIOF Global Utilities Fund
 
a
aa
a
 
b
bb
b
 
Mar 2011 Quarterly Report - WIOF Global Utilities Fund
Mar 2011 Quarterly Report - WIOF Global Utilities FundMar 2011 Quarterly Report - WIOF Global Utilities Fund
Mar 2011 Quarterly Report - WIOF Global Utilities Fund
 
c
cc
c
 
d
dd
d
 
e
ee
e
 
Sep 2010 Quarterly Report - WIOF Global Utilities Fund
Sep 2010 Quarterly Report - WIOF Global Utilities FundSep 2010 Quarterly Report - WIOF Global Utilities Fund
Sep 2010 Quarterly Report - WIOF Global Utilities Fund
 
Dec 2009 Quarterly Report - WIOF Global Utilities Fund
Dec 2009 Quarterly Report - WIOF Global Utilities FundDec 2009 Quarterly Report - WIOF Global Utilities Fund
Dec 2009 Quarterly Report - WIOF Global Utilities Fund
 

Dec 2011 Quarterly Report - WIOF Global Utilities Fund

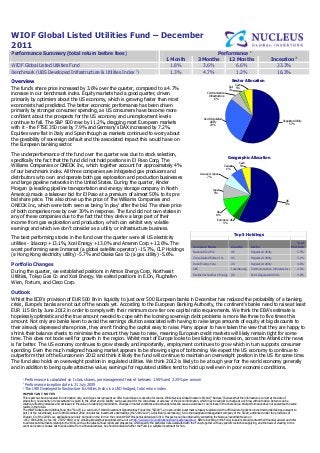
  • 1. 1 Performance is calculated on I class shares, pre management fees of between 1.50% and 2.25% per annum 2 Performance inception date is 31 July 2009 3 The UBS Developed Infrastructure & Utilities Index is a USD hedged, total return index IMPORTANT NOTES This report has been prepared for information only, and it does not represent an offer to purchase or subscribe for shares. While Nucleus Global Investors Pty Ltd ( Nucleus ) believes that the information is correct at the date of production, no warranty or representation is given to this effect and no liability can be assumed for the correctness or accuracy of the given information, which may be subject to change at any time, without notice. Returns can be volatile, reflecting increases and decreases in the value of underlying investments. Changes in market conditions and exchange rates can cause a decrease or an increase in the share value. Past performance does not guarantee the same results in the future. The WIOF Global Listed Utilities Fund (the Fund ) is a sub fund of World Investment Opportunities Funds (the SICAV ), an open-ended investment company registered on the official list of collective investment undertakings pursuant to part I of the Luxembourg law of 20th December 2002 on collective investment undertakings (the 2002 Law ). Julius Baer (Luxembourg) S.A is the designated management company of the SICAV, authorised under the provisions of Chapter 13 of the 2002 Law. Applications can only be made on the form in the current WIOF Prospectus dated April 2010. Prospectus can be obtained by contacting the Nucleus investment team on +61 2 9356 2866, by fax +61 2 9357 6640, or by emailing kteale@nucleusglobal.com.au or at http://www.wiof.eu/institutional/download/prospectus/. Before investing in the Fund, investors should contact their financial adviser and refer to all relevant documents relating to the Fund, such as the latest annual report and prospectus, which specify the particular risks associated with the Fund, together with any specific restrictions applying, and the basis of dealing. In the event an investor chooses not to seek advice from a financial adviser, he should consider whether the Fund is a suitable investment for him. WIOF Global Listed Utilities Fund December 2011 Performance Summary (total return before fees) Performance 1 1 Month 3 Months 12 Months Inception 2 WIOF Global Listed Utilities Fund 1.8% 3.6% 6.6% 23.3% Benchmark (UBS Developed Infrastructure & Utilities Index 3 ) 1.3% 4.7% 1.2% 16.3% Overview The fund s share price increased by 3.6% over the quarter, compared to a 4.7% increase in our benchmark index. Equity markets had a good quarter, driven primarily by optimism about the US economy, which is growing faster than most economists had predicted. The better economic performance has been driven primarily by stronger consumer spending, as US consumers have become more confident about the prospects for the US economy and unemployment levels continue to fall. The S&P 500 rose by 11.2%, dragging most European markets with it - the FTSE 350 rose by 7.9% and Germany s DAX increased by 7.2%. Equities were flat in Italy and Spain though as markets continued to worry about the possibility of sovereign default and the associated impact this would have on the European banking sector. The underperformance of the fund over the quarter was due to stock selection, specifically the fact that the fund did not hold positions in El Paso Corp, The Williams Companies or ONEOK Inc, which together account for approximately 4% of our benchmark index. All three companies are integrated gas producers and distributors who own and operate both gas exploration and production businesses and large pipeline networks in the United States. During the quarter, Kinder Morgan (a leading pipeline transportation and energy storage company in North America) made a takeover bid for El Paso at a premium of almost 50% to its pre bid share price. This also drove up the price of The Williams Companies and ONEOK Inc, which were both seen as being in play after the bid. The share price of both companies rose by over 30% in response. The fund did not own stakes in any of these companies due to the fact that they derive a large part of their income from gas exploration and production, which can exhibit very volatile earnings and which we don t consider as a utility or infrastructure business. The best performing stocks in the fund over the quarter were all US electricity utilities - Idacorp +13.1%, Xcel Energy +13.0% and Ameren Corp +12.6%. The worst performing were Inmarsat (a global satellite operator) -15.7%, CLP Holdings (a Hong Kong electricity utility) -5.7% and Osaka Gas Co (a gas utility) -5.6%. Portfolio Changes During the quarter, we established positions in Atmos Energy Corp, Northeast Utilities, Tokyo Gas Co and Xcel Energy. We exited positions in E.On, Flughafen Wien, Fortum, and Cleco Corp. Outlook Whilst the ECB s provision of EUR 500 Bn in liquidity to just over 500 European banks in December has reduced the probability of a banking crisis, Europe s banks are not out of the woods yet. According to the European Banking Authority, the continent s banks need to raise at least EUR 115 Bn by June 2012 in order to comply with their minimum core tier one capital ratio requirements. We think the EBA s estimate is hopelessly optimistic and the true amount needed to cope with the looming sovereign debt problems is more like three to five times this amount. Not only are banks keen to avoid the earnings dilution associated with having to raise large amounts of equity at big discounts to their already depressed share prices, they aren t finding the capital easy to raise. Many appear to have taken the view that they are happy to shrink their balance sheets to minimise the amount they have to raise, meaning European credit markets will likely remain tight for some time. This does not bode well for growth in the region. Whilst most of Europe looks to be sliding into recession, across the Atlantic the news is far better. The US economy continues to grow steadily and importantly, employment continues to grow which in turn supports consumer spending. Even the much maligned housing market appears to be showing signs of bottoming. We expect the US economy to continue to outperform that of the Eurozone in 2012 and think it likely the fund will continue to maintain an overweight position in the US for some time. The fund also holds an overweight position in regulated utilities. We think 2012 is likely to be a tough year for the world economy generally and in addition to being quite attractive value, earnings for regulated utilities tend to hold up well even in poor economic conditions. Regulated Utility 57% Semi Regulated Utility 29% Communications Infrastructure 6% Rail 3% Cash 5% Sector Allocation US 57% Europe ex UK 4% UK 11% Japan 9% Asia excl. Japan 7% Canada 6% Cash 5% Geographic Allocation Company Name Country Sector % of Portfolio National Grid PLC UK Regulated Utility 5.5% Consolidated Edison Inc US Regulated Utility 5.1% Duke Energy Corp US Regulated Utility 4.6% SES Luxembourg Communications Infrastructure 4.0% Scottish & Southern Energy UK Semi Regulated Utility 4.0% Top 5 Holdings