BearingPoint: Beyond the horizon of retail analytics
•
1 recomendación•1,160 vistas

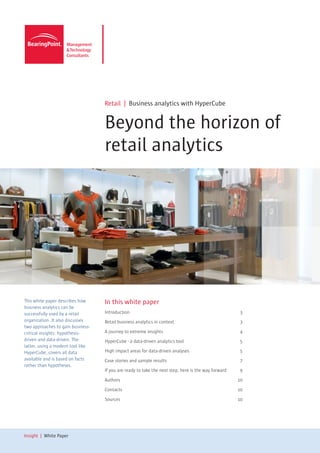
This white paper describes how business analytics can be successfully used by a retail organization. It also discusses two approaches to gain business-critical insights: hypothesis-driven and data-driven. The latter, using a modern tool like HyperCube, covers all data available and is based on facts rather than hypotheses.

Recomendados
Recomendados
Más contenido relacionado
La actualidad más candente
La actualidad más candente (20)
Destacado
Destacado (20)
Similar a BearingPoint: Beyond the horizon of retail analytics
Similar a BearingPoint: Beyond the horizon of retail analytics (20)
Último
Último (20)
BearingPoint: Beyond the horizon of retail analytics
- 1. Retail | Business analytics with HyperCube Beyond the horizon of retail analytics This white paper describes how In this white paper business analytics can be successfully used by a retail Introduction 3 organization. It also discusses Retail business analytics in context 3 two approaches to gain business- critical insights: hypothesis- A journey to extreme insights 4 driven and data-driven. The HyperCube - a data-driven analytics tool 5 latter, using a modern tool like HyperCube, covers all data High impact areas for data-driven analyses 5 available and is based on facts Case stories and sample results 7 rather than hypotheses. If you are ready to take the next step, here is the way forward 9 Authors 10 Contacts 10 Sources 10 Insight | White Paper
- 2. A majority of retailers are missing out on business-critical insights to drive growth and profitability simply because they have chosen the wrong approach to business analytics and therefore will not receive answers to the right questions1. 2 Insight | Perspective
- 3. Introduction Do you have doubts about your business model? Wonder whether you will make your budget or not, if your analyses were the right ones and if they gave you the insights you needed? Have you considered that analyses based on hypotheses can never reach deeper insights than those of the person making the hypotheses? BearingPoint experiences that a majority of retailers are missing out on business-critical insights to drive growth and profitability simply because they have chosen the wrong approach to business analytics and therefore will not receive answers to the right questions. This white paper will address just that, in an environment that has never been so complex and as massively overloaded with information as it is today. We will describe the context of business analytics in retail, the overload of information and business subjects where questions are commonly asked to improve business performance. We will then address two diametric approaches to business analytics, recommend when to use what approach and conclude that understanding and practicing one of them, data-driven analysis, is vital to attain business advantage in retail today. New tools are available to manage this approach and we will present and discuss around a leading one: HyperCube. You will learn about how this tool and how the approach of data-driven analysis are put into practice on two areas where many retailers struggle for answers: store performance and marketing effectiveness. With these new insights, it is only natural to wonder how you and your company can reap the benefits of this opportunity. At the end of the white paper, we present our five-step approach and methodology for how to get started. Retail business analytics in context Retailers around the world offer their customers a vast variety of products, but how do they know what their customers want to buy? The answer to this question and many other related ones is what retailers would like to know. And by using business intelligence and business analytic methods they can! The main purpose for companies to use business analytics is to gain a competitive advantage. By using different tools, models and skills this can be done in a number of ways. Below, we briefly present some commonly known business issues within retail today2 and what potential benefits and insights could be gained from business analytics to help address those issues. Business issues Potential benefits from business analytics Enhance assortment and shelf space Know what products to sell in the store. management Out of stock Improve stock levels to never run out or tie up unnecessary capital. Planning new stores and their locations Match the store design with surrounding preferences from its given location to improve profit. Know your customers when marketing Understand customer behaviors and needs by developing a closer relationship with them. Improve the marketing mix Understand what motivates customers to make a purchase and use advertisement, promotions and offerings to trigger their willingness to buy. Price optimization Increase profit by charging the exact price a customer is willing to pay for a product at a certain moment. Forecasting Anticipate customers’ demands for the future and plan ahead to increase profit. Insight | White Paper 3
- 4. Retail | Business analytics with HyperCube One of the major challenges that retailers face when it comes to business analytics is Figure 1: Hypotheses-driven approaches knowing how to get started. They often do not know exactly what data to collect, how to are dependent on the hypotheses that collect it, how to analyze and use it to gain insights that will help drive growth and specialists, statisticians, and other profitability. On the other hand, it is no secret that retailers collect enormous amounts experts prepare for providing insights of data every day. This is basic sales data and is often output from sales systems (cash into business issues. register), purchasing systems or a loyalty program. And for basic analyses this is often more than enough. But when the objectives of the business analyses are to gain more spectacular insights that really make a difference, other areas of data input often need to be taken into consideration. Depending on what business areas a company would like to focus the business analyses on, the input data may need to be collected from a number of different sources. Such input, which to the naked eye may appear as irrelevant data, could be for example: • Average cleaning time of a store • Time and place of shopliftings • Average number of faulty products in a delivery • Number of lights per square meter in a store • Open floor area as a percentage of the total floor area of a store • Each week’s number of products advertised in the weekly flyer …and much more. Questions Models Questions Hypotheses To make the most out of business analytics, some changes in how to identify what data Questions Reports to collect may need to be considered. BearingPoint experiences that only a few retailers have invested enough resources to collect the right data to serve as base for business analytics approaches. If they do, however, their possibilities to gain extreme insights from business analytics are significantly increased. In the following chapter, we provide deeper insight into alternative approaches to make use of the collected data and our recommendations on when to use a certain type of approach. Figure 2: Data-driven approaches make A journey to extreme insights use of the data from many different What would be the right business analytics approach to use to gain these extreme sources and provide insights by letting insights? Formulating the questions is often the easy part but finding the answer is the data tell the story behind the more difficult. Also remember that analyses based on hypotheses can never reach deeper business outcomes. insights than those of the person making the hypotheses. We present two diametric business analytics approaches below: hypotheses-driven and data-driven. Hypotheses-driven approaches Hypotheses-driven analyses (see figure 1) are conducted by first looking at a problem, considering how to describe that problem, and then creating a model to describe it. This method is based on a hypothesis developed about a situation and how different factors will influence the results. An example would be that one believes there is a clear connection between average spending and the holiday season, e.g. that spending increases in connection with major holidays. This is tested by first creating an hypotheses-driven model, and then checking to see if the model’s predictions fit the outcome. If that is the case, then this is a model that describes the situation. Data-driven approaches Answers Data-driven analyses (see figure 2) are a different and a modern approach on how to gain Business insights based on data. Data-driven analysis do not start with a model or hypotheses outcomes about a situation to be understood. The focus is rather on understanding the root-cause behind a phenomenon – letting the data tell the story behind the situation and then letting the patterns in that data provide insights into what is going on. An example of this would be to have weekly sales data from a retailer’s different sales channels. 4 Insight | White Paper
- 5. A data-driven analysis would find the peaks surrounding holiday seasons, and based on Figure 3: BearingPoint experience of the peaks around the holiday season suggest the insight that there may be a connection how suitable hypotheses-driven and relating sales levels to the timing before the holiday season. data-driven methods are handling different analytics problems1 What is the difference between the two approaches? Hypothesis-driven Data-driven approaches approaches The crucial difference between the two approaches is whether to let data or hypotheses Enhance assortment and tell the story. In essence it can be summarized as hypotheses-driven analyses can never shelf space management reach deeper insights than those of the person making the hypotheses. Data-driven Out of stock analyses can provide insights into the underlying root causes of a problem, without the Planning new stores and their locations hypotheses specifying beforehand what these root causes may be. Know your customers when marketing The hypotheses-driven approach is often the right approach to use for solving issues that Improve the marketing mix are of a more simple nature (see figure 3). Typically these issues are easy to describe in a Price optimization model, repeat themselves over and over again, and with only a few factors needed to Forecasting influence the results. The holiday season sales example above is a great example of where to use hypotheses-driven approach tools for forecasting. = covers most issues = covers some issues = covers many issues = covers a few issues BearingPoint analytics subject matter experts estimate that approximately 20 percent of all applicable business problems and the data describing them can be covered by an hypotheses-driven approach. But what about the problems that are more complex, where more than a few factors act together to create unexpected, and usually unwanted results? Examples of such problems are marketing campaign in-efficiency, low store “Conventional hypotheses-driven tools profitability and decreasing customer loyalty. To outperform the competition in the only cover 20 percent of all business market the root-causes behind these problems need to be understood. problems and the data describing them and produces trends or generalities1”. HyperCube—a data-driven analytics tool Augustin Huret BearingPoint has developed a methodology that has been used in more than 300 founder HyperCube projects to understand clients’ business issues and analytical problems by using data-driven tools as the approach. The methodology is strongly connected to BearingPoint’s software-as-a-service (SaaS) solution called HyperCube, a data-driven based analytics tool. The HyperCube algorithm is useful in identifying underlying business issues and in generating clear and implementable business insights. HyperCube Hypercube explores is created to exhaustively analyze large amounts of data to understand the root causes behind a business issue. It is the result of 15 years of research in applied mathematics information unbiased, and was originally developed at the École Polytechnique near Paris. The tool is based on completely and provides a mathematical algorithm and analyzes large amounts of data to generate easy to results with three times understand, formal rules for implementation in the organization. HyperCube handles missing and incomplete data sets, it does not rely on averages or best-fit lines and more precision than usual identifies trends before they become statistically relevant. hypotheses-driven methods3. High impact areas for data-driven analyses Throughout the history of retail, there has been one mantra believed to be the root of success: growth. Being big is good and the force of economies of scale can never be tampered with. Over time profitability may vary, but as long as there is growth or at least a feasible plan for it, companies tend to accept and get away with short-term profitability deviations. Finding that golden key to growth is on everyone’s mind no matter if the company is a market leader or in severe financial distress. Business analytics in retail correspondingly tend to be focused on finding the growth- driving levers. Also, to begin a journey to more advanced business analytics you will find more enthusiasm to approach a growth or profit-driving area. To illustrate how the data-driven approach can be applied, we have chosen two business issues that most retailers can easily relate to: levers for improved store performance and increased promotion and campaign accuracy. Insight | White Paper 5
- 6. Retail | Business analytics with HyperCube HyperCube analyzes large Levers for improved store performance Retailers, and specifically retail chains, are well aware of the key drivers for store amounts of data to performance. Measuring performance in growth, profitability, sales per square meter generate easy to and so forth. There is no such thing as “being unlucky” on profitability when opening a new store – it is about whether a good job was done in designing and executing on the understand, formal rules for plan or not, and advanced analytics are rarely needed to come up with the underlying implementation in the reasons. Just asking the customers will take the retailers at least half-way. organization. Comparing the performance of stores is typically done by explaining differences by their location, maturity on the market and local competition. But what about staff behavior? The number of rainy days per year? The shelf length and height for different sub-categories? Cleaning routines? The energy consumed by display lights? The size of the parking lot? The number of campaigns in each category per year? Differences in assortment? Adherence to central planograms? The income level of the average There is no such thing as shopper? And even better, what about combining these less commonly used factors with “being unlucky” on the typical explanatory factors and thereby finding suitable combinations that could profitability when opening unveil unheard of potential? Adding several factors with less obvious relevance to store performance includes great difficulty to ask the right questions. In this case, the a new store. data-driven approach would be the right choice. The result may turn out to be as expected, but is also likely to provide totally unexpected insights and findings. Increased marketing effectiveness An increased set of sales channels, loyalty programs and the use of add-on services such as insurance and banking have exploded the amount of customer data available to retailers. The stream of information often goes across functions, organizations and sometimes even legal entities. Retail companies, aiming at executing day-to-day operations, are seldom organized to take benefit of all relevant opportunities that the data offers. But the customers start to realize that they let go of their integrity and demand to be treated better, more precisely – especially when it comes to promotions. When being treated as just anybody, however, they may quickly re-evaluate their choice of store and shift to another. Customer disloyalty is not a new phenomenon but does increase and is predicted to increase further. Combining data from many sources and drawing conclusions is difficult, especially when Customer disloyalty is not a the behavior behind the data comes from the purchase of very different products and new phenomenon but does services. A customer may behave as a family provider when buying groceries, a music increase and is predicted to traditionalist when downloading music and a risk-averse policyholder when signing up for insurance. Asking the right question, that is making a sound hypothesis, to design increase further. promotions becomes almost impossible. In this case, a data-driven approach would be suitable because it is not based on models and hypotheses. Using HyperCube, vast amounts of data in different shapes and forms is no restriction. 6 Insight | White Paper
- 7. Case stories and sample results BearingPoint has used its methodology together with HyperCube when analyzing business issues facing retailers in many countries. One of these projects was related to understanding the business drivers behind high-performing retail stores within an optician’s retail network. Another project helped solve the business issue of improving marketing effectiveness for a major international hypermarket retailer. These two projects are described in more detail below. Understanding the business drivers behind high-performing optician Examples of insights generated using HyperCube (Retail network retail stores performance): Situation To understand the driving factors The client is a market-leading retail optician’s chain in Europe with about 1,200 retail behind high performing optician stores, stores and 15 percent of the market share. When the client was facing issues with HyperCube was used to analyze data describing each store, using decreasing store performance among the network of opticians’ retail stores within the approximately 100 variables. Based on group, they needed to find a way to make sense of the data available and understand the analysis some of the findings the driving factors behind the stores that performed well. related to the type of spectacle frames facing the customers were as follows: Issue The key issue to be analyzed and understood was: “What are the drivers affecting store • If the share of designer frames in store is between 15-25 percent of the performance and how could low performing stores be developed to perform better?” products facing customers, then that store is 1.3 times more often a top Methodology performing store. This rule alone By using HyperCube, BearingPoint analyzed data from each of the stores using explains 30 percent of the top approximately 100 variables, both static and dynamic, describing each store. These performing stores. covered such things as demographics of customers, quality and experience of • If the share of entry-level frames with management and employees, number of years the store had been within the chain, a price of €100-170, is between 25-50 product category information as well as product pricing, set-up and design of stores, percent of the products facing number of designer spectacle frames and private label spectacle frames facing customers, then those stores are 1.45 times more often low- customers, and more. With this data as input, and through BearingPoint’s methodology, performing stores. In this segment of it was possible to discover insights into the driving factors behind high-performing stores stores, an average negative growth and low-performing stores. The methodology also generated a number of implementable of 3.75 percent is witnessed. business rules. One example of such a rule for profitable stores was: if the share of • If the share of private label frames in designer frames in store is between 15-25 percent of the products facing customers then the store is between 16-23 percent of that store is 1.3 times more often a top-performing store. This rule alone explains 30 the products facing customers, then percent of the top-performing stores. these are 1.3 times more often low performing stores. These best and worst performance rules could be used across the full network of retail stores in the entire chain to improve store performance. These insights and many more provided the client with tangible ways forward Results for creating higher performing stores. By learning from the top performers’ effective practices, a business improvement potential of 24 percent increase in store performance was identified for the medium and low performers. A 24% increase in store performance was identified Insight | White Paper 7
- 8. Retail | Business analytics with HyperCube Increasing marketing campaign effectiveness Situation The client is one of the largest international hypermarket chains iwth1,400 hypermarkets and operations in Europe, Africa, Asia and South America. With an annual marketing spend of $675 million, the client was facing issues with limited efficiency of the marketing campaigns within a number of its primary market areas. The client had Examples of general insights found information about its marketing campaigns but did not know how to analyze the data to using HyperCube (Retail marketing understand what generated successful marketing initiatives. effectiveness) To understand the driving factors Issue behind marketing effectiveness The key issue to be analyzed and understood was: “What are the factors and the logic HyperCube was used to analyze behind successful advertising campaigns?” as well as generating practical rules to help marketing campaign data for an increase return-on-investment (ROI) in advertising campaigns. international hypermarket chain. The input used was data on marketing Methodology campaigns on a weekly basis. Some By using BearingPoint’s methodology, we analyzed data including campaign data of examples of data were type of media, hundreds of campaigns from all relevant media, economic statistics data for the relevant specifics on the set-up of the media (length of radio spots), economic market areas, competitor data, market share data, marketing spend in each marketing statistics, size of marketing channel, and more with weekly data over a period of 2.5 years. investments, types of advertisement, competitor data, market share Using HyperCube, it was possible to understand the driving factors behind highly information and more. efficient marketing campaigns. By using the information mentioned above, HyperCube could generate a number of rules through which the client could make better and more Based on this input the analysis generated some general insights into conscious decisions on future campaigns. These rules provided a deeper understanding marketing effectiveness as follows: behind the general marketing spend (general rules), as well as a deeper specific • Equal investments every week are understanding of what campaign set-up is appropriate in specific marketing channels, generally less efficient. Differing for instance that a specific combination of TV-promotions along with a specific type of advertisements generate better catalog with a specific timing generated higher ROI. results. • Better targeting is significantly more Results efficient than increasing volume. By using the results from the analysis and learning from the top performing marketing initiatives, a potential of €35 million of additional sales was identified. This was mainly The analysis also generated specific based on the rules that provided the basis for more focused investments on media and insights into types of media used in marketing campaigns, for example: catalog, leading to higher impact marketing campaigns. • Catalog rule: advertising during weeks when a catalog with less than 36 pages are distributed in the middle of the month in parallel with TV commercial spots are 2.2 times more likely to over-perform. • Media rule: stand-alone internet campaigns do not generate a good ROI. However, advertising weeks when radio commercials are combined with distribution of a non-food professional catalog are 2 times more likely to over-perform. These insights gave the client a number of general and specific rules to describe how to achieve a higher ROI on future marketing campaign initiatives. A potential of €35 million of additional sales was identified 8 Insight | White Paper
- 9. If you are ready to take the next step, here is a way forward The tools are available and the benefits of using a data-driven approach have been well-established in many cases. More importantly, the method of this approach results in many types of insights that can be revealed from the data. Below we present BearingPoint’s five step methodology used for tackling business issues Figure 4: BearingPoint’s five step using HyperCube: methodology 1) Identify business issue. Identify your business issue and describe your core question to be answered. 1. Identify business issue 2) Identify and gather data. Identify and gather all people that understand the business issue and collect their input 2. Identify about it. 5. Implement and gather and follow-up data 3) HyperCube analysis. Use the data-driven tool HyperCube to get a deeper understanding of the story the data is telling 4. Derive insights and 3. HyperCube business rules analysis 4) Derive insights and business rules. Convert findings into implementable business rules aligned with your business situation. 5) Implement and follow-up. Implement rules and follow-up on results. The methodology is delivered to clients as a project, where the HyperCube analysis is an initial strategic analysis of a clearly defined business issue. A typical HyperCube analysis takes approximately 8-12 weeks and follows the process described above. If you are interested in taking your business performance to the next level, using a data-driven business analytics approach is the way forward. Leading retailers around the world are already doing so, and with great results. Examples include reaching deeper insights into store efficiency and marketing campaign set-ups. With our methodology and the HyperCube analytics tool, we have the capabilities and experience to support your organization in tackling the challenges you are facing. Insight | White Paper 9
- 10. Retail | Business analytics with HyperCube Authors Peter Brente Director, Sweden Consumer Markets +46 8 41011630 peter.brente@bearingpoint.com Robin Karmakar Senior Business Analyst +46 8 41011637 robin.karmakar@bearingpoint.com Henrik Ohlsson Senior Business Consultant, Norway Retail leader +47 966 26522 henrik.ohlsson@bearingpoint.com Contact Persons Denmark Ulrik Noergaard Senior Manager, Denmark Retail leader +45 22 102007 ulrik.noergaard@bearingpoint.com Finland Jari Laine Senior Manager, Nordic Retail leader +358 400 769686 jari.laine@bearingpoint.com Norway Henrik Ohlsson Senior Business Consultant, Norway Retail leader +47 966 26522 henrik.ohlsson@bearingpoint.com Sweden Peter Brente Director, Sweden Consumer Markets +46 8 41011630 peter.brente@bearingpoint.com Sources 1) BearingPoint analysis and experiences 2) Retail Analytics Trend Research Study, Babson, T.H.Davenport (2009) 3) Loucoubar C, Paul R, Bar-Hen A, Huret A, Tall A, et al. (2011) An Exhaustive, Non- Euclidean, Non-Parametric Data Mining Tool for Unraveling the Complexity of Biological Systems – Novel Insights into Malaria. PLoS ONE 6(9): e24085. doi:10.1371/journal.pone.0024085. Länk: http://www.plosone.org/article/ info%3Adoi%2F10.1371%2Fjournal.pone.0024085 10 Insight | White Paper
- 12. We are BearingPoint. Management & Technology Consultants. BearingPoint is an independent management and technology consultancy managed and owned by its Partners throughout Europe. Serving commercial, financial and public services clients, BearingPoint focuses on offering its clients the best possible value in terms of tangible, measurable results by leveraging business and technology expertise. Its seamless cross-border approach, an entrepreneurial culture, long-standing relations with reputable organisations, profound industry and functional knowledge as well as solutions customised to clients specific needs make the company a truly trusted adviser. BearingPoint has European roots, but operates with a global reach. To get there. Together. To learn more, visit our web site at www.bearingpoint.com. BearingPoint Denmark BearingPoint Finland BearingPoint Norway BearingPoint Sweden Islands Brygge 43 Kluuvikatu 3 Tjuvholmen Allé 3 Sveavägen 21 2300 Copenhagen 00100 Helsinki 0252 Oslo 111 34 Stockholm DENMARK FINLAND NORWAY SWEDEN Tel: +45 32 888888 Tel: +358 10 80 2288 Tel: +47 24 069000 Tel: +46 8 410 11600 Fax: +45 32 888800 Fax: +358 9 321 4621 Fax: +47 24 06 9001 Fax: +46 8 41011699 www.bearingpoint.dk www.bearingpoint.fi www.bearingpoint.no www.bearingpoint.se denmark@bearingpoint.com finland@bearingpoint.com norway@bearingpoint.com sweden@bearingpoint.com © 2012 BearingPoint. All rights reserved. Printed in Sweden. BENO1238 Insight | White Paper