
Recomendados
Más contenido relacionado
Último
Último (20)
Destacado
Destacado (20)
California Dept of Health Birthrate Information
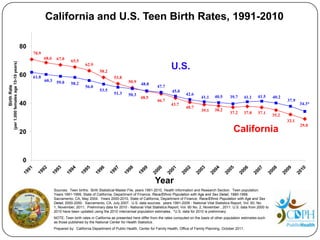
- 1. California and U.S. Teen Birth Rates, 1991-2010 80 70.9 68.6 67.0 65.5 (per 1,000 females age 15-19 years) 62.9 58.2 U.S. 60 61.8 53.8 60.3 59.0 50.9 58.2 48.8 47.7 Birth Rate 56.0 53.5 45.0 51.3 50.3 42.6 48.5 41.1 40.5 39.7 41.1 41.5 40.2 46.7 37.9 40 43.7 34.3* 40.7 39.1 38.2 37.2 37.8 37.1 35.2 32.1 29.0 20 California 0 Year Sources: Teen births: Birth Statistical Master File, years 1991-2010, Health Information and Research Section. Teen population: Years 1991-1999, State of California, Department of Finance, Race/Ethnic Population with Age and Sex Detail, 1990-1999. Sacramento, CA, May 2004. Years 2000-2010, State of California, Department of Finance, Race/Ethnic Population with Age and Sex Detail, 2000-2050. Sacramento, CA, July 2007. U.S. data sources: years 1991-2009 - National Vital Statistics Report, Vol. 60, No. 1, November, 2011; Preliminary data for 2010 - National Vital Statistics Report, Vol. 60 No. 2, November , 2011. U.S. data from 2000 to 2010 have been updated using the 2010 intercensal population estimates. *U.S. data for 2010 is preliminary. NOTE: Teen birth rates in California as presented here differ from the rates computed on the basis of other population estimates such as those published by the National Center for Health Statistics. Prepared by: California Department of Public Health, Center for Family Health, Office of Family Planning, October 2011.
- 2. California Teen Birth Rates by Age Group, 2000-2010 80 76.8 73.5 68.5 66.3 66.5 65.5 63.9 64.3 (per 1,000 females) 59.6 60 53.5 Birth Rate 48.6 Ages 18-19 46.7 43.7 40.7 39.1 38.2 37.2 37.8 37.1 35.2 40 32.1 29.0 Ages 15-19 26.5 23.8 22.4 21.2 20.6 20.3 20.0 19.9 19.1 20 17.5 15.2 Ages 15-17 0 2000 2001 2002 2003 2004 2005 2006 2007 2008 2009 2010 Year Sources: Teen births: Birth Statistical Master File, years 2000-2010, Teen population: Years 2000-2010, State of California, Department of Finance: Race/Ethnic Population with Age and Sex Detail, 2000-2050. Sacramento, CA, July 2007. Prepared by: California Department of Public Health, Center for Family Health, Office of Family Planning, October 2011.
- 3. California Teen Birth Rates by Race/Ethnicity & Year, 2008-2010 75 2008 2009 2010 (per 1,000 females age 15-19 years) 60 56.9 50.8 45.0 Birth Rate 45 39.9 37.0 34.0 29.0 28.9 30 27.1 25.9 25.4 22.3 15 13.1 11.9 11.0 9.6 8.5 7.3 0 White African American American Asian/Pacific Islander Multiple Race Hispanic (non-Hispanic) (non-Hispanic) Indian/Aleut/Eskimo (non-Hispanic) (non-Hispanic) (non-Hispanic) Race/Ethnicity Sources: Teen births: Birth Statistical Master File, years 2008-2010, Teen population: Years 2008-2010, State of California, Department of Finance: Race/Ethnic Population with Age and Sex Detail, 2000-2050. Sacramento, CA, July 2007. Births to mothers identified as “other” or “unknown” race are excluded from the analysis; they comprised 1.1% in 2008,1.2% each in 2009 and 2010. Prepared by: California Department of Public Health, Center for Family Health, Office of Family Planning, October 2011.
- 4. 19 California Counties With 3-Year Average Teen Birth Rates* Significantly HIGHER Than the 3-Year Average State Teen Birth Rate, 2008-2010**, Highest to Lowest • Tulare (60.4) • Del Norte (51.8) • Glenn (40.9) • Kern (60.2) • Merced (47.5) • Yuba (40.7) • Imperial (55.7) • Tehama(44.4) • Santa Barbara (39.9) • Kings (55.6) • Lake (43.4) • San Joaquin (37.4) • Madera (52.6) • Colusa (42.2) • Stanislaus (36.7) • Monterey (52.5) • San Bernardino (41.3) • Riverside (34.5) • Fresno (52.0) Sources: Teen births: Birth Statistical Master File, years 2008-2010. Teen population: State of California, Department of Finance: Race/Ethnic Population with Age and Sex Detail, 2000-2050. Sacramento, CA, July 2007, years 2008-2010. *Teen birth rate is per 1,000 females age 15-19 years. **The number of teen births and the teen female population for 3 years (2008-2010) were combined to produce more stable rates. County rates were tested for statistical significance against the state rate after subtracting the county’s contribution to the rate. County rates not statistically significantly different from the remaining state rate include Inyo, Lassen, Mendocino, Modoc, Plumas, Sacramento, Santa Cruz, Shasta, Siskiyou, Sutter, Trinity, and Ventura. Stable rates could not be computed for Alpine and Sierra (fewer than 20 births). Prepared by: California Department of Public Health, Center for Family Health, Office of Family Planning, October 2011.
- 5. 25 California Counties With 3-Year Average Teen Birth Rates* Significantly LOWER Than the 3-Year Average State Teen Birth Rate, 2008-2010**, Highest to Lowest • Los Angeles (30.7) • Sonoma (22.6) • San Luis Obispo (18.9) • San Diego (30.6) • Santa Clara (21.9) • Amador (18.6) • Humboldt (27.2) • Tuolumne (21.3) • El Dorado (15.0) • San Benito (27.0) • Mariposa (21.2) • Nevada (13.2) • Solano (26.5) • Contra Costa (20.4) • Mono (12.8) • Butte (26.3) • San Francisco (20.0) • Placer (12.6) • Alameda (23.9) • Calaveras (19.7) • Marin (10.9) • Orange (23.6) • Yolo (19.1) • Napa (23.4) • San Mateo (19.0) Sources: Teen births: Birth Statistical Master File, years 2008-2010. Teen population: State of California, Department of Finance: Race/Ethnic Population with Age and Sex Detail, 2000-2050. Sacramento, CA, July 2007, years 2008-2010. *Teen birth rate is per 1,000 females age 15-19 years. **The number of teen births and the teen female population for 3 years (2007-2009) were combined to produce more stable rates. County rates were tested for statistical significance against the state rate after subtracting the county’s contribution to the rate. County rates not statistically significantly different from the remaining state rate include Inyo, Lassen, Mendocino, Modoc, Plumas, Sacramento, Santa Cruz, Shasta, Siskiyou, Sutter, Trinity, and Ventura. Stable rates could not be computed for Alpine and Sierra (fewer than 20 births). Prepared by: California Department of Public Health, Center for Family Health, Office of Family Planning, October, 2011.
- 6. Sources: Teen births: Birth Statistical Master File, years 2008-2010. Teen population: State of California, Department of Finance: Race/Ethnic Population with Age and Sex Detail, 2000-2050. Sacramento, CA, July 2007. Prepared by: The Bixby Center for Global Reproductive Health, University of California, San Francisco, for California Department of Public Health, Center for Family Health, Office of Family Planning, October 2011.
- 7. Teen Birth Rate Comparisons for California, US, and SelectedCountries – 2009 Netherlands 4.7 * Japan 5.4 Italy 5.6 Countries and California Sweden 6.2 France 6.7 Germany 7.5 Norway 8.3 Spain 11.9 Canada 12.9 United Kingdom 29.7 California 32.1 United States 37.9 Mexico 68.6 0 10 20 30 40 50 60 70 Birth rate (per 1,000 females age 15-19 years) California data sources: Teen births: Birth Statistical Master File, 2009. Teen population: State of California, Department of Finance: Race/Ethnic Population with Age and Sex Detail, 2000-2050. Sacramento, CA, July 2007. * U.S. Data source: Births: Preliminary data for 2010. National Vital Statistics Report, Vol. 60 No. 2, November, 2010. International data: The World Bank, World Development Indicators: Social Development. URL: http://data.worldbank.org/indicator/SP.ADO.TFRT/countries?display=default NOTE: Teen birth rate in California as presented here differ from the rate computed on the basis of other population estimate such as those published by the National Center for Health Statistics. Prepared by: California Department of Public Health, Center for Family Health, Office of Family Planning, October 2011.
- 8. Race/Ethnicity (n=43,127)& Nativity of Teen Mothers Age 15- 19, California, 2010 Other/Unknown* (non-Hispanic) White Multiple Race (non- 1.2% (non-Hispanic) Hispanic)2.3% 12.5% African American (non-Hispanic)7.7% American Indian (non-Hispanic) 0.5% Hispanic 73.2% Asian/Pacific Islander (26% foreign (non-Hispanic)2.5% born, 74% US born) (28% foreign born, 72% US born) Sources: Teen births: Birth Statistical Master File, 2010. Percentages may not add to 100% due to rounding. Births to mothers with unknown race/ethnicity (1.2%) or unknown nativity (0.03%) are included in the analysis. Prepared by: California Department of Public Health, Center for Family Health, Office of Family Planning, October 2011.
- 9. California Teen Birth Rates, Number of Teens, 50 & Number of Teen Births, 2000-2010 1,600 45 46.7 1,488,238 1,400 40 1,200 35 1,186,951 (per 1,000 females age 15-19) Number of Teens & Births 1,000 30 (females age 15-19) Birth Rate 25 29.0 800 20 600 15 55,373 400 10 43,127 200 5 Teen Birth Rate Number of Female Teens Number of Teen Births 0 0 2000 2001 2002 2003 2004 2005 2006 2007 2008 2009 2010 Year Teen birth rate: Teen births: Birth Statistical Master File, years 2000-2010. Teen population: Years 2000-2010, State of California, Department of Finance, Race/Ethnic Population with Age and Sex Detail, 2000-2050. Sacramento, CA, July 2007. Number of teens: Years 2000-2010, State of California, Department of Finance, Race/Ethnic Population with Age and Sex Detail, 2000-2050. Sacramento, CA, July 2007. Number of teen births: Birth Statistical Master File, years 2000-2010. Prepared by: California Department of Public Health, Center for Family Health, Office of Family Planning, October 2011.
- 10. Number of Female Teens by Race/Ethnicity, Age 15-19 Years, California, 2000-2010 Total - 1,488,238 25% increase Total - 1,186,951 2000 2001 2002 2003 2004 2005 2006 2007 2008 2009 2010 Year Hispanic White Asian/Pacific Islander African American All Other Number of teens: Years 2000-2010, State of California, Department of Finance, Race/Ethnic Population with Age and Sex Detail, 2000-2050. Sacramento, CA, July 2007. “All Other” race/ethnicity population is comprised of American Indian and Multiple Race female teens. Prepared by: California Department of Public Health, Center for Family Health, Office of Family Planning, October 2011.