This document discusses different ways to represent functions:
(1) Algebraically using an equation like y=x+6
(2) Using a table of x-y pairs
(3) Graphically by plotting the relationship between x and y
It provides examples of each type of representation.
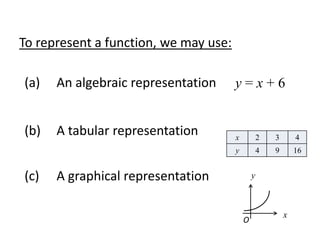
1. To represent a function, we may use:
(a) An algebraic representation y=x+6
(b) A tabular representation x 2 3 4
y 4 9 16
(c) A graphical representation y
x
O
2. • What are the characteristics of the graph of
y = loga x?
3. x 0.3 0.6 1 2 3 4
y –0.5 –0.2 0 0.3 0.5 0.6
y = log10 x
4. y = log2 x
x 0.3 0.6 1 2 3 4
y –1.7 –0.7 0 1 1.6 2
y = log2 x
y = log10 x
5. 1. Consider the graphs y = loga x and answer
the following questions.
(1,0)
(a) The graph cuts the x-axis at ________ .
does not touch
(b) The graph _________________ the y-axis.
positive
(c) The value of y is ______________ for x > 1.
negative
(d) The value of y is ______________ 0 < x < 1.
increases
(e) The value of y increases as x _____________ .
decreases
(f) The rate of increase of y ___________ when x
increases.
6. y = loga x
a>1
(a,1)
O
(1,0)
Domain: all positive real numbers
Range: all real numbers
7. y log 1 x
10
1’. For 0 < a < 1, the graphs y = loga x have the
following characteristics:
(f) The value decrease of yas x 0 < x < 1.
(e) The rate ofof y is negativedecreases when x increases.
(d)
(c) increases for decreases.
is positive for x > 1.
9. y = log2 x
y log 1 x
2
x 0.05 100 200
log2 x –6.64 5.64 7.64
log 1 x
6.64 –5.64 –7.64
In general, we have log 1 x log a x .
2
a
10. 3. The graph y log x is a reflection of the
1
a
graph y = loga x along the x-axis, for a > 0
and a ≠ 1.
11. Where is the graph of y = log4 x?
A
y = log2 x
y = log4 x
B
y = log8 x
C
> >
For x > 1, log2 x ___ log4 x ___ log8 x
< <
For 0 < x < 1, log2 x ___ log4 x ___ log8 x
12. > >
For x > 1, log2 x ___ log4 x ___ log8 x
< <
For 0 < x < 1, log2 x ___ log4 x ___ log8 x
4. When a > b > 1, for x > 1, loga x ___ logb x.
<
13. Sketch the graph y log 1 x and y log 1 x .
2 8
y = log2 x
y = log10 x
y log 1 x
(8,–1) 8
(2,–1)
(4,–2)
y log 1 x
(8,–3) 2
14. Summary
y log a x
O
y log 1 x
a
For a > 1, the graph of y log a x is a reflection
of the graph of y log 1 x along x-axis.
a
15. Summary
y = loga x
y = logb x
y = logc x
O
c > b> a >1
16. Summary
O
y = logd x
y = loge x
y = logf x
0<d<e<f<1
17. log x log x
log 1 x
1 log a 1
a log
a
log x
log a x
log a
18. Domain: Collection of values that the independent
variable can take
Range: Collection of all possible values that the
dependent variable can take
Dependent variable:
The variable whose values depend on the values
of the other variables.
Independent variable:
The variable that is not a dependent variable.