Roanoke Metropolitan Area Market Conditions Report
•
0 recomendaciones•227 vistas

Roanoke Metropolitan Statistical Area Market Conditions

Recomendados
Recomendados
Más contenido relacionado
La actualidad más candente
La actualidad más candente (20)
Similar a Roanoke Metropolitan Area Market Conditions Report
Similar a Roanoke Metropolitan Area Market Conditions Report (20)
Último
Último (20)
Roanoke Metropolitan Area Market Conditions Report
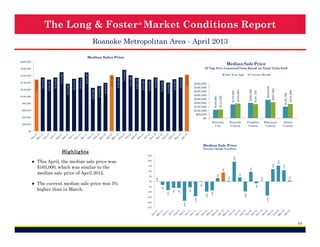
- 1. The Long & Foster ® Market Conditions Report Roanoke Metropolitan Area - September 2013 Median Sales Price $60,000 $40,000 Roanoke County $20,000 Roanoke City Botetourt County $171,250 $126,000 $215,750 Franklin County $195,500 $260,000 $221,000 $123,000 Current Month $106,975 $80,000 $168,500 $450,000 $400,000 $350,000 $300,000 $250,000 $200,000 $150,000 $100,000 $50,000 $0 $179,950 One Year Ago $168,000 $168,475 $174,000 $169,725 $165,000 $163,000 $155,000 $149,925 $140,000 $146,200 $155,000 $148,500 $150,000 $161,250 $176,800 $153,725 $139,575 $130,000 $125,000 $100,000 $154,414 $120,000 $137,000 $140,000 $151,000 $160,000 $156,000 Of Top Five Counties/Cities Based on Total Units Sold $161,500 Median Sale Price $180,000 $169,250 $200,000 Salem County $0 Median Sale Price 12% 10% 8% 11% 15% 6% 0% 1% 4% 5% 1% 3% 10% 9% 10% 15% 12% 19% 20% -25% -4% -14% -20% -10% -15% -10% -10% -8% -5% -2% 0% 0% -14% ● The current median sale price was 12% higher than the same month last year. 25% -6% ● This September, the current median sale price of $168,000 was similar to the median sale price of last month. Percent Change Year/Year -18% Highlights 54
- 2. The Long & Foster ® Market Conditions Report Roanoke Metropolitan Area - September 2013 Total Units Sold 400 86 79 20 100 26 24 40 17 39 60 33 80 47 100 73 296 Current Month 101 354 364 350 120 233 218 One Year Ago 140 193 201 245 234 286 307 314 244 229 222 201 210 211 Of Top Five Counties/Cities Based on Total Units Sold 156 150 236 200 214 250 294 278 300 345 Total Units Sold 350 0 Roanoke County 50 Roanoke City Franklin County Botetourt County Salem County 0 Total Units Sold 11% 5% 8% 4% 26% 20% 24% 9% 16% 21% 19% 9% 5% 10% 15% 20% -4% -8% -10% -1% 0% -2% ● There was a decrease of 15% in total units sold in September compared to August. 12% 30% 27% 34% 40% 31% 41% 50% 9% ● This month's total units sold was higher than at this time last year, an increase of 26% versus September 2012. Percent Change Year/Year 24% Highlights -20% 55
- 3. The Long & Foster ® Market Conditions Report Roanoke Metropolitan Area - September 2013 Total Units Sold by Type Detached Total Units Sold by Type Current Month Condo 400 Detached Condo 350 300 29 10% 250 200 150 100 50 267 90% 0 Total Units Sold by Price Range < 150K 160 150K to < 300K 300K to < 450K 450K to < 600K Total Units Sold by Price Range Current Month 600K and up < 150K 450K to < 600K 150K to < 300K 600K and up 300K to < 450K 140 120 100 32 11% 80 9 8 3% 3% 128 43% 60 40 20 119 40% 0 56
- 4. The Long & Foster ® Market Conditions Report Roanoke Metropolitan Area - September 2013 Total Active Inventory Current Month 173 400 200 1,000 164 293 600 1,500 311 743 751 766 800 684 1,000 816 One Year Ago 723 2,673 2,746 2,767 2,811 2,770 2,611 2,482 2,374 2,333 2,576 2,336 2,000 2,718 Of Top Five Counties/Cities Based on Total Units Sold 2,819 2,910 2,941 2,965 2,951 2,912 2,779 2,639 2,554 2,518 Total Active Inventory 2,807 2,500 3,014 3,000 3,153 3,500 0 Roanoke County 500 Roanoke City Franklin County Botetourt County Salem County 0 Total Active Inventory Percent Change Year/Year -3% -5% -6% -6% -10% -11% -9% -10% -11% -11% -13% -11% -10% -12% -12% -14% -17% -15% -15% -13% -13% -12% -10% -11% -14% ● Versus last September, the total number of homes available was lower by 146 units or 5%. -8% -9% -6% -7% -5% -5% -10% ● September's total active inventory of 2,673 units was 3% lower than the previous month's supply of inventory. 1% -1% -7% Highlights 57
- 5. The Long & Foster ® Market Conditions Report Roanoke Metropolitan Area - September 2013 Total Active Inventory by Type Detached Total Active Inventory by Type Condo Current Month Detached 3,500 Condo 3,000 297 11% 2,500 2,000 1,500 1,000 2,376 89% 500 0 Total Active Inventory by Price Range < 150K 3,500 150K to < 300K 300K to < 450K 450K to < 600K 600K and up Total Active Inventory by Price Range Current Month < 150K 450K to < 600K 150K to < 300K 600K and up 300K to < 450K 3,000 210 174 8% 7% 2,500 2,000 1,500 947 35% 331 12% 1,000 500 0 1,011 38% 58
- 6. The Long & Foster ® Market Conditions Report Roanoke Metropolitan Area - September 2013 Average Sale Price as a Percent of List Price Sale Price as % of List Price 97.0% Roanoke County 92.0% Roanoke City Days on Market Current One Year Month Ago 91.0% 102 128 120 110 105 100 90 80 116 121 120 114 108 100 100% 118 117 114 111 96.6% 95.3% 96.9% 93.6% 95.6% Salem County 108 94.6% 94.5% Up 0.1% Vs. Year Ago by Price Range 126 126 123 117 Botetourt County Average Sale Price as a Percent of List Price Days on Market 130 Franklin County Avg Sale Price as % of List Price Current One Year Month Ago Down -6% Vs. Year Ago 140 Current Month 92.0% 95.5% 95.4% 95.0% 100.0% 98.0% 96.0% 94.0% 92.0% 90.0% 88.0% 86.0% 94.0% 94.6% 95.0% 95.7% 95.7% 96.0% 94.1% 94.3% 94.6% 94.3% 94.6% 94.5% 95.3% 95.6% 94.8% 94.7% 94.8% 94.2% One Year Ago 92.9% 93.0% 94.2% 94.2% 94.1% 93.4% 94.0% 94.6% 95.0% 95.1% 96.0% 96.4% Of Top Five Counties/Cities Based on Total Units Sold 114 108 99 108 109 99 103 98 102 < 150K 150K to < 300K 300K to < 450K 450K to < 600K 600K and up 95% 90% 85% 70 60 50 80% 75% 59
- 7. The Long & Foster ® Market Conditions Report Roanoke Metropolitan Area - September 2013 Total Dollar Volume Sold In Thousands Highlights $90,000 $79,128 $56,495 $60,254 $73,995 $74,476 ● Total volume sold this September was 27% greater than the same month one year ago. ● In September, there was 9.0 months of supply available, compared to 12.1 in September 2012. That was a decrease of 25% versus a year ago. $40,380 $38,645 $31,375 $36,306 $47,079 $47,563 $62,355 $46,662 $40,920 $36,816 $50,130 $63,241 $10,000 $30,657 $23,365 $20,000 $41,042 $30,000 $40,418 $34,919 $40,000 $43,241 $50,000 $52,580 $70,000 $60,000 $77,959 $80,000 $0 Months of Supply Total Dollar Volume Sold Current One Year Month Ago Current Month's Active Inventory/Current Month's Unit Sales 18 4 2 9.0 7.9 8.0 7.9 8.5 10.9 12.1 11.6 10.5 9.5 9.3 12.1 12.1 12.5 13.1 13.3 12.7 10.6 10.7 7.6 6 $47,562,786 Up 27% Vs. Year Ago 10.1 8 12.0 10 12.8 12 $60,253,601 14.7 14 16.4 16 Months of Supply Current One Year Month Ago 9.0 12.1 Down -25% Vs. Year Ago 0 60
- 8. The Long & Foster ® Market Conditions Report Roanoke Metropolitan Area - September 2013 New Listings New Listings & New Contracts Franklin County Botetourt County 44 34 43 93 86 165 164 Roanoke City Salem County New Contracts Current Month 0 23 17 37 27 39 50 50 94 100 81 112 One Year Ago 81 316 310 345 299 341 336 253 389 294 253 150 172 201 249 237 282 279 253 179 145 Roanoke County 561 577 568 538 697 692 519 494 475 464 526 520 532 551 295 294 280 204 228 168 210 229 202 100 Current Month Of Top Five Counties/Cities Based on Total Units Sold 300 200 200 150 100 50 0 369 400 335 381 500 495 448 518 600 551 700 662 664 800 One Year Ago 72 New Contracts (Under Active Contract Status) 723 New Listings Of Top Five Counties/Cities Based on Total Units Sold 0 Roanoke County New Listings Current One Year Month Ago 561 475 Up 18% Vs. Year Ago New Contracts Current One Year Month Ago 316 Highlights ● Based on this month's amount of new listings and new contracts, the ratio of home supply (new listings) to current home demand (new contracts) was 1.8, a decrease of 7% from September 2012. Roanoke City Franklin County Botetourt County Salem County Supply/Demand Ratio Number of New Listings to New Contracts 3.0 2.5 2.0 2.3 2.4 2.4 2.4 2.1 1.9 2.0 2.3 2.1 1.9 2.0 1.9 1.9 1.9 1.8 2.0 1.7 2.1 2.1 2.0 1.9 1.8 1.9 1.6 1.8 1.5 1.0 249 Up 27% Vs. Year Ago 0.5 0.0 61