SlideShare una empresa de Scribd logo
1 de 6
Trade Diversion

In general, trade diversion means that a free trade area diverts trade, away from a more
efficient supplier outside the FTA, towards a less efficient supplier within the FTA. In some
cases, trade diversion will reduce a country's national welfare but in some cases national
welfare could improve despite the trade diversion. We present both cases below.

                                                  The adjoining diagram depicts the case in which
                                                  trade diversion is harmful to a country that joins
                                                  a FTA. The graph shows the supply and
                                                  demand curves for country A. PB and PC
                                                  represent the free trade supply prices of the
                                                  good from country's B and C, respectively.
                                                  Note that country C is assumed capable of
                                                  supplying the product at a lower price than
                                                  country B. (Note: In order for this to be possible
                                                  country B must have tariffs or other trade
                                                  restrictions on imports from country C, or else
                                                  all of B's market would be supplied by C)

                                                We assume that A has a specific tariff tB = tC =
t* set on imports from both countries B and C. The tariff raises the domestic supply prices to
PTB and PTC, respectively. The size of the tariff is denoted by the green dotted lines in the
diagram which show that t* = PTB - PB = PTC - PC.

Since, with the tariff, the product is cheaper from country C, country A will import the
product from country C and will not trade initially with country B. Imports are given by the
red line, or by the distance D1 - S1. Initial tariff revenue is given by area (c + e), the tariff rate
times the quantity imported.

Next, assume countries A and B form a FTA and A eliminates the tariff on imports from
country B. Now tB = 0 but tC remains at t*. The domestic prices on goods from countries B
and C are now PB and PTC, respectively. Since PB < PTC country A would import all of the
product from country B after the FTA and would import nothing from country C. At the
lower domestic price, PB, imports would rise to D2 - S2, denoted by the blue line. Also since
the non-distorted (i.e., free trade) price in country C is less than the price in country B, trade
is said to be diverted from a more efficient supplier to a less efficient supplier.
The welfare effects are summarized in the Table below.

 Welfare Effects of Free Trade Area Formation Trade
                    Diversion Cases

                                Country A

Consumer                     + (a + b + c + d)
Surplus

Producer                            -a
Surplus

Govt.                            - (c + e)
Revenue

National                       + (b + d) - e
Welfare

Free Trade Area Effects on:

Country A Consumers - Consumers of the product in the importing country benefit from the
free trade area. The reduction in the domestic price of both imported goods and the domestic
substitutes raises consumer surplus in the market. Refer to the Table and Figure to see how
the magnitude of the change in consumer surplus is represented.

Country A Producers - Producers in the importing country suffer losses as a result of the free
trade area. The decrease in the price of their product on the domestic market reduces producer
surplus in the industry. The price decrease also induces a decrease in output of existing firms
(and perhaps some firms will shut down), a decrease in employment, and a decrease in profit
and/or payments to fixed costs. Refer to the Table and Figure to see how the magnitude of the
change in producer surplus is represented.

Country A Government - The government loses all of the tariff revenue that had been
collected on imports of the product. This reduces government revenue which may in turn
reduce government spending or transfers or raise government debt. Who loses depends on
how the adjustment is made. Refer to the Table and Figure to see how the magnitude of the
tariff revenue is represented.

National Welfare Country A - The aggregate welfare effect for the country is found by
summing the gains and losses to consumers, producers and the government. The net effect
consists of three components: a positive production efficiency gain (b), a positive
consumption efficiency gain (d) and a negative tariff revenue loss (e). Notice that not all of
the tariff revenue loss (c + e) is represented in the loss to the nation. That's because some of
the total losses (area c) are, in effect, transferred to consumers. Refer to the Table and Figure
to see how the magnitude of the change in national welfare is represented.

Because there are both positive and negative elements, the net national welfare effect can be
either positive or negative. The diagram above depicts the case in which the FTA causes a
reduction in national welfare. Visually, it seems obvious that area e is larger than the sum of a
and b. Thus, under these condition the FTA with trade diversion would cause national welfare
to fall.

                                               If conditions were different, however, the
                                               national welfare change could be positive.
                                               Consider the adjoining diagram. This diagram
                                               differs from the one above only in that the free
                                               trade supply price offered by country B, PB, is
                                               lower and closer to country C's free trade
                                               supply price PC. The description above
                                               concerning the pre- and post-FTA equilibria
                                               remains the same and trade diversion still
                                               occurs. The welfare effects remain the same in
                                               direction, but, differ in magnitude. Notice that
                                               the consumer surplus gain is now larger because
                                               the drop in the domestic price is larger. Also
                                               notice that the net national welfare effect, (b + d
- e), visually, appears positive. This shows that in some cases, formation of a FTA that causes
trade diversion, may have a positive net national welfare effect. Thus, trade diversion may
be, but is not necessarily, welfare-reducing.

Generally speaking, the larger is the difference between the non-distorted prices in the FTA
partner country and in the rest of the world, the more likely that trade diversion will reduce
national welfare.

Trade Creation

In general, trade creation means that a free trade area creates trade that would not have
existed otherwise. As a result, supply occurs from a more efficient producer of the product. In
                                                all cases trade creation will raise a country's
                                                national welfare.

                                               The adjoining diagram depicts a case of trade
                                               creation. The graph shows the supply and
                                               demand curves for country A. PB and PC
                                               represent the free trade supply prices of the
                                               good from country's B and C respectively. Note
                                               that country C is assumed capable of supplying
                                               the product at a lower price than country B.
                                               (Note: In order for this to be possible country B
                                               must have tariffs or other trade restrictions on
                                               imports from country C, or else all of B's
                                               market would be supplied by C)

                                                We assume that A has a specific tariff tB = tC =
t* set on imports from both countries B and C. The tariff raises the domestic supply prices to
PTB and PTC, respectively. The size of the tariff is denoted by the green dotted lines in the
diagram which show that t* = PTB - PB = PTC - PC.
Since, with the tariffs, the autarky price in country A , labeled PA in the diagram, is less than
the tariff-ridden prices PTB and PTC, the product will not be imported. Instead country A will
supply its own domestic demand at S1 = D1. In this case the original tariffs are prohibitive.

Next, assume countries A and B form a FTA and A eliminates the tariff on imports from
country B. Now tB = 0 but tC remains at t*. The domestic prices on goods from countries B
and C are now PB and PTC, respectively. Since PB < PA country A would now import the
product from country B after the FTA. At the lower domestic price PB, imports would rise to
the blue line distance, or D2 - S2. Since trade now occurs with the FTA, and it did not occur
before, trade is said to be created.


The welfare effects are summarized in the Table below.

 Welfare Effects of Free Trade Area Formation Trade
                     Creation Case

                                Country A

Consumer                       + (a + b + c)
Surplus

Producer                            -a
Surplus

Govt.                                0
Revenue

National                         + (b + c)
Welfare

Free Trade Area Effects on:

Country A Consumers - Consumers of the product in the importing country benefit from the
free trade area. The reduction in the domestic price of both imported goods and the domestic
substitutes raises consumer surplus in the market. Refer to the Table and Figure to see how
the magnitude of the change in consumer surplus is represented.

Country A Producers - Producers in the importing country suffer losses as a result of the free
trade area. The decrease in the price of their product in the domestic market reduces producer
surplus in the industry. The price decrease also induces a decrease in output of existing firms
(and perhaps some firms will shut down), a decrease in employment, and a decrease in profit
and/or payments to fixed costs. Refer to the Table and Figure to see how the magnitude of the
change in producer surplus is represented.
Country A Government - Since initial tariffs were prohibitive and the product was not
originally imported there was no initial tariff revenue. Thus the FTA induces no loss of
revenue.

National Welfare Country A - The aggregate welfare effect for the country is found by
summing the gains and losses to consumers and producers. The net effect consists of two
positive components: a positive production efficiency gain (b) and a positive consumption
efficiency gain (c). This means that if trade creation arises when a FTA is formed, it must
result in net national welfare gains. Refer to the Table and Figure to see how the magnitude
of the change in national welfare is represented.

Aggregate Welfare Effects of a Free Trade Area

The analysis above considers the welfare effects upon participants in one particular market in
one country that is entering into a free trade area. However, when a free trade area is formed,
presumably many markets and multiple countries are affected, not just one. Thus to analyze
the aggregate effects of a FTA, one would need to sum up the effects across markets and
across countries.

The simple way to do that is to imagine that a country entering a FTA may have some import
markets in which trade creation would occur and other markets in which trade diversion
would occur. The markets with trade creation would definitely generate national welfare
gains while the markets with trade diversion may generate national welfare losses. It is
common for economists to make the following statement, "If the positive effects from trade
creation are larger than the negative effects from trade diversion, then the FTA will improve
national welfare." A more succinct statement, though also somewhat less accurate, is that "if
a FTA causes more trade creation than trade diversion then the FTA is welfare improving."

However, the converse statement is also possible, i.e., "if a FTA causes more trade diversion
than trade creation then the FTA may be welfare reducing for a country." This case is
actually quite interesting since its suggests that a movement to free trade by a group of
countries may actually reduce the national welfare of the countries involved. This means that
a movement in the direction of a more efficient free trade policy may not raise economic
efficiency. Although this result may seem counterintuitive, it can easily be reconciled in
terms of the theory of the second-best.

Free Trade Areas and the Theory of the Second-Best

One might ask, if free trade is economically the most efficient policy, how can it be that a
movement to free trade by a group of countries can reduce economic efficiency? The answer
is quite simple once we put the story of FTA formation into the context of the theory of the
second-best. Recall that the second-best theory suggested that when there are distortions or
imperfections in a market, then the addition of another distortion (like a trade policy) could
actually raise welfare, or economic efficiency. In the case of a FTA, the policy change is the
removal of trade barriers rather than the addition of a new trade policy. However, the second-
best theory works much the same in reverse.

Before a country enters a FTA it has policy imposed distortions already in place in the form
of tariff barriers applied on imports of goods. This means that the initial equilibrium can be
characterized as a second-best equilibrium. When the FTA is formed some of these
distortions are removed, i.e., the tariffs applied to one's FTA partners. However, other
distortions remain, i.e., tariffs applied against the non-member countries. If the partial tariff
removal substantially raises the negative effects caused by the remaining tariff barriers with
the non-FTA countries, then the efficiency improvements caused by free trade within the
FTA could be outweighed by the negative welfare effects caused by the remaining barriers
outside the FTA and national welfare could fall.

This is in essence what happens in the case of trade diversion. Trade diversion occurs when a
FTA shifts imports from a more efficient supplier to a less efficient supplier which by itself
causes a reduction in national welfare. Although the economy also benefits through the
elimination of the domestic distortions, if these benefits are smaller than the supplier
efficiency loss, then national welfare falls. In general, the only way to assure that trade
liberalization will lead to efficiency improvements is if a country removes its trade barriers
against all countries.

Más contenido relacionado

Similar a Summer internship report by sharad kumar

Trade diversion SFLS
Trade diversion SFLSTrade diversion SFLS
Trade diversion SFLSianhorner3
 
Terms of Trade (1).pptx
Terms of Trade (1).pptxTerms of Trade (1).pptx
Terms of Trade (1).pptxTintoTom3
 
1. The market for ice cream isa.a monopolistic market.b.a h.docx
1. The market for ice cream isa.a monopolistic market.b.a h.docx1. The market for ice cream isa.a monopolistic market.b.a h.docx
1. The market for ice cream isa.a monopolistic market.b.a h.docxjackiewalcutt
 
Supply and demand test
Supply and demand testSupply and demand test
Supply and demand testPatrick Rubix
 
1.The aggregate supply curve relating the price level to real GDP.docx
1.The aggregate supply curve relating the price level to real GDP.docx1.The aggregate supply curve relating the price level to real GDP.docx
1.The aggregate supply curve relating the price level to real GDP.docxherminaprocter
 
Monetary and Fiscal Policy
Monetary and Fiscal PolicyMonetary and Fiscal Policy
Monetary and Fiscal PolicyPrajakta Talathi
 
Market equlibariam
Market equlibariamMarket equlibariam
Market equlibariamICAB
 
Aggregate Expenditure And Aggregate Demand
Aggregate Expenditure And Aggregate DemandAggregate Expenditure And Aggregate Demand
Aggregate Expenditure And Aggregate Demandmandalina landy
 
IBE303 - Lecture 6
IBE303 - Lecture 6IBE303 - Lecture 6
IBE303 - Lecture 6saark
 
gainsfromtradef-100716211748-phpapp02.pdf
gainsfromtradef-100716211748-phpapp02.pdfgainsfromtradef-100716211748-phpapp02.pdf
gainsfromtradef-100716211748-phpapp02.pdfwexop40522
 

Similar a Summer internship report by sharad kumar (16)

The Gains from International Trade
The Gains from International TradeThe Gains from International Trade
The Gains from International Trade
 
Trade diversion SFLS
Trade diversion SFLSTrade diversion SFLS
Trade diversion SFLS
 
Instrument Of Trade Policy(M)
Instrument Of Trade Policy(M)Instrument Of Trade Policy(M)
Instrument Of Trade Policy(M)
 
Monoply
Monoply Monoply
Monoply
 
Terms of Trade (1).pptx
Terms of Trade (1).pptxTerms of Trade (1).pptx
Terms of Trade (1).pptx
 
1. The market for ice cream isa.a monopolistic market.b.a h.docx
1. The market for ice cream isa.a monopolistic market.b.a h.docx1. The market for ice cream isa.a monopolistic market.b.a h.docx
1. The market for ice cream isa.a monopolistic market.b.a h.docx
 
Supply and demand test
Supply and demand testSupply and demand test
Supply and demand test
 
1.The aggregate supply curve relating the price level to real GDP.docx
1.The aggregate supply curve relating the price level to real GDP.docx1.The aggregate supply curve relating the price level to real GDP.docx
1.The aggregate supply curve relating the price level to real GDP.docx
 
Monetary and Fiscal Policy
Monetary and Fiscal PolicyMonetary and Fiscal Policy
Monetary and Fiscal Policy
 
Macro diagrams (1)
Macro diagrams (1)Macro diagrams (1)
Macro diagrams (1)
 
Market equlibariam
Market equlibariamMarket equlibariam
Market equlibariam
 
Chap13
Chap13Chap13
Chap13
 
Chap13
Chap13Chap13
Chap13
 
Aggregate Expenditure And Aggregate Demand
Aggregate Expenditure And Aggregate DemandAggregate Expenditure And Aggregate Demand
Aggregate Expenditure And Aggregate Demand
 
IBE303 - Lecture 6
IBE303 - Lecture 6IBE303 - Lecture 6
IBE303 - Lecture 6
 
gainsfromtradef-100716211748-phpapp02.pdf
gainsfromtradef-100716211748-phpapp02.pdfgainsfromtradef-100716211748-phpapp02.pdf
gainsfromtradef-100716211748-phpapp02.pdf
 

Último

Flow Your Strategy at Flight Levels Day 2024
Flow Your Strategy at Flight Levels Day 2024Flow Your Strategy at Flight Levels Day 2024
Flow Your Strategy at Flight Levels Day 2024Kirill Klimov
 
8447779800, Low rate Call girls in Tughlakabad Delhi NCR
8447779800, Low rate Call girls in Tughlakabad Delhi NCR8447779800, Low rate Call girls in Tughlakabad Delhi NCR
8447779800, Low rate Call girls in Tughlakabad Delhi NCRashishs7044
 
NewBase 19 April 2024 Energy News issue - 1717 by Khaled Al Awadi.pdf
NewBase  19 April  2024  Energy News issue - 1717 by Khaled Al Awadi.pdfNewBase  19 April  2024  Energy News issue - 1717 by Khaled Al Awadi.pdf
NewBase 19 April 2024 Energy News issue - 1717 by Khaled Al Awadi.pdfKhaled Al Awadi
 
Intro to BCG's Carbon Emissions Benchmark_vF.pdf
Intro to BCG's Carbon Emissions Benchmark_vF.pdfIntro to BCG's Carbon Emissions Benchmark_vF.pdf
Intro to BCG's Carbon Emissions Benchmark_vF.pdfpollardmorgan
 
Youth Involvement in an Innovative Coconut Value Chain by Mwalimu Menza
Youth Involvement in an Innovative Coconut Value Chain by Mwalimu MenzaYouth Involvement in an Innovative Coconut Value Chain by Mwalimu Menza
Youth Involvement in an Innovative Coconut Value Chain by Mwalimu Menzaictsugar
 
Annual General Meeting Presentation Slides
Annual General Meeting Presentation SlidesAnnual General Meeting Presentation Slides
Annual General Meeting Presentation SlidesKeppelCorporation
 
Ten Organizational Design Models to align structure and operations to busines...
Ten Organizational Design Models to align structure and operations to busines...Ten Organizational Design Models to align structure and operations to busines...
Ten Organizational Design Models to align structure and operations to busines...Seta Wicaksana
 
Call Girls In Connaught Place Delhi ❤️88604**77959_Russian 100% Genuine Escor...
Call Girls In Connaught Place Delhi ❤️88604**77959_Russian 100% Genuine Escor...Call Girls In Connaught Place Delhi ❤️88604**77959_Russian 100% Genuine Escor...
Call Girls In Connaught Place Delhi ❤️88604**77959_Russian 100% Genuine Escor...lizamodels9
 
Pitch Deck Teardown: Geodesic.Life's $500k Pre-seed deck
Pitch Deck Teardown: Geodesic.Life's $500k Pre-seed deckPitch Deck Teardown: Geodesic.Life's $500k Pre-seed deck
Pitch Deck Teardown: Geodesic.Life's $500k Pre-seed deckHajeJanKamps
 
/:Call Girls In Indirapuram Ghaziabad ➥9990211544 Independent Best Escorts In...
/:Call Girls In Indirapuram Ghaziabad ➥9990211544 Independent Best Escorts In.../:Call Girls In Indirapuram Ghaziabad ➥9990211544 Independent Best Escorts In...
/:Call Girls In Indirapuram Ghaziabad ➥9990211544 Independent Best Escorts In...lizamodels9
 
Global Scenario On Sustainable and Resilient Coconut Industry by Dr. Jelfina...
Global Scenario On Sustainable  and Resilient Coconut Industry by Dr. Jelfina...Global Scenario On Sustainable  and Resilient Coconut Industry by Dr. Jelfina...
Global Scenario On Sustainable and Resilient Coconut Industry by Dr. Jelfina...ictsugar
 
2024 Numerator Consumer Study of Cannabis Usage
2024 Numerator Consumer Study of Cannabis Usage2024 Numerator Consumer Study of Cannabis Usage
2024 Numerator Consumer Study of Cannabis UsageNeil Kimberley
 
Investment in The Coconut Industry by Nancy Cheruiyot
Investment in The Coconut Industry by Nancy CheruiyotInvestment in The Coconut Industry by Nancy Cheruiyot
Investment in The Coconut Industry by Nancy Cheruiyotictsugar
 
Case study on tata clothing brand zudio in detail
Case study on tata clothing brand zudio in detailCase study on tata clothing brand zudio in detail
Case study on tata clothing brand zudio in detailAriel592675
 
Call Us 📲8800102216📞 Call Girls In DLF City Gurgaon
Call Us 📲8800102216📞 Call Girls In DLF City GurgaonCall Us 📲8800102216📞 Call Girls In DLF City Gurgaon
Call Us 📲8800102216📞 Call Girls In DLF City Gurgaoncallgirls2057
 
Digital Transformation in the PLM domain - distrib.pdf
Digital Transformation in the PLM domain - distrib.pdfDigital Transformation in the PLM domain - distrib.pdf
Digital Transformation in the PLM domain - distrib.pdfJos Voskuil
 
Call Girls In Sikandarpur Gurgaon ❤️8860477959_Russian 100% Genuine Escorts I...
Call Girls In Sikandarpur Gurgaon ❤️8860477959_Russian 100% Genuine Escorts I...Call Girls In Sikandarpur Gurgaon ❤️8860477959_Russian 100% Genuine Escorts I...
Call Girls In Sikandarpur Gurgaon ❤️8860477959_Russian 100% Genuine Escorts I...lizamodels9
 
(Best) ENJOY Call Girls in Faridabad Ex | 8377087607
(Best) ENJOY Call Girls in Faridabad Ex | 8377087607(Best) ENJOY Call Girls in Faridabad Ex | 8377087607
(Best) ENJOY Call Girls in Faridabad Ex | 8377087607dollysharma2066
 
Islamabad Escorts | Call 03070433345 | Escort Service in Islamabad
Islamabad Escorts | Call 03070433345 | Escort Service in IslamabadIslamabad Escorts | Call 03070433345 | Escort Service in Islamabad
Islamabad Escorts | Call 03070433345 | Escort Service in IslamabadAyesha Khan
 

Último (20)

Flow Your Strategy at Flight Levels Day 2024
Flow Your Strategy at Flight Levels Day 2024Flow Your Strategy at Flight Levels Day 2024
Flow Your Strategy at Flight Levels Day 2024
 
8447779800, Low rate Call girls in Tughlakabad Delhi NCR
8447779800, Low rate Call girls in Tughlakabad Delhi NCR8447779800, Low rate Call girls in Tughlakabad Delhi NCR
8447779800, Low rate Call girls in Tughlakabad Delhi NCR
 
NewBase 19 April 2024 Energy News issue - 1717 by Khaled Al Awadi.pdf
NewBase  19 April  2024  Energy News issue - 1717 by Khaled Al Awadi.pdfNewBase  19 April  2024  Energy News issue - 1717 by Khaled Al Awadi.pdf
NewBase 19 April 2024 Energy News issue - 1717 by Khaled Al Awadi.pdf
 
Intro to BCG's Carbon Emissions Benchmark_vF.pdf
Intro to BCG's Carbon Emissions Benchmark_vF.pdfIntro to BCG's Carbon Emissions Benchmark_vF.pdf
Intro to BCG's Carbon Emissions Benchmark_vF.pdf
 
Youth Involvement in an Innovative Coconut Value Chain by Mwalimu Menza
Youth Involvement in an Innovative Coconut Value Chain by Mwalimu MenzaYouth Involvement in an Innovative Coconut Value Chain by Mwalimu Menza
Youth Involvement in an Innovative Coconut Value Chain by Mwalimu Menza
 
Annual General Meeting Presentation Slides
Annual General Meeting Presentation SlidesAnnual General Meeting Presentation Slides
Annual General Meeting Presentation Slides
 
Ten Organizational Design Models to align structure and operations to busines...
Ten Organizational Design Models to align structure and operations to busines...Ten Organizational Design Models to align structure and operations to busines...
Ten Organizational Design Models to align structure and operations to busines...
 
Call Girls In Connaught Place Delhi ❤️88604**77959_Russian 100% Genuine Escor...
Call Girls In Connaught Place Delhi ❤️88604**77959_Russian 100% Genuine Escor...Call Girls In Connaught Place Delhi ❤️88604**77959_Russian 100% Genuine Escor...
Call Girls In Connaught Place Delhi ❤️88604**77959_Russian 100% Genuine Escor...
 
Pitch Deck Teardown: Geodesic.Life's $500k Pre-seed deck
Pitch Deck Teardown: Geodesic.Life's $500k Pre-seed deckPitch Deck Teardown: Geodesic.Life's $500k Pre-seed deck
Pitch Deck Teardown: Geodesic.Life's $500k Pre-seed deck
 
Corporate Profile 47Billion Information Technology
Corporate Profile 47Billion Information TechnologyCorporate Profile 47Billion Information Technology
Corporate Profile 47Billion Information Technology
 
/:Call Girls In Indirapuram Ghaziabad ➥9990211544 Independent Best Escorts In...
/:Call Girls In Indirapuram Ghaziabad ➥9990211544 Independent Best Escorts In.../:Call Girls In Indirapuram Ghaziabad ➥9990211544 Independent Best Escorts In...
/:Call Girls In Indirapuram Ghaziabad ➥9990211544 Independent Best Escorts In...
 
Global Scenario On Sustainable and Resilient Coconut Industry by Dr. Jelfina...
Global Scenario On Sustainable  and Resilient Coconut Industry by Dr. Jelfina...Global Scenario On Sustainable  and Resilient Coconut Industry by Dr. Jelfina...
Global Scenario On Sustainable and Resilient Coconut Industry by Dr. Jelfina...
 
2024 Numerator Consumer Study of Cannabis Usage
2024 Numerator Consumer Study of Cannabis Usage2024 Numerator Consumer Study of Cannabis Usage
2024 Numerator Consumer Study of Cannabis Usage
 
Investment in The Coconut Industry by Nancy Cheruiyot
Investment in The Coconut Industry by Nancy CheruiyotInvestment in The Coconut Industry by Nancy Cheruiyot
Investment in The Coconut Industry by Nancy Cheruiyot
 
Case study on tata clothing brand zudio in detail
Case study on tata clothing brand zudio in detailCase study on tata clothing brand zudio in detail
Case study on tata clothing brand zudio in detail
 
Call Us 📲8800102216📞 Call Girls In DLF City Gurgaon
Call Us 📲8800102216📞 Call Girls In DLF City GurgaonCall Us 📲8800102216📞 Call Girls In DLF City Gurgaon
Call Us 📲8800102216📞 Call Girls In DLF City Gurgaon
 
Digital Transformation in the PLM domain - distrib.pdf
Digital Transformation in the PLM domain - distrib.pdfDigital Transformation in the PLM domain - distrib.pdf
Digital Transformation in the PLM domain - distrib.pdf
 
Call Girls In Sikandarpur Gurgaon ❤️8860477959_Russian 100% Genuine Escorts I...
Call Girls In Sikandarpur Gurgaon ❤️8860477959_Russian 100% Genuine Escorts I...Call Girls In Sikandarpur Gurgaon ❤️8860477959_Russian 100% Genuine Escorts I...
Call Girls In Sikandarpur Gurgaon ❤️8860477959_Russian 100% Genuine Escorts I...
 
(Best) ENJOY Call Girls in Faridabad Ex | 8377087607
(Best) ENJOY Call Girls in Faridabad Ex | 8377087607(Best) ENJOY Call Girls in Faridabad Ex | 8377087607
(Best) ENJOY Call Girls in Faridabad Ex | 8377087607
 
Islamabad Escorts | Call 03070433345 | Escort Service in Islamabad
Islamabad Escorts | Call 03070433345 | Escort Service in IslamabadIslamabad Escorts | Call 03070433345 | Escort Service in Islamabad
Islamabad Escorts | Call 03070433345 | Escort Service in Islamabad
 

Summer internship report by sharad kumar

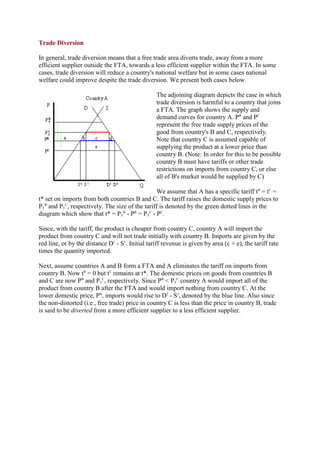
  • 1. Trade Diversion In general, trade diversion means that a free trade area diverts trade, away from a more efficient supplier outside the FTA, towards a less efficient supplier within the FTA. In some cases, trade diversion will reduce a country's national welfare but in some cases national welfare could improve despite the trade diversion. We present both cases below. The adjoining diagram depicts the case in which trade diversion is harmful to a country that joins a FTA. The graph shows the supply and demand curves for country A. PB and PC represent the free trade supply prices of the good from country's B and C, respectively. Note that country C is assumed capable of supplying the product at a lower price than country B. (Note: In order for this to be possible country B must have tariffs or other trade restrictions on imports from country C, or else all of B's market would be supplied by C) We assume that A has a specific tariff tB = tC = t* set on imports from both countries B and C. The tariff raises the domestic supply prices to PTB and PTC, respectively. The size of the tariff is denoted by the green dotted lines in the diagram which show that t* = PTB - PB = PTC - PC. Since, with the tariff, the product is cheaper from country C, country A will import the product from country C and will not trade initially with country B. Imports are given by the red line, or by the distance D1 - S1. Initial tariff revenue is given by area (c + e), the tariff rate times the quantity imported. Next, assume countries A and B form a FTA and A eliminates the tariff on imports from country B. Now tB = 0 but tC remains at t*. The domestic prices on goods from countries B and C are now PB and PTC, respectively. Since PB < PTC country A would import all of the product from country B after the FTA and would import nothing from country C. At the lower domestic price, PB, imports would rise to D2 - S2, denoted by the blue line. Also since the non-distorted (i.e., free trade) price in country C is less than the price in country B, trade is said to be diverted from a more efficient supplier to a less efficient supplier.
  • 2. The welfare effects are summarized in the Table below. Welfare Effects of Free Trade Area Formation Trade Diversion Cases Country A Consumer + (a + b + c + d) Surplus Producer -a Surplus Govt. - (c + e) Revenue National + (b + d) - e Welfare Free Trade Area Effects on: Country A Consumers - Consumers of the product in the importing country benefit from the free trade area. The reduction in the domestic price of both imported goods and the domestic substitutes raises consumer surplus in the market. Refer to the Table and Figure to see how the magnitude of the change in consumer surplus is represented. Country A Producers - Producers in the importing country suffer losses as a result of the free trade area. The decrease in the price of their product on the domestic market reduces producer surplus in the industry. The price decrease also induces a decrease in output of existing firms (and perhaps some firms will shut down), a decrease in employment, and a decrease in profit and/or payments to fixed costs. Refer to the Table and Figure to see how the magnitude of the change in producer surplus is represented. Country A Government - The government loses all of the tariff revenue that had been collected on imports of the product. This reduces government revenue which may in turn reduce government spending or transfers or raise government debt. Who loses depends on how the adjustment is made. Refer to the Table and Figure to see how the magnitude of the tariff revenue is represented. National Welfare Country A - The aggregate welfare effect for the country is found by summing the gains and losses to consumers, producers and the government. The net effect consists of three components: a positive production efficiency gain (b), a positive consumption efficiency gain (d) and a negative tariff revenue loss (e). Notice that not all of the tariff revenue loss (c + e) is represented in the loss to the nation. That's because some of the total losses (area c) are, in effect, transferred to consumers. Refer to the Table and Figure to see how the magnitude of the change in national welfare is represented. Because there are both positive and negative elements, the net national welfare effect can be either positive or negative. The diagram above depicts the case in which the FTA causes a reduction in national welfare. Visually, it seems obvious that area e is larger than the sum of a
  • 3. and b. Thus, under these condition the FTA with trade diversion would cause national welfare to fall. If conditions were different, however, the national welfare change could be positive. Consider the adjoining diagram. This diagram differs from the one above only in that the free trade supply price offered by country B, PB, is lower and closer to country C's free trade supply price PC. The description above concerning the pre- and post-FTA equilibria remains the same and trade diversion still occurs. The welfare effects remain the same in direction, but, differ in magnitude. Notice that the consumer surplus gain is now larger because the drop in the domestic price is larger. Also notice that the net national welfare effect, (b + d - e), visually, appears positive. This shows that in some cases, formation of a FTA that causes trade diversion, may have a positive net national welfare effect. Thus, trade diversion may be, but is not necessarily, welfare-reducing. Generally speaking, the larger is the difference between the non-distorted prices in the FTA partner country and in the rest of the world, the more likely that trade diversion will reduce national welfare. Trade Creation In general, trade creation means that a free trade area creates trade that would not have existed otherwise. As a result, supply occurs from a more efficient producer of the product. In all cases trade creation will raise a country's national welfare. The adjoining diagram depicts a case of trade creation. The graph shows the supply and demand curves for country A. PB and PC represent the free trade supply prices of the good from country's B and C respectively. Note that country C is assumed capable of supplying the product at a lower price than country B. (Note: In order for this to be possible country B must have tariffs or other trade restrictions on imports from country C, or else all of B's market would be supplied by C) We assume that A has a specific tariff tB = tC = t* set on imports from both countries B and C. The tariff raises the domestic supply prices to PTB and PTC, respectively. The size of the tariff is denoted by the green dotted lines in the diagram which show that t* = PTB - PB = PTC - PC.
  • 4. Since, with the tariffs, the autarky price in country A , labeled PA in the diagram, is less than the tariff-ridden prices PTB and PTC, the product will not be imported. Instead country A will supply its own domestic demand at S1 = D1. In this case the original tariffs are prohibitive. Next, assume countries A and B form a FTA and A eliminates the tariff on imports from country B. Now tB = 0 but tC remains at t*. The domestic prices on goods from countries B and C are now PB and PTC, respectively. Since PB < PA country A would now import the product from country B after the FTA. At the lower domestic price PB, imports would rise to the blue line distance, or D2 - S2. Since trade now occurs with the FTA, and it did not occur before, trade is said to be created. The welfare effects are summarized in the Table below. Welfare Effects of Free Trade Area Formation Trade Creation Case Country A Consumer + (a + b + c) Surplus Producer -a Surplus Govt. 0 Revenue National + (b + c) Welfare Free Trade Area Effects on: Country A Consumers - Consumers of the product in the importing country benefit from the free trade area. The reduction in the domestic price of both imported goods and the domestic substitutes raises consumer surplus in the market. Refer to the Table and Figure to see how the magnitude of the change in consumer surplus is represented. Country A Producers - Producers in the importing country suffer losses as a result of the free trade area. The decrease in the price of their product in the domestic market reduces producer surplus in the industry. The price decrease also induces a decrease in output of existing firms (and perhaps some firms will shut down), a decrease in employment, and a decrease in profit and/or payments to fixed costs. Refer to the Table and Figure to see how the magnitude of the change in producer surplus is represented.
  • 5. Country A Government - Since initial tariffs were prohibitive and the product was not originally imported there was no initial tariff revenue. Thus the FTA induces no loss of revenue. National Welfare Country A - The aggregate welfare effect for the country is found by summing the gains and losses to consumers and producers. The net effect consists of two positive components: a positive production efficiency gain (b) and a positive consumption efficiency gain (c). This means that if trade creation arises when a FTA is formed, it must result in net national welfare gains. Refer to the Table and Figure to see how the magnitude of the change in national welfare is represented. Aggregate Welfare Effects of a Free Trade Area The analysis above considers the welfare effects upon participants in one particular market in one country that is entering into a free trade area. However, when a free trade area is formed, presumably many markets and multiple countries are affected, not just one. Thus to analyze the aggregate effects of a FTA, one would need to sum up the effects across markets and across countries. The simple way to do that is to imagine that a country entering a FTA may have some import markets in which trade creation would occur and other markets in which trade diversion would occur. The markets with trade creation would definitely generate national welfare gains while the markets with trade diversion may generate national welfare losses. It is common for economists to make the following statement, "If the positive effects from trade creation are larger than the negative effects from trade diversion, then the FTA will improve national welfare." A more succinct statement, though also somewhat less accurate, is that "if a FTA causes more trade creation than trade diversion then the FTA is welfare improving." However, the converse statement is also possible, i.e., "if a FTA causes more trade diversion than trade creation then the FTA may be welfare reducing for a country." This case is actually quite interesting since its suggests that a movement to free trade by a group of countries may actually reduce the national welfare of the countries involved. This means that a movement in the direction of a more efficient free trade policy may not raise economic efficiency. Although this result may seem counterintuitive, it can easily be reconciled in terms of the theory of the second-best. Free Trade Areas and the Theory of the Second-Best One might ask, if free trade is economically the most efficient policy, how can it be that a movement to free trade by a group of countries can reduce economic efficiency? The answer is quite simple once we put the story of FTA formation into the context of the theory of the second-best. Recall that the second-best theory suggested that when there are distortions or imperfections in a market, then the addition of another distortion (like a trade policy) could actually raise welfare, or economic efficiency. In the case of a FTA, the policy change is the removal of trade barriers rather than the addition of a new trade policy. However, the second- best theory works much the same in reverse. Before a country enters a FTA it has policy imposed distortions already in place in the form of tariff barriers applied on imports of goods. This means that the initial equilibrium can be characterized as a second-best equilibrium. When the FTA is formed some of these
  • 6. distortions are removed, i.e., the tariffs applied to one's FTA partners. However, other distortions remain, i.e., tariffs applied against the non-member countries. If the partial tariff removal substantially raises the negative effects caused by the remaining tariff barriers with the non-FTA countries, then the efficiency improvements caused by free trade within the FTA could be outweighed by the negative welfare effects caused by the remaining barriers outside the FTA and national welfare could fall. This is in essence what happens in the case of trade diversion. Trade diversion occurs when a FTA shifts imports from a more efficient supplier to a less efficient supplier which by itself causes a reduction in national welfare. Although the economy also benefits through the elimination of the domestic distortions, if these benefits are smaller than the supplier efficiency loss, then national welfare falls. In general, the only way to assure that trade liberalization will lead to efficiency improvements is if a country removes its trade barriers against all countries.