
Recommended
More Related Content
What's hot
What's hot (19)
Viewers also liked
Similar to Plot Points & Recognize Scatterplots in Coordinate Plane
Similar to Plot Points & Recognize Scatterplots in Coordinate Plane (20)
Recently uploaded
Recently uploaded (20)
Plot Points & Recognize Scatterplots in Coordinate Plane
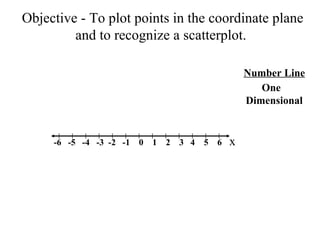
- 1. Objective - To plot points in the coordinate plane and to recognize a scatterplot. -6 -5 -4 -3 -2 -1 0 1 2 3 4 5 6 Number Line One Dimensional x
- 2. Objective - To plot points in the coordinate plane and to recognize a scatterplot. -6 -5 -4 -3 -2 -1 0 1 2 3 4 5 6 6 5 4 3 2 1 -1 -2 -3 -4 -5 -6 Number Line One Dimensional Coordinate Plane Two Dimensional x-axis y-axis
- 3. Objective - To plot points in the coordinate plane and to recognize a scatterplot. D -6 -5 -4 -3 -2 -1 0 1 2 3 4 5 6 6 5 4 3 2 1 -1 -2 -3 -4 -5 -6 (3,2) (x,y) Ordered Pair (0,0) origin Plot A(-3,1) B(5,-4) C(-4,-6) D(0,5) A B C I II III IV x-axis y-axis Coordinate Plane Two Dimensional Number Line One Dimensional
- 4. Name the quadrant where each point would be located. 1) (2, -6) 2) (5, 7) 3) (-6, -5) 4) (6, -10) 5) (-7, 12) 6) (240, -1) 7) (-19, 7400) 8) (7, 0) IV I III IV II IV II No Quadrant
- 5. Ordered Pairs Domain - set of x-values. Range - set of y-values. { (3, -2), (4, 1), (-3, -4), (0, 2), (-4, 0) } 1) State the domain. 2) State the range. 3) Plot the Points { 3, 4, -3, 0, -4} { -2, 1, -4, 2, 0 } x y
- 6. 0 100 200 300 400 500 600 Animal Brain Weight (g) Max. Life (yr.) Mouse Fox Jaguar Sheep Pig Seal Donkey Chimp 0.4 50.4 157 175 180 325 419 440 3.2 9.8 22.4 20 27 41 40 50 x y Brain Weight (g) Max. Life (yrs.) 50 40 30 20 10 Scatterplots
- 7. 0 100 200 300 400 500 600 x y Brain Weight (g) Max. Life (yrs.) 50 40 30 20 10 Trend is increasing Scatterplot - a coordinate graph of data points. Line of Best Fit -Points act like magnets attracting the line. Trend looks linear
- 8. 0 100 200 300 400 500 600 x y Brain Weight (g) Max. Life (yrs.) 50 40 30 20 10 Line of Best Fit -Points act like magnets attracting the line. Trend is increasing Trend looks linear Scatterplot - a coordinate graph of data points.
- 9. 0 100 200 300 400 500 600 x y Brain Weight (g) Max. Life (yrs.) 50 40 30 20 10 Line of Best Fit -Points act like magnets attracting the line. Trend is increasing Trend looks linear Scatterplot - a coordinate graph of data points.
- 10. 0 100 200 300 400 500 600 x y Brain Weight (g) Max. Life (yrs.) 50 40 30 20 10 Line of Best Fit -Points act like magnets attracting the line. Trend is increasing Trend looks linear Scatterplot - a coordinate graph of data points.
- 11. 0 100 200 300 400 500 600 x y Brain Weight (g) Max. Life (yrs.) 50 40 30 20 10 Line of Best Fit -Points act like magnets attracting the line. Trend is increasing Trend looks linear Scatterplot - a coordinate graph of data points.