Más contenido relacionado
Blue Chip Stock Analysis
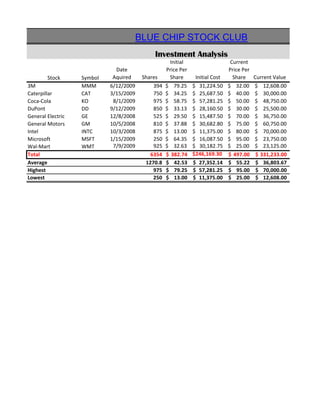
- 1. BLUE CHIP STOCK CLUB
Investment Analysis
Initial Current
Date Price Per Price Per
Stock Symbol Aquired Shares Share Initial Cost Share Current Value
3M MMM 6/12/2009 394 $ 79.25 $ 31,224.50 $ 32.00 $ 12,608.00
Caterpillar CAT 3/15/2009 750 $ 34.25 $ 25,687.50 $ 40.00 $ 30,000.00
Coca-Cola KO 8/1/2009 975 $ 58.75 $ 57,281.25 $ 50.00 $ 48,750.00
DuPont DD 9/12/2009 850 $ 33.13 $ 28,160.50 $ 30.00 $ 25,500.00
General Electric GE 12/8/2008 525 $ 29.50 $ 15,487.50 $ 70.00 $ 36,750.00
General Motors GM 10/5/2008 810 $ 37.88 $ 30,682.80 $ 75.00 $ 60,750.00
Intel INTC 10/3/2008 875 $ 13.00 $ 11,375.00 $ 80.00 $ 70,000.00
Microsoft MSFT 1/15/2009 250 $ 64.35 $ 16,087.50 $ 95.00 $ 23,750.00
Wal-Mart WMT 7/9/2009 925 $ 32.63 $ 30,182.75 $ 25.00 $ 23,125.00
Total 6354 $ 382.74 $246,169.30 $ 497.00 $ 331,233.00
Average 1270.8 $ 42.53 $ 27,352.14 $ 55.22 $ 36,803.67
Highest 975 $ 79.25 $ 57,281.25 $ 95.00 $ 70,000.00
Lowest 250 $ 13.00 $ 11,375.00 $ 25.00 $ 12,608.00
- 2. Percent
Gain/Loss Gain/Loss
$ (18,616.50) -60%
$ 4,312.50 17%
$ (8,531.25) -15%
$ (2,660.50) -9%
$ 21,262.50 137%
$ 30,067.20 98%
$ 58,625.00 515%
$ 7,662.50 48%
$ (7,057.75) -23%
$ 85,063.70 7.077388
$ 9,451.52 0.7863764
$ 58,625.00 $ 5.15
$ (18,616.50) $ (0.60)
- 3. -23% 17% -15%
-9%
-60% 1
48%
2
137%
3
4
98%
5
515%
6
7
8
9