SlideShare una empresa de Scribd logo
1 de 22
Descargar para leer sin conexión
Geoff Riley (tutor2u) ‐ Europe an Ever Larger                                                            February 2011
Union


                                                          An Ever Larger Union


                               Enlargement of the EU Single Market
                     A2 Economics: Global and European Context Issues (Geoff Riley, February 2011)


                                              The Map of Europe
                                                            The EU is now the 
                                                            largest integrated 
                                                                                     economic area in 
                                                                                        the world, 
                                                                                      accounting for 
                                                                                     more than 30% of 
                                                                                      world GDP and 
                                                                                     more than 17% of 
                                                                                       world trade


www.tutor2u.net                                                                                                     1
Geoff Riley (tutor2u) ‐ Europe an Ever Larger                                     February 2011
Union


                              Expanding the Single Market
                       • First Expansion
                           – 1973: UK, Ireland and Denmark
                       • Mediterranean Spirit
                           – 1981: Greece
                           – 1986: Portugal and Spain
                       • Entry of the Neutrals
                           – 1995: Austria, Finland and Sweden
                       • The Big Bang
                           – 2004: Latvia, Lithuania, Cyprus, Malta, Slovenia, 
                             Slovakia, Estonia, Hungary, Czech Republic, Poland
                           – 2007: Bulgaria and Romania


                                  Backward agrarian sectors?


www.tutor2u.net                                                                              2
Geoff Riley (tutor2u) ‐ Europe an Ever Larger                       February 2011
Union


                        Or countries and cities of deep cultural 
                                and political interest


                        Many new EU countries offer surprises


www.tutor2u.net                                                                3
Geoff Riley (tutor2u) ‐ Europe an Ever Larger                                              February 2011
Union


                              And lead the way towards a low 
                                     carbon economy


                               Benefits of EU Membership
                                        Trade and Investment
                                        • Free trade access to richer EU markets
                                        • Attract inward capital investment

                                        EU funding
                                        • Structural funds for transport & environment
                                        • Farm support (but at lower rate than ‘Old EU’)

                                        Macroeconomic stability
                                        • Commitment towards joining single currency
                                        • Must be fully‐fledged market economies to join


www.tutor2u.net                                                                                       4
Geoff Riley (tutor2u) ‐ Europe an Ever Larger                                                                                  February 2011
Union


                                            How have “New Europe” nations 
                                              performed since EU entry ?
                                      • There are many indicators we can look at:
                                      1. Volume /balance of trade within the EU
                                      2. Economic growth rates and cyclical volatility
                                      3. Relative productivity levels
                                      4. Relative per capita incomes
                                      5. Unemployment rates
                                      6. Consumer price inflation
                                      7. External trade and investment balances


                                                       Slovakian Exports to the UK

                                     2.5
                                            Dining at the Rich Man’s Table
                                              Exports of goods and services, annual value Euro billions
                                                                                                              2.5


                                     2.0                                                                      2.0


                                     1.5                                                                      1.5
                    EUR (billions)


                                                                                                                    billions


                                     1.0                                                                      1.0


                                     0.5                                                                      0.5


                                     0.0                                                                      0.0
                                           99   00    01    02    03    04    05    06    07    08    09
                                                                                                     Source: EuroStat


www.tutor2u.net                                                                                                                           5
Geoff Riley (tutor2u) ‐ Europe an Ever Larger                                                                                                February 2011
Union


                              Exports of goods and services as a share of GDP

                        140
                                        Exports as a share of GDP
                                                   Per cent
                                                                                                                                     140
                        130                                                                                                          130
                        120                                                                                                          120
                        110                                                                                                          110
                        100                                                                                                          100
                         90                                                                                                           90
                         80                                                                                                           80
                    %


                         70                                                                                                           70
                         60                                                                                                           60
                         50                                                                                                           50
                         40                                                                                                           40
                         30                                                                                                           30
                         20                                                                                                           20
                              95     96     97       98     99    00   01     02     03      04    05   06    07        08    09
                                          United Kingdom                Slovenia                    Poland
                                          Slovak Republic               Czech Republic
                                                                                                                    Source: Reuters EcoWin


                                          Trade Balance in Goods and Services

                        10
                               Trade Balance as share of GDP
                                      Balance of Trade as a share of GDP
                                                                                                                                       10

                         5                                                                                                              5

                         0                                                                                                              0

                         -5                                                                                                            -5

                        -10                                                                                                           -10
                    %


                        -15                                                                                                           -15

                        -20                                                                                                           -20

                        -25                                                                                                           -25

                        -30                                                                                                           -30
                              00          01         02          03      04        05         06        07      08           09
                                   Slovak Republic          Czech Republic         Estonia         United Kingdom
                                                                                                                    Source: Reuters EcoWin


www.tutor2u.net                                                                                                                                         6
Geoff Riley (tutor2u) ‐ Europe an Ever Larger                                                                                                                  February 2011
Union


                                                     Comparing Economic Growth Rates

                               7
                                          Out‐Pacing the UK on Growth
                                         Constant Prices, Gross domestic product at market prices, 2000=100, Index
                                                                                                                                                          7
                               6                                                                                                                          6
                               5                                                                                                                          5
                               4                                                                                                                          4
                               3                                                                                                                          3
                               2                                                                                                                          2
                    Percent


                               1                                                                                                                          1
                               0                                                                                                                          0
                              -1                                                                                                                         -1
                              -2                                                                                                                         -2
                              -3                                                                                                                         -3
                              -4                                                                                                                         -4
                              -5                                                                                                                         -5
                                       04          05           06               07       08             09            10         11            12
                                       Poland [c.o.p 1 year]        Czech Republic [c.o.p 1 year]           United Kingdom [c.o.p 1 year]
                                                                                                                                            Source: EuroStat


                                            Volatile Economic Cycles for the Baltic States

                              15
                                       Baltic States have been volatile
                                            Annual % change in Real Gross Domestic Product
                                                                                                                                                        15
                                                                                      Latvia
                              10                                                                                                                        10
                                                                                                        Lithuania
                                                                                                                                        Estonia
                                   5                                                                                                                      5

                                   0                                                                                                                      0
                    Percent


                               -5                                                                                                                        -5

                              -10                                                                                                                      -10

                              -15                                                                                                                      -15

                              -20                                                                                                                      -20
                                          04              05              06              07                08               09             10
                                                     Estonia [ar 4 quarters]                        Latvia [ar 4 quarters]
                                                     Lithuania [ar 4 quarters]


www.tutor2u.net                                                                                                                                                           7
Geoff Riley (tutor2u) ‐ Europe an Ever Larger                                                                                 February 2011
Union


                                Increased investment has supported growth

                        45.0
                                                     Investment ratios
                                Capital Investment at Constant Prices, measured as a % of GDP
                                                                                                                     45.0

                        40.0                                                                                         40.0

                        35.0                                                                                         35.0

                        30.0                                                                                         30.0
                    %


                        25.0                                                                                         25.0

                        20.0                                                                                         20.0

                        15.0                                                                                         15.0
                               00         01         02     03     04          05   06       07      08      09
                                    Czech Republic        Poland        Bulgaria    United Kingdom
                                                                                                     Source: Reuters EcoWin


                                                          Fiat in Poland


www.tutor2u.net                                                                                                                          8
Geoff Riley (tutor2u) ‐ Europe an Ever Larger                                                     February 2011
Union


                           New Europe – a magnet for FDI

                                                               Growing 
                                                   Low         markets
                                                  Labour 
                                                                                      Low land 
                           Highly                  costs                               prices
                          literate 
                         population                           Low 
                                                            business 
                                                             taxes
                                                                           Central 
                                      Success 
                                                                          European 
                                      of early 
                                                                          Location
                                      projects


                                                  Strong FDI


www.tutor2u.net                                                                                              9
Geoff Riley (tutor2u) ‐ Europe an Ever Larger                                                                                                          February 2011
Union


                                    Transport Infrastructure - Total Length of Motorways
                               1000                                      Motorways                                                          1000

                                900                                                                                                           900

                                800                                                                                                           800

                                700                                                                                                           700
                    KM


                                600                                                                                                           600

                                500                                                                                                           500

                                400                                                                                                           400

                                300                                                                                                           300

                                200                                                                                                           200
                                         00         01         02         03         04         05      06         07   08        09
                                               Poland          Hungary             Slovak Republic          Slovenia
                                                                                                                                 Source: EuroStat


                                                Labour Productivity per Person Employed

                               90
                                         Improvements in Productivity
                                             Index of productivity as % of the EU27 average
                                                                                                                                                90

                               80                   Slovenia
                                                                                                                                                80

                               70                                                                                                               70
                                           Czech Republic
                    EU27=100


                               60                                                                                                               60
                                      Hungary
                               50                                                                                                               50
                                                                         Estonia
                                      Poland
                               40                                                                                                               40

                               30                                                                                                               30
                                                                                      Romania
                                           Bulgaria
                               20                                                                                                               20
                                    95 96 97 98 99 00 01 02 03 04 05 06 07 08 09 10 11
                                                         Czech Republic                          Poland                      Hungary
                                                         Estonia                                 Romania
                                                         Slovenia                                Bulgaria
                                                                                                                              Source: Reuters EcoWin


www.tutor2u.net                                                                                                                                                  10
Geoff Riley (tutor2u) ‐ Europe an Ever Larger                                                                                         February 2011
Union


                                     Growth and Living Standards


                                                                                                    Rising per 
                                      Faster          Higher                Increased 
                                                                                                      capita 
                                     growth         productivity              wages
                                                                                                     incomes


                                         Estimated Trend Economic Growth Rates
                              5.5
                                          Estimated Trend Growth
                                                   Potential GDP, percentage change per year
                                                                                                                              5.5
                              5.0                                                                                             5.0
                              4.5                                                                                             4.5
                              4.0                                                                                             4.0
                              3.5                                                                                             3.5
                    Percent


                              3.0                                                                                             3.0
                              2.5                                                                                             2.5
                              2.0                                                                                             2.0
                              1.5                                                                                             1.5
                              1.0                                                                                             1.0
                              0.5                                                                                             0.5
                              0.0                                                                                             0.0
                                    04     05      06            07    08        09        10         11           12
                                                Euro Zone                          Poland
                                                Czech Republic                     United Kingdom
                                                                                                Source: OECD World Economic Outlook


www.tutor2u.net                                                                                                                                 11
Geoff Riley (tutor2u) ‐ Europe an Ever Larger                                                                                                         February 2011
Union


                                      Income convergence for ten new EU members

                               100
                                           Relative Per Capita Incomes
                                           Index of GDP per head, purchasing power standard, EU=100
                                                                                                                                             100
                               90                                                                                                              90
                               80                                                                                                              80
                               70                                                                                                              70
                    EU25=100


                               60                                                                                                              60
                               50                                                                                                              50
                               40                                                                                                              40
                               30                                                                                                              30
                               20                                                                                                              20
                                     00        01          02   03         04      05         06      07         08     09         10
                                               Czech Republic               Estonia                           Latvia
                                               Hungary                      Slovak Republic                   Romania
                                               Poland                       Bulgaria
                                               Slovenia                     Lithuania
                                                                                                                             Source: Reuters EcoWin


                                                           Catching Up and Overtaking!

                               100
                                          Catching up and taking over
                                      GDP per Capita, purchasing power standard, EU25average = 100
                                                                                                                                             100
                               95                                                                                                              95
                               90                                                                                                              90
                               85                                                                                                              85
                               80                                                                                                              80
                    EU25=100


                               75                                                                                                              75
                               70                                                                                                              70
                               65                                                                                                              65
                               60                                                                                                              60
                               55                                                                                                              55
                               50                                                                                                              50
                                     00        01          02   03         04      05         06      07         08     09         10
                                          Czech Republic        Portugal         Greece            Slovenia
                                                                                                                                Source: EuroStat


www.tutor2u.net                                                                                                                                                 12
Geoff Riley (tutor2u) ‐ Europe an Ever Larger                                                                                     February 2011
Union


                                     Unemployment in selected New Member States

                              22.0
                                                    The Picture on Jobs
                                      Percentage of the labour force, annual average, source: Eurostat
                                                                                                                        22.0
                              20.0                                                                                      20.0
                              18.0                                                                                      18.0
                              16.0                                                                                      16.0
                              14.0                                                                                      14.0
                    Percent


                              12.0                                                                                      12.0
                              10.0                                                                                      10.0
                               8.0                                                                                        8.0
                               6.0                                                                                        6.0
                               4.0                                                                                        4.0
                               2.0                                                                                        2.0
                               0.0                                                                                        0.0
                                     03            04       05           06      07     08          09      10
                                          Poland        Czech Republic        Hungary    Slovenia
                                                                                                         Source: Reuters EcoWin


www.tutor2u.net                                                                                                                             13
Geoff Riley (tutor2u) ‐ Europe an Ever Larger                                                                                             February 2011
Union


                                                               Unemployment Rates

                              22.0
                                           Unemployment in the EU
                                           Unemployment - % of labour force, seasonally adjusted
                                                                                                                                22.0
                              20.0                             A third of the Euro Zone's                                       20.0
                                                               15.8 million unemployed 
                              18.0                                                                                              18.0
                                                                      are in Spain
                              16.0                                                                                              16.0
                              14.0                                                                                              14.0
                    Percent


                              12.0                                                                                              12.0
                              10.0                                                                                              10.0
                               8.0                                                                                                8.0
                               6.0                                                                                                6.0
                               4.0                                                                                                4.0
                               2.0                                                                                                2.0
                               0.0                                                                                                0.0
                                      05                  06             07           08               09         10
                                               UK                     Spain            Ireland
                                               Germany                Poland
                                                                                                                 Source: Reuters EcoWin


                                        Inflation Rates for Selected new EU States

                              20.0
                                                                      Inflation
                                                  Annual % change in consumer prices (all items)
                                                                                                                                20.0


                              15.0                                                                                              15.0


                              10.0                                                                                              10.0
                    Percent


                               5.0                                                                                                5.0


                               0.0                                                                                                0.0


                              -5.0                                                                                               -5.0
                                     04              05            06           07            08            09     10
                                     Hungary         Czech Republic        Poland    Latvia        Euro Zone
                                                                                                                 Source: Reuters EcoWin


www.tutor2u.net                                                                                                                                     14
Geoff Riley (tutor2u) ‐ Europe an Ever Larger                                                                                         February 2011
Union


                                           EU Enlargement and the UK economy


                                                 Trade                                          Labour 
                                                                       FDI Flows
                                                 Flows                                         Migration


                                                     UK Exports to some new EU States

                                     4.5
                                                                         Trade
                                             Exports of goods and services, annual data, current prices, £ billion
                                                                                                                     4.5
                                     4.0                                                                             4.0
                                     3.5                                                                             3.5
                                     3.0                                                                             3.0
                    GBP (billions)


                                     2.5                                                                             2.5
                                                                                                                           billions


                                     2.0                                                                             2.0
                                     1.5                                                                             1.5
                                     1.0                                                                             1.0
                                     0.5                                                                             0.5
                                     0.0                                                                             0.0
                                            00     01       02    03      04       05     06     07      08     09
                                                     Poland              Hungary
                                                     Slovakia            Czech Republic


www.tutor2u.net                                                                                                                                 15
Geoff Riley (tutor2u) ‐ Europe an Ever Larger                                                                                             February 2011
Union


                                                UK Trade in Goods and Services with Poland

                                     6.0
                                                         UK Trade with Poland
                                                             Annual value of trade, £ billion
                                                                                                                         6.0
                                     5.5                                                                                 5.5
                                     5.0                                                                                 5.0
                                     4.5                                                                                 4.5
                                     4.0                                                                                 4.0
                    GBP (billions)


                                                                                                                               billions
                                     3.5                                                                                 3.5
                                     3.0                                                                                 3.0
                                     2.5                                                                                 2.5
                                     2.0                                                                                 2.0
                                     1.5                                                                                 1.5
                                     1.0                                                                                 1.0
                                           00       01           02     03         04     05   06   07   08      09
                                           Imports from Poland        Exports to Poland
                                                                                                          Source: Reuters EcoWin


                                                UK Trade in Goods and Services with Poland

                                     6.0
                                                         UK Trade with Poland
                                                             Annual value of trade, £ billion
                                                                                                                         6.0
                                     5.5                                                                                 5.5
                                     5.0        Poland now takes                                                         5.0
                                     4.5         as many exports                                                         4.5
                                     4.0          from the UK as                                                         4.0
                    GBP (billions)


                                                                                                                               billions


                                     3.5            China does                                                           3.5
                                     3.0                                                                                 3.0
                                     2.5                                                                                 2.5
                                     2.0                                                                                 2.0
                                     1.5                                                                                 1.5
                                     1.0                                                                                 1.0
                                           00       01           02     03         04     05   06   07   08      09
                                           Imports from Poland        Exports to Poland
                                                                                                          Source: Reuters EcoWin


www.tutor2u.net                                                                                                                                     16
Geoff Riley (tutor2u) ‐ Europe an Ever Larger                                       February 2011
Union


                          Migration – Push and Pull Factors
                                                         Wages


                                       Jobs                               Welfare


                                              Language           Travel


www.tutor2u.net                                                                               17
Geoff Riley (tutor2u) ‐ Europe an Ever Larger               February 2011
Union


                                      The Migration Stats


                                     Long Term Migration


www.tutor2u.net                                                       18
Geoff Riley (tutor2u) ‐ Europe an Ever Larger                                                         February 2011
Union


                           Supporters of Inward Migration
                       • Fresh skills and boost to innovation
                           – Twenty‐two of Britain's 114 Nobel laureates were born abroad
                           – Tesco, Marks & Spencer, Easy Jet, Google, Yahoo!, eBay, YouTube 
                             all founded or co‐founded by immigrants or their families
                       • Migration is a form of trade and there are gains from trade
                           – If you go to France for an operation, it is classified as trade; if a 
                             French surgeon comes here, it is migration
                           – Reduces labour shortages
                       •   Remittances add to GNP of new Europe
                       •   Net contribution to government tax revenues
                       •   Multiplier and accelerator effects
                       •   May contribute to higher trend growth
                       •   Justified on grounds of freedom, justice and human rights


                           Opponents of unrestricted migration
                       • Extra welfare burden
                       • Downward pressure on real wages and jobs 
                         for domestic workers
                       • Social pressures and tensions
                       • Pressure on property prices and housing rents
                       • Some reports question the size of the 
                         macroeconomic benefit of migration


www.tutor2u.net                                                                                                 19
Geoff Riley (tutor2u) ‐ Europe an Ever Larger                                                                                   February 2011
Union


                                                       Decisions on the Euro
                                   • Entry into the EU involves a commitment to 
                                     join the single currency at some point
                                   • But the timing is flexible
                                   • 5 new EU states have joined since 2004
                                   • Slovenia, Malta, Cyprus, Slovakia and Estonia
                                   • Some have a pegged currency against the Euro
                                   • Others favour a floating exchange rate


                                                       Pegging to the Euro - Estonia and Latvia

                                           Some have pegged to the Euro
                                               Local exchange rates to the Euro, daily value

                              15.660                                                                               15.660
                              15.650                                                                               15.650
                    EUR/EEK


                              15.640                                                                               15.640
                              15.630                                                                               15.630
                              15.620                                                                               15.620

                                            Latvian currency
                                   0.700                                                                           0.700

                                   0.650                                                                           0.650
                         EUR/LVL


                                   0.600                                                                           0.600

                                   0.550                                                                           0.550

                                   0.500                                                                           0.500
                                            00      01         02   03   04   05   06   07   08   09   10 11
                                                                                                       Source: Reuters EcoWin


www.tutor2u.net                                                                                                                           20
Geoff Riley (tutor2u) ‐ Europe an Ever Larger                                                                                                                  February 2011
Union


                                                        Poland - Growth of Real GDP and the Exchange Rate
                                                           Top Pane: Real GDP Bottom Pane: Effective Exchange Rate Index
                                      7
                                      6
                                                Poland – currency depreciation                                                                          7
                                                                                                                                                        6
                                      5                                                                                                                 5
                            Percent


                                      4                                                                                                                 4
                                      3                                                                                                                 3
                                      2                                                                                                                 2
                                      1                                                                                                                 1
                                      0                                                                                                                 0
                             130                                                                                                                        130
                             125                                                                                                                        125
                             120                                                                                                                        120
                             115                                                                                                                        115
                    Index


                             110                                                                                                                        110
                             105                                                                                                                        105
                             100                                                                                                                        100
                              95                                                                                                                         95
                              90                                                                                                                         90
                              85                                                                                                                         85
                                          Jan   Apr   Jul Oct Jan Apr Jul Oct Jan Apr Jul Oct Jan Apr Jul Oct                 Jan   Apr    Jul   Oct
                                                     06                    07                   08                     09                 10
                                                  Poland, Real GDP, precentage change from previous period, Constant Prices
                                                  Effective Exchange Rate Index
                                                                                                                                      Source: Reuters EcoWin


                                                 An ever wider Europe? Or risks of 
                                                      enlargement fatigue?
                                                                                                              • Iceland
                                                                                                              • Croatia
                                                                                                              • Macedonia and 
                                                                                                                Montenegro
                                                                                                              • Bosnia and 
                                                                                                                Herzegovina
                                                                                                              • Serbia
                                                                                                              • Kosovo
                                                                                                              • Turkey
                                                                                                              • Ukraine, Georgia 
                                                                                                                or Tunisia?


www.tutor2u.net                                                                                                                                                          21
Geoff Riley (tutor2u) ‐ Europe an Ever Larger                                    February 2011
Union


                         Enlargement – A Work in Progress
                       • Enlargement ‐ one of EU’s greatest successes
                       • New Europe was vulnerable to the global and 
                         European financial crisis
                       • But many countries have outperformed old Europe 
                         since 2007 on a variety of indicators
                       • They have provided fresh dynamism into the EU
                       • Europe needs it! Since 2005, Britain's economy has 
                         grown by 2%, the Euro Zone's by 4%, Brazil's by 25%, 
                         India's by 47% and China's by 69%
                       • The political significance of enlargement cannot be 
                         underestimated


                                                                  More 
                                                               resources 
                                                               on the EU 
                                                                from the 
                                                                 Tutor2u 
                                                                   blog


www.tutor2u.net                                                                            22

Más contenido relacionado

Similar a EU Enlargement - 2011

Industrial strategy master presentation
Industrial strategy master presentationIndustrial strategy master presentation
Industrial strategy master presentationbisgovuk
 
EU Economy Study Companion 2012
EU Economy Study Companion 2012EU Economy Study Companion 2012
EU Economy Study Companion 2012tutor2u
 
Industrial Strategy summary updated 26 March 2013
Industrial Strategy summary updated 26 March 2013Industrial Strategy summary updated 26 March 2013
Industrial Strategy summary updated 26 March 2013bisgovuk
 
Research context for libraries and publishers
Research context for libraries and publishersResearch context for libraries and publishers
Research context for libraries and publishersAlicia Wise
 
The European Union
The European UnionThe European Union
The European Unionankit goyal
 
Demands공급 발제
Demands공급 발제Demands공급 발제
Demands공급 발제현우 임
 
Innovación: Lecciones de MIT y el Mundo
Innovación: Lecciones de MIT y el MundoInnovación: Lecciones de MIT y el Mundo
Innovación: Lecciones de MIT y el MundoIPAE
 
The EU at a Crossroads: An Action Plan
The EU at a Crossroads: An Action PlanThe EU at a Crossroads: An Action Plan
The EU at a Crossroads: An Action Planthinkingeurope2011
 
The European Union at a Crossroads: An Action Plan
The European Union at a Crossroads: An Action PlanThe European Union at a Crossroads: An Action Plan
The European Union at a Crossroads: An Action Planthinkingeurope2011
 
Mk presentation rome 14 nov 2012
Mk presentation rome 14 nov 2012Mk presentation rome 14 nov 2012
Mk presentation rome 14 nov 2012Elsevier Events
 
European union - The Euro Debate
European union - The Euro DebateEuropean union - The Euro Debate
European union - The Euro Debatemattbentley34
 
El Reto de la Innovación en Perú, lecciones
El Reto de la Innovación en Perú, leccionesEl Reto de la Innovación en Perú, lecciones
El Reto de la Innovación en Perú, leccionesIPAE
 
Growth Week 2011: Ideas for Growth Session 2 - Macroeconomics - 'Internationa...
Growth Week 2011: Ideas for Growth Session 2 - Macroeconomics - 'Internationa...Growth Week 2011: Ideas for Growth Session 2 - Macroeconomics - 'Internationa...
Growth Week 2011: Ideas for Growth Session 2 - Macroeconomics - 'Internationa...The International Growth Centre
 
EU Recovery War Room Slides
EU Recovery War Room SlidesEU Recovery War Room Slides
EU Recovery War Room Slideshiddenlevers
 
Financialinnovationseminarny2011[1]
Financialinnovationseminarny2011[1]Financialinnovationseminarny2011[1]
Financialinnovationseminarny2011[1]Febelfin
 

Similar a EU Enlargement - 2011 (20)

Industrial strategy master presentation
Industrial strategy master presentationIndustrial strategy master presentation
Industrial strategy master presentation
 
EU Economy Study Companion 2012
EU Economy Study Companion 2012EU Economy Study Companion 2012
EU Economy Study Companion 2012
 
Euro crisis
Euro crisisEuro crisis
Euro crisis
 
Industrial Strategy summary updated 26 March 2013
Industrial Strategy summary updated 26 March 2013Industrial Strategy summary updated 26 March 2013
Industrial Strategy summary updated 26 March 2013
 
Research context for libraries and publishers
Research context for libraries and publishersResearch context for libraries and publishers
Research context for libraries and publishers
 
euro crisis
euro crisiseuro crisis
euro crisis
 
euro crisis
euro crisiseuro crisis
euro crisis
 
The European Union
The European UnionThe European Union
The European Union
 
2. european union
2. european union2. european union
2. european union
 
Demands공급 발제
Demands공급 발제Demands공급 발제
Demands공급 발제
 
Euro zone crisis
Euro zone crisisEuro zone crisis
Euro zone crisis
 
Innovación: Lecciones de MIT y el Mundo
Innovación: Lecciones de MIT y el MundoInnovación: Lecciones de MIT y el Mundo
Innovación: Lecciones de MIT y el Mundo
 
The EU at a Crossroads: An Action Plan
The EU at a Crossroads: An Action PlanThe EU at a Crossroads: An Action Plan
The EU at a Crossroads: An Action Plan
 
The European Union at a Crossroads: An Action Plan
The European Union at a Crossroads: An Action PlanThe European Union at a Crossroads: An Action Plan
The European Union at a Crossroads: An Action Plan
 
Mk presentation rome 14 nov 2012
Mk presentation rome 14 nov 2012Mk presentation rome 14 nov 2012
Mk presentation rome 14 nov 2012
 
European union - The Euro Debate
European union - The Euro DebateEuropean union - The Euro Debate
European union - The Euro Debate
 
El Reto de la Innovación en Perú, lecciones
El Reto de la Innovación en Perú, leccionesEl Reto de la Innovación en Perú, lecciones
El Reto de la Innovación en Perú, lecciones
 
Growth Week 2011: Ideas for Growth Session 2 - Macroeconomics - 'Internationa...
Growth Week 2011: Ideas for Growth Session 2 - Macroeconomics - 'Internationa...Growth Week 2011: Ideas for Growth Session 2 - Macroeconomics - 'Internationa...
Growth Week 2011: Ideas for Growth Session 2 - Macroeconomics - 'Internationa...
 
EU Recovery War Room Slides
EU Recovery War Room SlidesEU Recovery War Room Slides
EU Recovery War Room Slides
 
Financialinnovationseminarny2011[1]
Financialinnovationseminarny2011[1]Financialinnovationseminarny2011[1]
Financialinnovationseminarny2011[1]
 

Más de mattbentley34

Slide 1 1mm - the basic economic problem
Slide 1 1mm - the basic economic problemSlide 1 1mm - the basic economic problem
Slide 1 1mm - the basic economic problemmattbentley34
 
Why study economics 2019
Why study economics 2019Why study economics 2019
Why study economics 2019mattbentley34
 
Behavioural economics key terms
Behavioural economics key termsBehavioural economics key terms
Behavioural economics key termsmattbentley34
 
Behavioural economics extra resources
Behavioural economics   extra resourcesBehavioural economics   extra resources
Behavioural economics extra resourcesmattbentley34
 
Behavioural economics
Behavioural economicsBehavioural economics
Behavioural economicsmattbentley34
 
Edexcel practice paper 1 (b)
Edexcel practice paper 1 (b)Edexcel practice paper 1 (b)
Edexcel practice paper 1 (b)mattbentley34
 
The labour market wage determination
The labour market wage determinationThe labour market wage determination
The labour market wage determinationmattbentley34
 
Specimen paper insert
Specimen paper insertSpecimen paper insert
Specimen paper insertmattbentley34
 
AQA - pecan-pie-ajim-planner
AQA - pecan-pie-ajim-plannerAQA - pecan-pie-ajim-planner
AQA - pecan-pie-ajim-plannermattbentley34
 
The Multiplier effect explained
The Multiplier effect explainedThe Multiplier effect explained
The Multiplier effect explainedmattbentley34
 
Model answers nationalism
Model answers nationalismModel answers nationalism
Model answers nationalismmattbentley34
 
Edexcel A level economics exam advice
Edexcel A level economics exam adviceEdexcel A level economics exam advice
Edexcel A level economics exam advicemattbentley34
 
Model answers nationalism & Racialism
Model answers nationalism & RacialismModel answers nationalism & Racialism
Model answers nationalism & Racialismmattbentley34
 
Voting systems in elections
Voting systems in electionsVoting systems in elections
Voting systems in electionsmattbentley34
 
Political representation and democracy
Political representation and democracyPolitical representation and democracy
Political representation and democracymattbentley34
 
Political participation
Political participationPolitical participation
Political participationmattbentley34
 
Political ideologies
Political ideologiesPolitical ideologies
Political ideologiesmattbentley34
 

Más de mattbentley34 (20)

Slide 1 1mm - the basic economic problem
Slide 1 1mm - the basic economic problemSlide 1 1mm - the basic economic problem
Slide 1 1mm - the basic economic problem
 
Why study economics 2019
Why study economics 2019Why study economics 2019
Why study economics 2019
 
Behavioural economics key terms
Behavioural economics key termsBehavioural economics key terms
Behavioural economics key terms
 
Behavioural economics extra resources
Behavioural economics   extra resourcesBehavioural economics   extra resources
Behavioural economics extra resources
 
Behavioural economics
Behavioural economicsBehavioural economics
Behavioural economics
 
Jan 13
Jan 13Jan 13
Jan 13
 
Edexcel practice paper 1 (b)
Edexcel practice paper 1 (b)Edexcel practice paper 1 (b)
Edexcel practice paper 1 (b)
 
The labour market wage determination
The labour market wage determinationThe labour market wage determination
The labour market wage determination
 
Specimen paper insert
Specimen paper insertSpecimen paper insert
Specimen paper insert
 
AQA - pecan-pie-ajim-planner
AQA - pecan-pie-ajim-plannerAQA - pecan-pie-ajim-planner
AQA - pecan-pie-ajim-planner
 
The Multiplier effect explained
The Multiplier effect explainedThe Multiplier effect explained
The Multiplier effect explained
 
Economic review
Economic reviewEconomic review
Economic review
 
Model answers nationalism
Model answers nationalismModel answers nationalism
Model answers nationalism
 
Edexcel A level economics exam advice
Edexcel A level economics exam adviceEdexcel A level economics exam advice
Edexcel A level economics exam advice
 
Monetary policy
Monetary policyMonetary policy
Monetary policy
 
Model answers nationalism & Racialism
Model answers nationalism & RacialismModel answers nationalism & Racialism
Model answers nationalism & Racialism
 
Voting systems in elections
Voting systems in electionsVoting systems in elections
Voting systems in elections
 
Political representation and democracy
Political representation and democracyPolitical representation and democracy
Political representation and democracy
 
Political participation
Political participationPolitical participation
Political participation
 
Political ideologies
Political ideologiesPolitical ideologies
Political ideologies
 

EU Enlargement - 2011

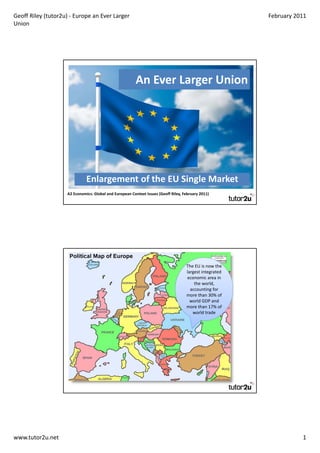
  • 1. Geoff Riley (tutor2u) ‐ Europe an Ever Larger  February 2011 Union An Ever Larger Union Enlargement of the EU Single Market A2 Economics: Global and European Context Issues (Geoff Riley, February 2011) The Map of Europe The EU is now the  largest integrated  economic area in  the world,  accounting for  more than 30% of  world GDP and  more than 17% of  world trade www.tutor2u.net 1
  • 2. Geoff Riley (tutor2u) ‐ Europe an Ever Larger  February 2011 Union Expanding the Single Market • First Expansion – 1973: UK, Ireland and Denmark • Mediterranean Spirit – 1981: Greece – 1986: Portugal and Spain • Entry of the Neutrals – 1995: Austria, Finland and Sweden • The Big Bang – 2004: Latvia, Lithuania, Cyprus, Malta, Slovenia,  Slovakia, Estonia, Hungary, Czech Republic, Poland – 2007: Bulgaria and Romania Backward agrarian sectors? www.tutor2u.net 2
  • 3. Geoff Riley (tutor2u) ‐ Europe an Ever Larger  February 2011 Union Or countries and cities of deep cultural  and political interest Many new EU countries offer surprises www.tutor2u.net 3
  • 4. Geoff Riley (tutor2u) ‐ Europe an Ever Larger  February 2011 Union And lead the way towards a low  carbon economy Benefits of EU Membership Trade and Investment • Free trade access to richer EU markets • Attract inward capital investment EU funding • Structural funds for transport & environment • Farm support (but at lower rate than ‘Old EU’) Macroeconomic stability • Commitment towards joining single currency • Must be fully‐fledged market economies to join www.tutor2u.net 4
  • 5. Geoff Riley (tutor2u) ‐ Europe an Ever Larger  February 2011 Union How have “New Europe” nations  performed since EU entry ? • There are many indicators we can look at: 1. Volume /balance of trade within the EU 2. Economic growth rates and cyclical volatility 3. Relative productivity levels 4. Relative per capita incomes 5. Unemployment rates 6. Consumer price inflation 7. External trade and investment balances Slovakian Exports to the UK 2.5 Dining at the Rich Man’s Table Exports of goods and services, annual value Euro billions 2.5 2.0 2.0 1.5 1.5 EUR (billions) billions 1.0 1.0 0.5 0.5 0.0 0.0 99 00 01 02 03 04 05 06 07 08 09 Source: EuroStat www.tutor2u.net 5
  • 6. Geoff Riley (tutor2u) ‐ Europe an Ever Larger  February 2011 Union Exports of goods and services as a share of GDP 140 Exports as a share of GDP Per cent 140 130 130 120 120 110 110 100 100 90 90 80 80 % 70 70 60 60 50 50 40 40 30 30 20 20 95 96 97 98 99 00 01 02 03 04 05 06 07 08 09 United Kingdom Slovenia Poland Slovak Republic Czech Republic Source: Reuters EcoWin Trade Balance in Goods and Services 10 Trade Balance as share of GDP Balance of Trade as a share of GDP 10 5 5 0 0 -5 -5 -10 -10 % -15 -15 -20 -20 -25 -25 -30 -30 00 01 02 03 04 05 06 07 08 09 Slovak Republic Czech Republic Estonia United Kingdom Source: Reuters EcoWin www.tutor2u.net 6
  • 7. Geoff Riley (tutor2u) ‐ Europe an Ever Larger  February 2011 Union Comparing Economic Growth Rates 7 Out‐Pacing the UK on Growth Constant Prices, Gross domestic product at market prices, 2000=100, Index 7 6 6 5 5 4 4 3 3 2 2 Percent 1 1 0 0 -1 -1 -2 -2 -3 -3 -4 -4 -5 -5 04 05 06 07 08 09 10 11 12 Poland [c.o.p 1 year] Czech Republic [c.o.p 1 year] United Kingdom [c.o.p 1 year] Source: EuroStat Volatile Economic Cycles for the Baltic States 15 Baltic States have been volatile Annual % change in Real Gross Domestic Product 15 Latvia 10 10 Lithuania Estonia 5 5 0 0 Percent -5 -5 -10 -10 -15 -15 -20 -20 04 05 06 07 08 09 10 Estonia [ar 4 quarters] Latvia [ar 4 quarters] Lithuania [ar 4 quarters] www.tutor2u.net 7
  • 8. Geoff Riley (tutor2u) ‐ Europe an Ever Larger  February 2011 Union Increased investment has supported growth 45.0 Investment ratios Capital Investment at Constant Prices, measured as a % of GDP 45.0 40.0 40.0 35.0 35.0 30.0 30.0 % 25.0 25.0 20.0 20.0 15.0 15.0 00 01 02 03 04 05 06 07 08 09 Czech Republic Poland Bulgaria United Kingdom Source: Reuters EcoWin Fiat in Poland www.tutor2u.net 8
  • 9. Geoff Riley (tutor2u) ‐ Europe an Ever Larger  February 2011 Union New Europe – a magnet for FDI Growing  Low  markets Labour  Low land  Highly  costs prices literate  population Low  business  taxes Central  Success  European  of early  Location projects Strong FDI www.tutor2u.net 9
  • 10. Geoff Riley (tutor2u) ‐ Europe an Ever Larger  February 2011 Union Transport Infrastructure - Total Length of Motorways 1000 Motorways  1000 900 900 800 800 700 700 KM 600 600 500 500 400 400 300 300 200 200 00 01 02 03 04 05 06 07 08 09 Poland Hungary Slovak Republic Slovenia Source: EuroStat Labour Productivity per Person Employed 90 Improvements in Productivity Index of productivity as % of the EU27 average 90 80 Slovenia 80 70 70 Czech Republic EU27=100 60 60 Hungary 50 50 Estonia Poland 40 40 30 30 Romania Bulgaria 20 20 95 96 97 98 99 00 01 02 03 04 05 06 07 08 09 10 11 Czech Republic Poland Hungary Estonia Romania Slovenia Bulgaria Source: Reuters EcoWin www.tutor2u.net 10
  • 11. Geoff Riley (tutor2u) ‐ Europe an Ever Larger  February 2011 Union Growth and Living Standards Rising per  Faster  Higher  Increased  capita  growth productivity wages incomes Estimated Trend Economic Growth Rates 5.5 Estimated Trend Growth Potential GDP, percentage change per year 5.5 5.0 5.0 4.5 4.5 4.0 4.0 3.5 3.5 Percent 3.0 3.0 2.5 2.5 2.0 2.0 1.5 1.5 1.0 1.0 0.5 0.5 0.0 0.0 04 05 06 07 08 09 10 11 12 Euro Zone Poland Czech Republic United Kingdom Source: OECD World Economic Outlook www.tutor2u.net 11
  • 12. Geoff Riley (tutor2u) ‐ Europe an Ever Larger  February 2011 Union Income convergence for ten new EU members 100 Relative Per Capita Incomes Index of GDP per head, purchasing power standard, EU=100 100 90 90 80 80 70 70 EU25=100 60 60 50 50 40 40 30 30 20 20 00 01 02 03 04 05 06 07 08 09 10 Czech Republic Estonia Latvia Hungary Slovak Republic Romania Poland Bulgaria Slovenia Lithuania Source: Reuters EcoWin Catching Up and Overtaking! 100 Catching up and taking over GDP per Capita, purchasing power standard, EU25average = 100 100 95 95 90 90 85 85 80 80 EU25=100 75 75 70 70 65 65 60 60 55 55 50 50 00 01 02 03 04 05 06 07 08 09 10 Czech Republic Portugal Greece Slovenia Source: EuroStat www.tutor2u.net 12
  • 13. Geoff Riley (tutor2u) ‐ Europe an Ever Larger  February 2011 Union Unemployment in selected New Member States 22.0 The Picture on Jobs Percentage of the labour force, annual average, source: Eurostat 22.0 20.0 20.0 18.0 18.0 16.0 16.0 14.0 14.0 Percent 12.0 12.0 10.0 10.0 8.0 8.0 6.0 6.0 4.0 4.0 2.0 2.0 0.0 0.0 03 04 05 06 07 08 09 10 Poland Czech Republic Hungary Slovenia Source: Reuters EcoWin www.tutor2u.net 13
  • 14. Geoff Riley (tutor2u) ‐ Europe an Ever Larger  February 2011 Union Unemployment Rates 22.0 Unemployment in the EU Unemployment - % of labour force, seasonally adjusted 22.0 20.0 A third of the Euro Zone's  20.0 15.8 million unemployed  18.0 18.0 are in Spain 16.0 16.0 14.0 14.0 Percent 12.0 12.0 10.0 10.0 8.0 8.0 6.0 6.0 4.0 4.0 2.0 2.0 0.0 0.0 05 06 07 08 09 10 UK Spain Ireland Germany Poland Source: Reuters EcoWin Inflation Rates for Selected new EU States 20.0 Inflation Annual % change in consumer prices (all items) 20.0 15.0 15.0 10.0 10.0 Percent 5.0 5.0 0.0 0.0 -5.0 -5.0 04 05 06 07 08 09 10 Hungary Czech Republic Poland Latvia Euro Zone Source: Reuters EcoWin www.tutor2u.net 14
  • 15. Geoff Riley (tutor2u) ‐ Europe an Ever Larger  February 2011 Union EU Enlargement and the UK economy Trade  Labour  FDI Flows Flows Migration UK Exports to some new EU States 4.5 Trade Exports of goods and services, annual data, current prices, £ billion 4.5 4.0 4.0 3.5 3.5 3.0 3.0 GBP (billions) 2.5 2.5 billions 2.0 2.0 1.5 1.5 1.0 1.0 0.5 0.5 0.0 0.0 00 01 02 03 04 05 06 07 08 09 Poland Hungary Slovakia Czech Republic www.tutor2u.net 15
  • 16. Geoff Riley (tutor2u) ‐ Europe an Ever Larger  February 2011 Union UK Trade in Goods and Services with Poland 6.0 UK Trade with Poland Annual value of trade, £ billion 6.0 5.5 5.5 5.0 5.0 4.5 4.5 4.0 4.0 GBP (billions) billions 3.5 3.5 3.0 3.0 2.5 2.5 2.0 2.0 1.5 1.5 1.0 1.0 00 01 02 03 04 05 06 07 08 09 Imports from Poland Exports to Poland Source: Reuters EcoWin UK Trade in Goods and Services with Poland 6.0 UK Trade with Poland Annual value of trade, £ billion 6.0 5.5 5.5 5.0 Poland now takes  5.0 4.5 as many exports  4.5 4.0 from the UK as  4.0 GBP (billions) billions 3.5 China does 3.5 3.0 3.0 2.5 2.5 2.0 2.0 1.5 1.5 1.0 1.0 00 01 02 03 04 05 06 07 08 09 Imports from Poland Exports to Poland Source: Reuters EcoWin www.tutor2u.net 16
  • 17. Geoff Riley (tutor2u) ‐ Europe an Ever Larger  February 2011 Union Migration – Push and Pull Factors Wages Jobs Welfare Language Travel www.tutor2u.net 17
  • 18. Geoff Riley (tutor2u) ‐ Europe an Ever Larger  February 2011 Union The Migration Stats Long Term Migration www.tutor2u.net 18
  • 19. Geoff Riley (tutor2u) ‐ Europe an Ever Larger  February 2011 Union Supporters of Inward Migration • Fresh skills and boost to innovation – Twenty‐two of Britain's 114 Nobel laureates were born abroad – Tesco, Marks & Spencer, Easy Jet, Google, Yahoo!, eBay, YouTube  all founded or co‐founded by immigrants or their families • Migration is a form of trade and there are gains from trade – If you go to France for an operation, it is classified as trade; if a  French surgeon comes here, it is migration – Reduces labour shortages • Remittances add to GNP of new Europe • Net contribution to government tax revenues • Multiplier and accelerator effects • May contribute to higher trend growth • Justified on grounds of freedom, justice and human rights Opponents of unrestricted migration • Extra welfare burden • Downward pressure on real wages and jobs  for domestic workers • Social pressures and tensions • Pressure on property prices and housing rents • Some reports question the size of the  macroeconomic benefit of migration www.tutor2u.net 19
  • 20. Geoff Riley (tutor2u) ‐ Europe an Ever Larger  February 2011 Union Decisions on the Euro • Entry into the EU involves a commitment to  join the single currency at some point • But the timing is flexible • 5 new EU states have joined since 2004 • Slovenia, Malta, Cyprus, Slovakia and Estonia • Some have a pegged currency against the Euro • Others favour a floating exchange rate Pegging to the Euro - Estonia and Latvia Some have pegged to the Euro Local exchange rates to the Euro, daily value 15.660 15.660 15.650 15.650 EUR/EEK 15.640 15.640 15.630 15.630 15.620 15.620 Latvian currency 0.700 0.700 0.650 0.650 EUR/LVL 0.600 0.600 0.550 0.550 0.500 0.500 00 01 02 03 04 05 06 07 08 09 10 11 Source: Reuters EcoWin www.tutor2u.net 20
  • 21. Geoff Riley (tutor2u) ‐ Europe an Ever Larger  February 2011 Union Poland - Growth of Real GDP and the Exchange Rate Top Pane: Real GDP Bottom Pane: Effective Exchange Rate Index 7 6 Poland – currency depreciation 7 6 5 5 Percent 4 4 3 3 2 2 1 1 0 0 130 130 125 125 120 120 115 115 Index 110 110 105 105 100 100 95 95 90 90 85 85 Jan Apr Jul Oct Jan Apr Jul Oct Jan Apr Jul Oct Jan Apr Jul Oct Jan Apr Jul Oct 06 07 08 09 10 Poland, Real GDP, precentage change from previous period, Constant Prices Effective Exchange Rate Index Source: Reuters EcoWin An ever wider Europe? Or risks of  enlargement fatigue? • Iceland • Croatia • Macedonia and  Montenegro • Bosnia and  Herzegovina • Serbia • Kosovo • Turkey • Ukraine, Georgia  or Tunisia? www.tutor2u.net 21
  • 22. Geoff Riley (tutor2u) ‐ Europe an Ever Larger  February 2011 Union Enlargement – A Work in Progress • Enlargement ‐ one of EU’s greatest successes • New Europe was vulnerable to the global and  European financial crisis • But many countries have outperformed old Europe  since 2007 on a variety of indicators • They have provided fresh dynamism into the EU • Europe needs it! Since 2005, Britain's economy has  grown by 2%, the Euro Zone's by 4%, Brazil's by 25%,  India's by 47% and China's by 69% • The political significance of enlargement cannot be  underestimated More  resources  on the EU  from the  Tutor2u  blog www.tutor2u.net 22