
Recomendados
Recomendados
Más contenido relacionado
Similar a Mhf4 U Trig
Similar a Mhf4 U Trig (20)
Último
Último (20)
Mhf4 U Trig
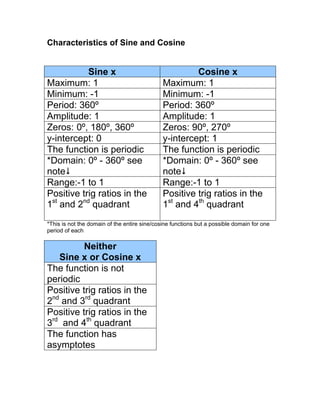
- 1. Characteristics of Sine and Cosine Sine x Cosine x Maximum: 1 Maximum: 1 Minimum: -1 Minimum: -1 Period: 360º Period: 360º Amplitude: 1 Amplitude: 1 Zeros: 0º, 180º, 360º Zeros: 90º, 270º y-intercept: 0 y-intercept: 1 The function is periodic The function is periodic *Domain: 0º - 360º see *Domain: 0º - 360º see note note Range:-1 to 1 Range:-1 to 1 Positive trig ratios in the Positive trig ratios in the 1st and 2nd quadrant 1st and 4th quadrant *This is not the domain of the entire sine/cosine functions but a possible domain for one period of each Neither Sine x or Cosine x The function is not periodic Positive trig ratios in the 2nd and 3rd quadrant Positive trig ratios in the 3rd and 4th quadrant The function has asymptotes
- 2. Graph of Sine and Cosine in Degrees and Radians Name _____________ Date ______________ 1a) Graph y=Sine (x) using degrees. (x-axis is in increments of 15º, y-axis is in increments of 0.5) y x Characteristics: Max. value:__________ Min. value: ___________ y intercept: __________ x intercept (zeros): ________ 1b) Graph y=Sine (x) using radians. (x-axis is in increments of , y-axis is in increments of 0.5) 12 y x Characteristics: Max. value:__________ Min. value: ___________ y intercept: __________ x intercept (zeros): ________
- 3. 2a) Graph y=Cosine x using degrees. (x-axis is in increments of 15º, y-axis is in increments of 0.5) y x Characteristics: Max. value:__________ Min. value: ___________ y intercept: __________ x intercepts (zeros): ________ 2b) Graph y=Cosine x using radians. (x-axis is in increments of , y-axis is in increments of 0.5) 12 y x Characteristics: Max. value:__________ Min. value: ___________ y intercept: __________ x intercepts (zeros): ________
- 4. Graph of Sine and Cosine in Degrees and Radians
- 5. Complete Frayer Model for Sine and Cosine Functions Using Radians Complete each Frayer Model with information on each function IN RADIANS. Period Zeros Sine θ Y-intercept Characteristics Maximum: Minimum: Amplitude: Period Zeros Cosine θ Y-intercept Characteristics Maximum: Minimum: Amplitude:
- 6. Completed Frayer Model for Sine and Cosine Functions Using Radians (Answers) Complete each Frayer Model with information on each function IN RADIANS. Period Zeros 2π Zeros: 0, π, 2π, k Sine θ Y-intercept 0 Characteristics Maximum: 1 Minimum: -1 Amplitude: 1 Period Zeros 2π , 3 , k 2 2 2 Cosine θ Y-intercept 1 Characteristics Maximum: 1 Minimum: -1 Amplitude: 1
- 7. Reciprocal Trigonometric Functions Name ____________________ Match the functions on the left with their reciprocals on the right. 1. sin a. 1 cos 2. cos b. 1 cot 3. tan c. 1 tan 4. sec d. 1 csc 5. csc e. 1 sin 6. cot f. 1 sec State restrictions on each function: (2 x 3)( x 7) 7. ( x 4)( x 2) x(2 x 1) 8. (3x 2)( x 2) ( x 4)( x 4) 9. x( x 3)( x 2) ( x 7)(2 x 5) 10. x( x 9)(3x 4)
- 8. Reciprocal Trigonometric Functions (Answers) Name ____________________ Match the functions on the left with their reciprocals on the right. 1. sin D a. 1 cos 2. cos F b. 1 cot 3. tan B c. 1 tan 4. sec A d. 1 csc 5. csc E e. 1 sin 6. cot C f. 1 sec State restrictions on each function: (2 x 3)( x 7) 7. ( x 4)( x 2) x 4, 2 x(2 x 1) 8. (3x 2)( x 2) x 2 3 , 2 ( x 4)( x 4) 9. x 0,3,2 x( x 3)( x 2) ( x 7)(2 x 5) 10. x( x 9)(3x 4) x 0,9, 3 4
- 9. Graphing Secondary Trig. Functions in Radians Complete the table as shown: x Sin (x) Cos (x) 3 4 6 12 0 12 6 4 3 5 12 2 7 12 2 3 3 4 5 6 11 12
- 10. x Sin (x) Cos (x) 13 12 7 6 5 4 4 3 17 12 3 2 19 12 5 3 7 4 11 6 23 12 2 The remaining columns of the table are for the RECIPROCAL trigonometric functions. csc x sec x 1 1 You know that and . sin x cos x To find the values to graph these functions, simply divide “1” by each of the values from sin x or cos x. 4 For instance, since sin 0.8660 , csc 4 1 1.1547 3 3 0.8660 Label the top of the extra columns with csc (x) and sec (x), and then fill in their corresponding values.
- 11. What do you notice about csc0 , csc , csc2 , sec , sec 3 ? 2 2 Why does this happen? What occurs on the graphs of the reciprocals at those points? State the restrictions of the secant and cosecant functions: Secant: Cosecant:
- 12. Answers Sine x Cosine x Period: 2 Period: 2 Maximum Point: Maximum Points: 0,1 2 ,1 ,1 2 Minimum Point: Minimum Point: , 1 3 , 1 2 Y-intercept: 1 Y-intercept: 0 3 Zeros: , 2 2 Zeros: 0, 2
- 13. Completed table as shown: x Sin (x) Csc (x) Cos (x) Sec (x) -0.8660 -1.155 0.5 2 3 -0.7071 -1.414 0.7071 1.4142 4 -0.5 -2 0.8660 1.1547 6 -0.2588 -3.864 0.9659 1.0353 12 0 0 ERROR 1 1 0.2588 3.8637 0.9659 1.0353 12 0.5 2 0.8660 1.1547 6 0.7071 1.4142 0.7071 1.4142 4 0.8660 1.1547 0.5 2 3 5 0.9659 1.0353 0.2588 3.8637 12 1 1 0 ERROR 2 7 0.9659 1.0353 -0.2588 -3.864 12 2 0.8660 1.1547 -0.5 -2 3 3 0.7071 1.4142 -0.7071 -1.414 4 5 0.5 2 -0.8660 -1.155 6 11 0.2588 3.8637 -0.9659 -1.035 12 0 ERROR -1 -1
- 14. Answers continued x Sin (x) Csc (x) Cos (x) Sec (x) 13 -0.2588 -3.864 -0.9659 -1.035 12 7 -0.5 -2 -0.8660 -1.155 6 5 -0.7071 -1.414 -0.7071 -1.414 4 4 -0.8660 -1.155 -0.5 -2 3 17 -0.9659 -1.035 -0.2588 -3.864 12 3 -1 -1 0 ERROR 2 19 -0.9659 -1.035 0.2588 3.8637 12 5 -0.8660 -1.155 0.5 2 3 7 -0.7071 -1.414 0.7071 1.4142 4 11 -0.5 -2 0.8660 1.1547 6 23 -0.2588 -3.864 0.9659 1.0353 12 2 0 ERROR 1 1 The remaining columns of the table are for the RECIPROCAL trigonometric functions. csc x sec x 1 1 You know that and . sin x cos x To find the values to graph these functions, simply divide “1” by each of the values from sin x or cos x. 4 For instance, since sin 0.8660 , csc 4 1 1.1547 3 3 0.8660 Label the top of the extra columns with csc (x) and sec (x) , then fill in their corresponding values.
- 15. Answers continued What do you notice about csc0 , csc , csc2 , sec , sec 3 ? 2 2 ERROR Why does this happen? Because you are dividing by zero, which is undefined What occurs on the graphs of the reciprocals at those points? Vertical lines State the restrictions of the secant and cosecant functions: Secant: x , 3 nor any decrease or increase by 2 2 Cosecant: x 0, ,2 nor any of their multiples
- 16. Reciprocal Trigonometric Functions Practice Knowledge Find each function value: csc , cos , if sec 2.5 2 1. if sin 2. 4 3. sin , if csc 3 4. sin , if csc 15 1 sec , if cos sec , if cos 5 5. 6. 7 26 14 csc , if sin cos , if sec 11 7. 8. 6 3 sin , if csc sec , if cos 3 6 9. 10. 3 12 Application Find each function value (keep answers in radical form): csc tan sec , if sin 6 3 11. , if 12. 12 3 3 cos , if cot sin , if cos 3 13. 14. 3 2 15. sec , if csc 15 16. cos , if csc 15 2 17. sec , if tan 3 18. csc , if sin 12 2 cos , if sin sin , if tan 5 19. 20. 13 5 ANSWERS: 4 1 1 1. 2. -0.4 3. 4. 5. 7 2 3 15 26 6 3 3 12 6. 7. 8. 9. 10. 5 11 14 3 6 6 1 1 15 11. 5 12. 13. 14. 15. 3 2 2 14 14 12 12 2 16. 17. 2 18. 19. 20. 15 2 13 3
- 17. Characteristics of Tangent and Cotangent Functions Tangent x Cotangent x No maximum No maximum No minimum No minimum Period: 180º Period: 180º Zeros: 0º, 180º, 360º Zeros: 90º, 270º y-intercept: 0 y-intercept: 1
- 18. Graphs of Tangent and Cotangent in Degrees On the given set of axes, graph Tangent x and Cotangent x. (x-axis is in increments of 15º) (y-axis is in increments of 0.5) y = Tangent (x) y x Characteristics: y = Cotangent (x) y x Characteristics:
- 19. Graphs of Tangent and Cotangent in Radians On the given set of axes, graph Tangent x and Cotangent x. (x-axis is in increments of ) 12 (y-axis is in increments of 0.5) y = Tangent (x) y x Characteristics: y = Cotangent (x) y x Characteristics:
- 20. Graphs of Tangent and Cotangent in Radians (Answers) In the solution given for cotx=- the graph does not have any holes, only asymptotes
- 21. Frayer Model for Tangent and Cotangent Complete each Frayer Model with information on each function IN RADIANS. Period Zeros Tangent θ Y-intercept Characteristics Maximum: Minimum: Asymptotes: Period Zeros Cotangent θ Y-intercept Characteristics Maximum: Minimum: Asymptotes:
- 22. Frayer Model for Tangent and Cotangent (Answers) Complete each Frayer Model with information on each function IN RADIANS. Period Zeros 0, , 2 Tangent θ Y-intercept Characteristics 0 Maximum: None Minimum: None 3 Asymptotes: , 2 2 Period Zeros None Cotangent θ Y-intercept Characteristics None Maximum: None 3 Minimum: None ‘Holes’ at , 2 2 Asymptotes: 0, , 2
- 23. Rate of Change for Trigonometric Functions Given the function: f ( ) 3sin 6 1. Sketch f on an interval , 76 6 2. Is the function increasing or decreasing on the interval to 2 . 3 3 2 3. Draw the line through the points f and f 3 3 4. Find the average rate of change of the function f ( ) 3sin from to 6 3 2 . 3 5. What does this mean? 6. Describe how to find the instantaneous rate of change of f ( ) 3sin at 6 . What does this mean? 3
- 24. Rate of Change for Trigonometric Functions (Answers) Given the function: f ( ) 3sin 6 *And the points: 2 3 3 7 1. Sketch on an interval , 6 6 2. Is the function increasing or decreasing on the interval to 2 . Increasing 3 3 2 3. Draw the line through the points f and f 3 3 4. Find the average rate of change of the function f ( ) 3sin from to 6 3 2 . 3 f f 2 3 1.5 3 1.5 0.025 3 2 3 3 3 3
- 25. (Answers continued) 5. What does this mean? 2 This is the slope of the line through the points ,1.5 and ,3 3 3 6. Find the instantaneous rate of change at . 3 To find instantaneous rate of change at , choose values for θ which move closer to 3 3 2 from . 3 f f 2 3 2.5981 1.5 1.0981 0.0366 At 2 2 3 6 6 5 5 f f 2.1213 1.5 0.6213 At 12 3 0.0414 12 5 12 3 12 12 7 7 f f 1.9284 1.5 0.4284 At 18 3 0.0428 18 7 18 3 18 18 13 13 f f 1.7207 1.5 0.2207 At 36 3 0.0441 36 13 36 3 36 36 61 61 f f 1.5451 1.5 0.0451 At 180 3 0.0451 180 61 1 1 180 3 Approaches 0.05. This means that the slope of the line tangent to f ( ) 3sin at is 0.05 6 3
- 26. Rate of Change for Trigonometric Functions: Problems Practice and participation Task For each of the following functions, sketch the graph on the indicated interval. Find the average rate of change using the identified points, and then find the instantaneous rate of change at the indicated point. 1. In a simple arc for an alternating current circuit, the current at any instant t is given by the function f (t) =15sin (60t). Graph the function on the interval 0 ≤ t ≤ 5. Find the average rate of change as t goes from 2 to 3. Find the instantaneous rate of change at t = 2. 2. The weight at the end of a spring is observed to be undergoing simple harmonic motion which can be modeled by the function D (t) =12sin (60π t). Graph the function on the interval 0 ≤ t ≤ 1. Find the average rate of change as t goes from 0.05 to 0.40. Find the instantaneous rate of change at t = 0.40. 3. In a predator-prey system, the number of predators and the number of prey tend to vary in a periodic manner. In a certain region with cats as predators and mice as prey, the mice population M varied according to the equation M=110250sin(1/2)π t, where t is the time in years since January 1996. Graph the function on the interval 0≤ t ≤ 2. Find the average rate of change as t goes from 0.75 to 0.85. Find the instantaneous rate of change at t = 0.85. 4. A Ferris Wheel with a diameter of 50 ft rotates every 30 seconds. The vertical position of a person on the Ferris Wheel, above and below an imaginary horizontal plane through the center of the wheel can be modeled by the equation h (t) =25sin12t. Graph the function on the interval 15 ≤ t ≤ 30. Find the average rate of change as t goes from 24 to 24.5. Find the instantaneous rate of change at t = 24. 5. The depth of water at the end of a pier in Vacation Village varies with the tides throughout the day and can be modeled by the equation D=1.5cos [0.575(t-3.5)] + 3.8. Graph the function on the interval 0 ≤ t ≤ 10. Find the average rate of change as t goes from 4.0 to 6.5. Find the instantaneous rate of change at t = 6.5.
- 27. Rate of Change for Trigonometric Functions: Problems (Answers) 1. AVERAGE RATE OF INSTANTANEOUS CHANGE = -12.99 RATE OF CHANGE = -8 2. AVERAGE RATE OF INSTANTANEOUS CHANGE = 27.5629 RATE OF CHANGE = 10 3. AVERAGE RATE OF INSTANTANEOUS CHANGE = 53460 RATE OF CHANGE = 40,000 4. AVERAGE RATE OF INSTANTANEOUS CHANGE = 1.88 RATE OF CHANGE = 1.620 5. AVERAGE RATE OF INSTANTANEOUS CHANGE = -0.66756 RATE OF CHANGE = - 0.9