Academic demand data template 9 22
•Descargar como XLSX, PDF•
1 recomendación•174 vistas


Recomendados
Más contenido relacionado
Más de Metropolitan Community College-Kansas City
Más de Metropolitan Community College-Kansas City (20)
Último
Último (20)
Academic demand data template 9 22
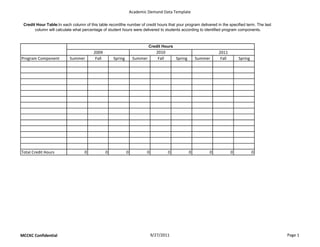
- 1. Academic Demand Data Template Credit Hour Table:In each column of this table recordthe number of credit hours that your program delivered in the specified term. The last column will calculate what percentage of student hours were delivered to students according to identified program components. Credit Hours 2009 2010 2011 Program Component Summer Fall Spring Summer Fall Spring Summer Fall Spring Total Credit Hours 0 0 0 0 0 0 0 0 0 MCCKC Confidential 9/27/2011 Page 1