Climate Change - How We Know What We Know
•Descargar como PPTX, PDF•
0 recomendaciones•370 vistas

Information largely from NASA website (http://climate.nasa.gov/evidence) with interpretive slides pulled from Wikipedia and other websites.

Recomendados
Más contenido relacionado
La actualidad más candente
La actualidad más candente (20)
Similar a Climate Change - How We Know What We Know
Similar a Climate Change - How We Know What We Know (20)
Último
Último (20)
Climate Change - How We Know What We Know
- 1. DeLapa | Consulting Climate Change - The Earth Is Warming How and What We Know
- 2. DeLapa | Consulting The Logic 1. Concentrations of greenhouse gases (CO2, methane, others) are increasing in the atmosphere. 2. Greenhouse gases trap heat (i.e., Greenhouse Effect). 3. Scientific evidence (data) of atmospheric and oceanic warming is overwhelming. Over the past 30 years the data has only gotten stronger. 4. 97%+ of climate scientists agree that human activities, principally the burning of hydrocarbons, are causing the earth to warm and the climate to change quickly and dramatically. 5. Every reputable scientific association accepts this as fact as well.
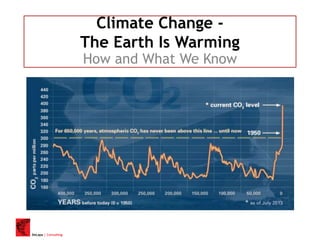
- 3. DeLapa | Consulting Atmospheric CO2 Over the Past 400,000 Years This graph, based on the comparison of atmospheric samples contained in ice cores and more recent direct measurements, provides evidence that atmospheric CO2 has increased since the Industrial Revolution. (Source: NOAA)
- 4. DeLapa | Consulting Atmospheric CO2 Over the Past 60 Years The Keeling Curve is a graph which plots the ongoing change in concentration of carbon dioxide in Earth's atmosphere since 1958. It is based on continuous measurements taken at the Mauna Loa Observatory in Hawaii that began under the supervision of Charles David Keeling. Keeling's measurements showed the first significant evidence of rapidly increasing carbon dioxide levels in the atmosphere. Source: Wikipedia
- 5. DeLapa | Consulting The Greenhouse Effect – Simple
- 6. DeLapa | Consulting The Greenhouse Effect – Less Simple The increase in atmospheric CO2 and other greenhouse gases has increased the amount of infrared radiation absorbed and re-emitted by these molecules in the atmosphere. The Earth receives energy from the Sun in the form of visible light and ultraviolet radiation, which is then re-radiated away from the surface as thermal radiation in infrared wavelengths. Some of this thermal radiation is then absorbed by greenhouse gases in the atmosphere and re-emitted in all directions, some back downwards, increasing the amount of energy bombarding the Earth's surface. This increase in downward infrared radiation has been observed through spectroscopy, which measures changes in the electromagnetic spectrum. – Source: Skeptical Science
- 7. DeLapa | Consulting Rising Global Temperatures Global mean land-ocean temperature change from 1880– 2012, relative to the 1951–1980 mean. The black line is the annual mean and the red line is the 5-year running mean. The green bars show uncertainty estimates. Source: NASA GISS All three major global surface temperature reconstructions show that Earth has warmed since 1880. Most of this warming has occurred since the 1970s, with the 20 warmest years having occurred since 1981 and with all 10 of the warmest years occurring in the past 12 years. Even though the 2000s witnessed a solar output decline resulting in an unusually deep solar minimum in 2007-2009, surface temperatures continue to increase. Source: NASA
- 8. DeLapa | Consulting Warming Oceans The oceans have absorbed much of this increased heat, with the top 700 meters (about 2,300 feet) of ocean showing warming of 0.302 degrees Fahrenheit since 1969 Source: NASA
- 9. DeLapa | Consulting Shrinking Ice Sheets - Global Global glacial mass balance in the last fifty years, reported to the WGMS and NSIDC. The increasing downward trend in the late 1980s is symptomatic of the increased rate and number of retreating glaciers. Source: Wikipedia
- 10. DeLapa | Consulting Shrinking Ice Sheets - Greenland Satellites use gravity data to measure the total mass balance and have found the ice sheet is losing ice mass at an accelerating rate (Velicogna 2009). The Greenland and Antarctic ice sheets have decreased in mass. Data from NASA's Gravity Recovery and Climate Experiment show Greenland lost 150 to 250 cubic kilometers (36 to 60 cubic miles) of ice per year between 2002 and 2006, while Antarctica lost about 152 cubic kilometers (36 cubic miles) of ice between 2002 and 2005. Source: NASA
- 11. DeLapa | Consulting Declining Arctic Sea Ice September ice extent from 1979 to 2009 shows a continued decline. The September rate of sea ice decline since 1979 has now increased to 11.2 percent per decade. Sea Ice Index data. —Credit: National Snow and Ice Data Center Both the extent and thickness of Arctic sea ice has declined rapidly over the last several decades. Source: NASA
- 12. DeLapa | Consulting Glacial Retreat Global glacial mass balance in the last fifty years, reported to the WGMS and NSIDC. The increasing downward trend in the late 1980s is symptomatic of the increased rate and number of retreating glaciers. Source: Wikipedia
- 13. DeLapa | Consulting Sea Level Rise Global sea level rose about 17 centimeters (6.7 inches) in the last century. The rate in the last decade, however, is nearly double that of the last century. Source: NOAA
- 14. DeLapa | Consulting Increase in Extreme Events The number of record high temperature events in the United States has been increasing, while the number of record low temperature events has been decreasing, since 1950. The U.S. has also witnessed increasing numbers of intense rainfall events. Source: NASA The ratio of record daily high temperatures to record daily lows observed at about 1,800 weather stations in the 48 contiguous United States from January 1950 through September 2009. The authors of a recent study, Rahmstorf & Coumou (2011), sought to find out is how much of these extreme events can we put down to the slowly evolving change in climate, and how much is due to random variations in weather. They developed a statistical approach to evaluate record-breaking events. They found that long-term warming increased the odds of record warm events in global temperature, and when applied to the 2010 monster summer heatwave in Moscow, Russia, they calculated an 80% probability the record-breaking heatwave would not have happened without climate warming.
- 15. DeLapa | Consulting Ocean Acidification Since the beginning of the Industrial Revolution, the acidity of surface ocean waters has increased by about 30 percent. This increase is the result of humans emitting more carbon dioxide into the atmosphere and hence more being absorbed into the oceans. The amount of carbon dioxide absorbed by the upper layer of the oceans is increasing by about 2 billion tons per year. Source: NASA
- 16. DeLapa | Consulting Scientific Consensus Consensus: 99.84% of Peer-Reviewed Articles Support the Idea of Global Warming. DeSmogBlog
- 17. DeLapa | Consulting Scientific Consensus Data from 2010 (with signficantly more scientific data since then).
- 18. DeLapa | Consulting Scientific Consensus American Association for the Advancement of Science "The scientific evidence is clear: global climate change caused by human activities is occurring now, and it is a growing threat to society." (2006) American Chemical Society "Comprehensive scientific assessments of our current and potential future climates clearly indicate that climate change is real, largely attributable to emissions from human activities, and potentially a very serious problem." (2004) American Geophysical Union "Human‐induced climate change requires urgent action. Humanity is the major influence on the global climate change observed over the past 50 years. Rapid societal responses can significantly lessen negative outcomes." (Adopted 2003, revised and reaffirmed 2007, 2012, 2013) American Meteorological Society "It is clear from extensive scientific evidence that the dominant cause of the rapid change in climate of the past half century is human-induced increases in the amount of atmospheric greenhouse gases, including carbon dioxide (CO2), chlorofluorocarbons, methane, and nitrous oxide." (2012)
Notas del editor
- This graph, based on the comparison of atmospheric samples contained in ice cores and more recent direct measurements, provides evidence that atmospheric CO2 has increased since the Industrial Revolution. (Source: NOAA)