

Recomendados
Recomendados
Más contenido relacionado
La actualidad más candente
La actualidad más candente (15)
Destacado
Destacado (20)
Similar a Western reserve q1 2009 client update letter
Similar a Western reserve q1 2009 client update letter (20)
Más de Michael Durante
Más de Michael Durante (20)
Último
Último (20)
Western reserve q1 2009 client update letter
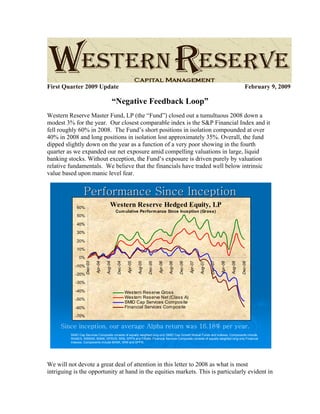
- 1. First Quarter 2009 Update February 9, 2009 “Negative Feedback Loop” Western Reserve Master Fund, LP (the “Fund”) closed out a tumultuous 2008 down a modest 3% for the year. Our closest comparable index is the S&P Financial Index and it fell roughly 60% in 2008. The Fund’s short positions in isolation compounded at over 40% in 2008 and long positions in isolation lost approximately 35%. Overall, the fund dipped slightly down on the year as a function of a very poor showing in the fourth quarter as we expanded our net exposure amid compelling valuations in large, liquid banking stocks. Without exception, the Fund’s exposure is driven purely by valuation relative fundamentals. We believe that the financials have traded well below intrinsic value based upon manic level fear. Performance Since InceptionPerformance Since Inception SMID Cap Services Composite consists of equally weighted long-only SMID Cap Growth Mutual Funds and Indexes. Components include WAAEX, WBSNX, BANK, DPSVS, IWM, SPFN and FINAN. Financial Services Composite consists of equally weighted long-only Financial Indexes. Components include BANK, IWM and SPFN. Since inception, our average Alpha return was 16.18% per year. Western Reserve Hedged Equity, LP Cumulative Performance Since Inception (Gross) -70% -60% -50% -40% -30% -20% -10% 0% 10% 20% 30% 40% 50% 60% Dec-03 Apr-04 Aug-04 Dec-04 Apr-05 Aug-05 Dec-05 Apr-06 Aug-06 Dec-06 Apr-07 Aug-07 Dec-07 Apr-08 Aug-08 Dec-08 Western Reserve Gross Western Reserve Net (Class A) SMID Cap Services Composite Financial Services Composite We will not devote a great deal of attention in this letter to 2008 as what is most intriguing is the opportunity at hand in the equities markets. This is particularly evident in
- 2. the much feared financial sector coupled with what we believe are the most suspect debates in capitalism’s history – mark-to-market accounting (“MTM”) and the systematic “nationalization” of the banking system. The first of which is largely inaccurate and the latter of which is neither necessary nor sane. We believe the mere existence of these debates has had a “purging” effect on the sector and therefore fuel for what we believe will eventually result in dramatic gains. Mark-to-Zero Accounting A refresher on the “Negative Feedback Loop” Paralyzing the Economy Western Reserve has been discussing the inherent flaws in “mark-to-market” (MTM) since 2007 and we remain stunned that this is still debated in 2009. This remains the primary reason why the country has been unable to stabilize itself amid the worst financial crisis in perhaps seven decades. MTM is “theoretical accounting” which is seriously flawed, inaccurate and self-fulfilling. We believe that it must and will be dismantled either directly or indirectly via the Bernanke/Bair Plan. Over recent months, pundits have been willing to debate nationalizing the entire US financial system and thus unwittingly embracing what would be the de facto end of capitalism. Would not a simple review of the accounting for its flaws be a more prudent first move? At least the accounting is finally being debated now as well. When we first started writing about MTM in 2007; not a soul seemed to know what we were talking about. To be completely fair, that fact alone caused us to be prematurely bullish. Nevertheless, it appears we have been in good company. Both the FDIC’s Sheila Bair and the Federal Reserve’s Ben Bernanke have stated publicly that they believe MTM to be inaccurate due to a dysfunctional secondary market and that most of these bonds held by banks and insurers are marked-down well below intrinsic value (discounted cash flow based valuation or “DCF”). The Fed even has stated repeatedly that they are making money on the Bear Stearns assets they purchased last spring using DCF (not MTM). The current “aggregator bank” and loss insurance plans espoused by both Bair and Bernanke favor using DCF analysis to value the “at risk” to MTM assets at banks. What the Bair/Bernanke plan entails is relieving the financial industry of a broken secondary debt market which was in large part caused by MTM and speculation in illiquid credit derivatives. At a minimum, we believe a much harder review and response to the accounting standards that followed Sarbanes-Oxley is necessary before considering such Draconian actions as nationalization. Even the new Obama administration has acknowledged their disinterest in nationalization in favor of the Bair/Bernanke solutions. As a result, we suspect real relief is closer than the market has currently discounted. The reluctance to set aside MTM is due to the concern that it would further undermine confidence. A credibility and confidence concern is understandable, however keeping an illogical accounting standard in place due to a perceived illogical response is in and of itself…illogical. We would recommend suspending MTM and having the FASB turn MTM into a disclosure issue and return us to cash impairment-based accounting. This
- 3. would prevent the self-perpetuating capital account destruction which in essence is what the current paralyzed debt market creates. The current accounting system is forcing most financial firms to assume they are being liquidated every day they are open for business. No wonder our system is paralyzed. The banking system finds itself hoarding record cash, capital and liquidity to defend itself against MTM. As a result, the banks starve the rest of the economy of needed credit. This is why we are in a deep recession, perhaps worse than anyone has seen in seven decades. The legislature and accountants are to thank for this colossal blunder. The illustration above comes from the venerable Bank of New York Mellon (BoNY) which is long noted for being conservative in their projections. BoNY estimates that MTM is inaccurate by $1 billion or roughly 1/3 of the bank’s annual earnings last year. BoNY is NOT experiencing cash flow impairment on these securities and their own discounted cash flow analysis (the long-time standard in business finance) suggests MTM is off by more than 80%. The reason for this is the lack of liquidity. Of late, there is no liquidity in the secondary market for credit. But when has price ever been an accurate assessment of value? This is especially true in a panic. MTM has become a liquidity discount and NOT a credit repayment discount. As we have explained, MTM makes matters far worse than reality. The accounting itself amplifies BOTH boom and bust cycles by overstating asset prices in booms and under stating prices in busts. Bonds are not traded and are not intended to be traded, like shares of common stock. MTM takes into account “observable input” in the market to then assess the spot value of bonds. Consequently, these “marks” aren’t even based upon
- 4. actual trading in the securities, but rather trading in highly levered speculative derivatives (bets) used by investors to gamble on the direction of value. The high leverage involved exacerbates the synthetic or “theoretical” price movements in the underlying bonds and increases the amplitude of the boom or bust. Historically, bank balance sheets are made- up mostly of loans (whole loans) and bonds (pools of partial loans). MTM only affects the latter – bonds (also a flaw). And by our careful observation, banks are carrying so much cash and equivalents (highly liquid securities) now that some have as much cash and equivalents as they do any other type of asset on their balance sheets. For example, banks like Citigroup, Bank of America, JP Morgan, Wells Fargo, US Bancorp, Capital One and PNC et al have multiples of cash relative to their own market capitalization values now. And most have loan to deposit ratios below 100%. This means they are hoarding cash to avert MTM and this is starving our economy of needed liquidity. Conclusion…MTM is smothering America! The Congress asked the Financial Accounting Standards Board (“FASB”), which oversees accounting standards in our country, to review MTM as part of the Targeted Asset Repurchase Program (“TARP”). FASB has given a relatively weak response but did state that the price of “disorderly” trades is NOT “determinative” when measuring fair value. However, public accounting firms are too fearful to adhere even to the clarification made by the FASB. After the events surrounding Arthur Andersen and Enron, no public accounting firm will take any position that doesn’t apply the absolute worst case scenario possible when assessing value. The FASB needs to go much further in its language to give relief to both the public accounting firms and the banks they serve by eliminating MTM and returning us to the pre-Sarbanes-Oxley “mark-to-maturity” method. An inherent problem with MTM is that it presumes that non-owners of bonds are an efficient market, which they are not. Speculators are not the best arbiters of intrinsic value. This has been recognized by Federal Reserve Chairman Ben Bernanke and FDIC Chairwoman Sheila Bair. They are both proponents of our government buying-in or insuring bonds (that have been subject to MTM accounting) at prices that ignore MTM and better reflect “fair value”. Chairman Bernanke has testified before the Congress on this topic by using the term “mark-to-maturity”. In recognition of the flaws in MTM, the Fed recently insured both Citigroup and Bank of America bonds subject to this flawed accounting. The Fed also bought bonds from Bear Stearns in it’s liquidation at values materially above their MTM “marks.” Recent reports on those assets from its servicer (Blackrock) suggest those bonds continue to materially outperform the mark-downs in terms of cash flow performance. Thus, “mark-to-maturity” is proving far more accurate than MTM. If the two primary banking regulators – Fed and FDIC see flaws in MTM, then why don’t the rest of us? A recent study by the Bank for International Settlements (BIS) on the value of mortgage- backed securities under MTM found loss assumptions to be as much as 60% off relative to realistic cash flow losses. The measure of “MTM” for mortgage-backed securities
- 5. now centers on a series of obscure synthetic derivative indices collectively referred to as the ABX indices. As the BIS observed, “the so-called ABX index family has served as a widely followed barometer of the collapsing valuations in the US subprime mortgage market, which has been at the core of observed credit market developments”. The BIS further concluded -“importantly, the combined ABX indices capture only a part of the underlying universe of sub prime mortgages.” Specifically, the BIS found that the ABX indices represented only $31 billion in mortgages out of $1.5 trillion in total subprime mortgages outstanding and roughly $10 trillion in total mortgages outstanding or a mere 2% of subprimes and 0.03% of all mortgages outstanding in the US. This hardly is a statistically significant sample, yet it is this series of obscure indices that has been integral in this credit crisis. Their only legitimacy is that accountants have adopted them to meet the standards of a new accounting standard – MTM as an “observable input.” Astonishingly, it is this statistically insignificant sample size of subprime mortgages upon which the entire US financial system is being indirectly valued. As an example, Citigroup e.g. now has written off more than $50 billion worth of mortgage-related securities based upon MTM. Citi now carries all subprime related mortgage securities at as low as 7c to $1 of original par; Alt-A at 28c; and commercial mortgage related securities at 60c. These carrying values are ludicrous. The 7c figure presumes an absurd outcome where 100% of every mortgage in those portfolios defaults and the loss on the home is 93%. On Alt-A mortgages, the MTM “marks” against Citi’s book value presumes 100% of those mortgages defaults and the loss on the underlying house is 72%. Again, these are absurd outcomes as the BIS study and our own prior research has concluded. There is no question MTM is deeply flawed. The synthetic indices used to meet the new MTM standard also are not cash markets as we have noted in the past. They are derivative markets no different than say – commodity futures. We now all realize that when crude oil reached $147 a barrel last summer (recently as low as $31), that speculators controlled more oil than OPEC. This is due to leverage. Oil speculators can invest in future oil price movements for as little as 5% capital down or lever their bet by 20 fold. This enabled speculators to materially overwhelm natural supply and demand for crude oil and create highly distorted prices. We recognized this distortion and shorted oil and oil related stocks last summer. Currently, there is a similar and obvious distortion in the pricing of derivatives related to speculators gambling on the direction of credit and this is what has led to banks having written down mortgage related securities to preposterous outcomes such as 100% foreclosure rates and 93% home value declines. This is evidence of the flaw in MTM and why we refer to it as… “mark-to- zero”. The accounting itself creates what psychologists would call a “negative feedback loop”. The more the indices fall in value… the more speculators wish to chase the “short.” This results in a spill over into other asset classes like prime mortgages and commercial mortgages out of greed. This is not unlike the effect that crude oil speculation had in pricing up all sorts of other commodities like gold e.g.
- 6. Again, this is not unlike the Internet bubble. If you missed Yahoo!, then you chased some other Internet stock and the process became self fulfilling and attracted more enthusiasm in a “positive feedback loop.” This “negative feedback loop” in financial assets and bank stocks can and will be stopped. The upside in banking and financial related stocks is unimaginable now when this becomes clearer to investors. The Fund, while showcasing increased volatility in recent quarters, is in position to take advantage of this incredible upside potential in the financial services sector of the stock market. TARP has turned out to be a “liquidity trap” as the money is not getting out into the economy. The government blames the banks for hoarding cash or opportunistically investing the cash in other banks, when of course it isn’t the banker’s fault. It’s the government’s fault for not fully recognizing and addressing the problems with MTM. We believe the second half of TARP in conjunction with he Bernanke/Bair Plan will untie this knot. The Capital Controversy As MTM has selectively devastated bank capital levels (on mostly non cash write- downs), investors have turned their attention to capital adequacy at banks. This too has become a mania. Few investors are experienced at understanding regulatory bank capital standards; how these standards are applied and how one should evaluate capital strength. Bank examiners have universally used what is referred to as risk-based capital (RBC) analysis when determining a bank's "capital adequacy". In recent years, this standard was agreed upon by all US and American bank regulators under BASEL II and has been used by all US regulators since the last crisis in the late 1980's. RBC is a RAAP (Regulatory Accounting Principles) procedure which assesses the risk of every asset class held by the bank and assigns a minimum capital allocation to each asset class based-upon empirical risk. RBC analysis requires a bank to carry a certain % of capital against each risk weighting accordingly. This is a very thorough and carefully detailed analysis; as opposed to GAAP which is limited in its approach and detail. What is important to note is that “intangible assets” are included and appropriately discounted in the RBC capital ratios while GAAP accounting (which focuses on Tangible Common Equity) deducts these from its capital ratios. So, what is an "intangible asset" at a bank? It's a deposit franchise! Banking industry “intangible assets” are deposits premiums. These deposits are valuable assets because one can turn them into money by investing them in loans and/or bonds. The stickier or more "core" the deposits, the more valuable they are. GAAP accounting is dated on this topic and it reflects items like intellectual property as an intangible. For example, if you paid a Tier 1 Capital consists of common shareholders’ equity, qualifying preferred stock (including the cumulative preferred stock issued by Group Inc. to the U.S. Department of the Treasury’s (U.S. Treasury) TARP Capital Purchase Program and our junior subordinated debt issued to trusts, less deductions for goodwill, disallowed intangible assets and other items. Source: Federal Reserve
- 7. premium for Walt Disney because Mickey Mouse cartoons generate cash flow forever; then any price you pay over book value is considered "intangible.” This doesn't mean Mickey Mouse isn't valuable beyond book value does it? Of course not… It is for this reason that most industries do not use book value to value themselves (they use cash flow) and no other industry discounts "goodwill" as being worthless either. In fact, banking industry goodwill which is considered “intangible” is more tangible than most industrial firm's tangible assets like plant, equipment etc. There is no such thing as “intangible capital.” Only assets can be labeled “intangible” under GAAP. As we have pointed out, GAAP ignores many assets (and in the case of banks – deposit liabilities) that generate cash flow and labels them as “intangible.” Currently, our markets and the pundits that comment on those markets are transfixed on tangible common equity (TCE). Tangible common equity is common equity minus any intangibles or goodwill. Why would TCE be so popular of late? It’s popular for the same reason Internet stocks once traded on eyeballs and page views. This too is a mania. The market seeks out a justification for a trend. This is the new valuation tool that befits the times and sentiment of the market. TCE is the ultimate lowest level of possible valuation for a bank and thus is very popular among a market that only sees financial stocks in decline. This is the “negative feedback loop” that we alluded to earlier. It’s a herd mentality. This is the same herd that was chasing oil and cement and taking everything that the Chinese government says as being factual. All bubbles. Bubbles come with absurd valuation "techniques" and TCE is the current justification for shorting high quality banks and valuing them materially below their economic value. If the Federal Reserve and the Treasury were believers in the validity of valuing banks relative to TCE… then why did they design TARP capital to meet the strongest RBC class of capital? There is a reason banks are measured under RAAP and not GAAP by regulators. The perception of what it means to take TARP was the concern. As a result, the Fed and the Treasury asked superior banks like Wells Fargo and JP Morgan to accept TARP dollars and remove any potential stigma. The current obsession is with whether or not assets are “toxic”….this too is a mania. I would define toxic NOT by an assets’ liquidity, but by that assets’ viability. The media is defining our economy for us and they are fueling this downturn via a series of misconceptions. Boiling It Down Valuations are amazing…banks are flush with capital! Right now our country’s banks have record Tier 1 RBC. This is a point that Western Reserve has been making in futility for months. The banking industry has more capital and liquidity than at any other time in history… We are seeing some of the most manic distortions of valuation in market history. Currently, Exxon’s market cap now exceeds that of the 50 largest banks. We are wondering why Exxon doesn’t immediately tender a stock swap for all fifty of them before folks figure this out. One oil company equals the fifty largest banks? We are in a valuation mania that is no different than the Internet bubble. These are ridiculous times.
- 8. As I have written in the past; valuation methods shift with psychology and not economics. The current obsession with tangible common equity as the primary way one values a bank, of course, makes as much sense as valuing an Internet company based on its number of page views. The measure itself says nothing whatsoever about the profitability or risk of the company. Evidently, valuation methods are like fashion…they change with the seasons. As a former Wall Street bank analyst, I’m aghast at the lack of consistency from period to period. Right now, TCE is ultra popular as the consensus base for valuation and this has caused the average bank stock to fall 80% in this bear market. Why? Based on earnings in normal economic climates, a 12x P/E translates into >3x market cap to TCE. So, banks all trade now at low to mid single digit P/E’s on economic recovery earnings power. In the eventual recovery, guess what valuation tool these inexperienced analysts will use to value bank stocks? You guessed it…P/E! Opportunity in Financial StocksOpportunity in Financial Stocks Financial Stocks at historic low valuationsFinancial Stocks at historic low valuations and very low Nonand very low Non--Performing Assets levelsPerforming Assets levels 0.00% 0.50% 1.00% 1.50% 2.00% 2.50% 3.00% 0% 100% 200% 300% 400% 500% 600% NPAs/ Assets Price/ Tangible Book Median ‐ Money Center NPAs/ Assets (%) P/TBV The U.S. domestic regional banking index has reached a Great Depression low of 0.5x book value this winter. The chart (See above) graphs the banking sector’s price-to- tangible book ratio (line graph) as well as the non-performing assets (bar graph) in money center banking institutions. This data illustrates that current valuations (price to tangible book ratio) are below the previous level they reached at the trough of the crisis in 1990 (S&L Crisis). However, the fundamental metrics of banking institutions are better today than they were then (as most of the “problem” assets are captured by MTM now as opposed to cash flow or impairment-based accounting). As the chart illustrates, non- performing assets (meaning assets which are not cash flowing) are a fraction of where
- 9. they were during the last banking crisis. Today, actual problem loans are approximately one-third or less of the level reached during the 1990 crisis; while capital ratios are approximately three times higher than in 1990. Deep value investors would be wise to take this very seriously. As the valuations illustrated in the price-to-tangible book ratio chart speak volumes, they are only part of the larger picture. What ultimately makes for such a compelling opportunity in financial stocks is the nature of and speed with which their earnings power returns. We look at the current environment in very much the same way Warren Buffett viewed the market in 1990. The following is a brief excerpt from the Berkshire Hathaway 1990 year end investor letter… “Our purchases of Wells Fargo in 1990 were helped by a chaotic market in bank stocks. The disarray was appropriate: Month by month the foolish loan decisions of mismanaged banks were put on public display. As one huge loss after another was unveiled - often on the heels of managerial assurances that all was well - investors understandably concluded that no bank's numbers were to be trusted. Aided by their flight from bank stocks, we purchased our 10% interest in Wells Fargo for $290 million, less than five times after-tax earnings, and less than three times pre-tax earnings into an eventual recovery.” Source: Berkshire Hathaway- 1990 Investor Letter The valuations that Buffett recognized and took advantage of in 1990 via purchasing Wells Fargo; are very similar to the opportunities that we are seeing today in JP Morgan (JPM) and Capital One (COF). As former bank regulators, we methodically analyze banks under strict regulatory accounting practices (we ignore GAAP as it is flawed on many levels) and evaluate the safety and soundness of banks based on the classic bank examiner’s CAMEL rating methodology. CAMEL being an acronym for Capital Adequacy, Asset Quality, Management Strength, Earnings Power and Liquidity. Each of these factors are critical in determining which banks are in position to not only survive this onslaught, but also in position to gain tremendous market share in a recovery. CAMEL is best illustrated by example: JP Morgan (JPM) Capital Adequacy • Tier 1 RBC 11% is >200% of the regulatory minimum for “well capitalized” • Total RBC 15% is off the regulatory chart strong • Total RBC plus Loss Reserve 18% is off the regulatory chart strong • Tangible Common Equity is >250% above the old 1.5% minimum regulatory standard Asset Quality • Nonperforming Assets are a low 0.6% of total assets • Nonperforming loans are well below industry average at 1% • Loan loss reserve is 3% or well in excess (> 250%) of nonperforming loans
- 10. Management • Jamie Dimon and team are considered among the best in the industry and the Federal Reserve has referred to JPM as the “second Fed”. Federal Reserve’s #1 “go to” bank. The government chose JPM to aid in the liquidation of Bear Stearns and the take-over or clean-up of Washington Mutual, a huge vote of confidence in management. Earnings • JPM’s core cash earnings were quite positive in 4Q excluding excess reserve build • The “look through” earnings power is >$3.50 EPS and we believe WaMu accretion exceeds $1 EPS • So, JPM is trading at roughly 5x recovery EPS Liquidity • Loans-to-Deposits at roughly 70% indicate unheard of liquidity to manage any deposit withdrawals and/or accelerate loan growth as economic conditions improve • Current assets less current liabilities is an amazing $1 trillion or 10x the stock’s market value and 40x the TARP monies they were asked to take • Cash and equivalents less total debt is $556 billion or nearly 6x the stock’s market value and 22x the TARP they were asked to take Conclusion – JPM is an extremely valuable franchise trading at panic level valuations. The balance sheet is extraordinarily liquid, capital levels extremely high and asset quality well contained if not remarkably strong relative the economic environment. The stock is priced at 50% of book value; 5x “look through” earnings power and the bank has no less than 6x net cash to market value. This is the bargain of a lifetime. Capital One Financial (COF) Capital Adequacy • Tier 1 RBC 14% is almost 300% of the regulatory minimum for “well capitalized” • Total RBC 17% is well off the regulatory chart strong • Total RBC plus Loss Reserve 21% is well off the regulatory chart strong • Tangible Common Equity is >500% above the old 1.5% minimum regulatory standard Asset Quality • Nonperforming Assets are a low 0.6% of total assets • Nonperforming loans are well below industry average at 1%
- 11. • Loan loss reserve is 4.5% or well in excess (> 450%) of nonperforming loans Management • Rich Fairbank and team are considered consumer finance stalwarts and were instrumental in forever altering the credit card industry, which now is controlled by an oligopoly of only the strongest underwriters. Their current credit statistics are the lowest in the industry despite these troubled times. The government turned to COF’s management to help them deal with troubled Chevy Chase Bank, a huge vote of confidence from the regulators. Earnings • COF’s core cash earnings were positive in 4Q despite a massive excess reserve build • The “look through” earnings power is >$7+ EPS and we believe Chevy Case will be accretive in the years to come while further shoring-up deposit funding strength • So, COF is trading at roughly 2x recovery EPS Liquidity • Loans-to-Deposits at roughly 90% indicate strong liquidity to manage any deposit withdrawals and/or accelerate loan growth as economic conditions improve • Current assets less current liabilities is $38 billion or 6x the stock’s market value and 10x the TARP monies they were asked to take RE: Chevy Chase • Cash and equivalents less total debt is $15 billion or 3x the stock’s market value and 5x the TARP they took-down Conclusion – COF is an irreplaceable consumer credit franchise trading at panic level valuations. The balance sheet is highly liquid, capital levels incredibly high and asset quality far stronger than its peers. The stock is priced at 25% of book value; 2x “look through” earnings power and the bank has no less than 3x net cash to market value. This too is the bargain of a lifetime. As we wrote last year, the financials rallied nearly 900% off the 1990 trough by 1998. I see a 1,000% run over the next decade from these excessively depressed valuations. Downturns like euphoric bubbles always are one part truth and at least two parts hyperbole. Ultimately, the reversion to the mean (the truth) is two-thirds psychological.
- 12. Financials soar 900% from last banking crisisFinancials soar 900% from last banking crisis Bank Index vs. S&P 500Bank Index vs. S&P 500 0% 100% 200% 300% 400% 500% 600% 700% 800% 900% November 1990 - April 1998 NASDAQ Bank Index S&P 500 This change in psychology often appears at the least expected moment and usually is reflected in stock prices moving well ahead of fundamentals. This is precisely what occurred in financial stocks in 1990. Problem loans hadn’t peaked until 1993 and the Resolution Trust Corporation didn’t close down until mid 1995; yet banking stocks began their rally in October 1990. If investors had waited for the 1993 non-performing loan peak or the closure of the RTC in 1995 to buy bank stocks; the investor would have missed a 200% and 300% return respectively. The “negative feedback loop” paralyzes the vast majority of investors, as a result most buy high and sell low….Not us. We see many correlations between 1990 and the present. The RTC was formed in 1989 much as TARP was enacted in 2008…. And Warren….he has been buying stocks again just as he did in 1990. It looks like he is about 90 days early so far and averaging-in… Regards, Michael P. Durante Managing Partner