04. equity analysis worksheet (deb sahoo)
•
0 recomendaciones•241 vistas


Recomendados
Más contenido relacionado
La actualidad más candente
Similar a 04. equity analysis worksheet (deb sahoo)
Similar a 04. equity analysis worksheet (deb sahoo) (20)
Más de Deb Sahoo, MBA(Finance), MS(EE), BTech(EE),
Más de Deb Sahoo, MBA(Finance), MS(EE), BTech(EE), (20)
Último
Último (20)
04. equity analysis worksheet (deb sahoo)
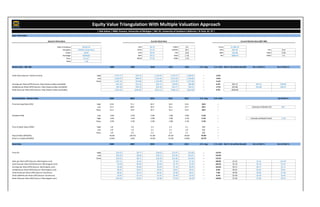
- 1. Basic Information Current Stock Data Current Market Data (S&P 500) Date of Analysis: 04/25/13 SPS: $6.74 P/SPS: 2.0 Price: $1,585.16 Company: NVIDIA Corporation CFPS: $1.33 P/CFPS: 10.1 EPS: $95.49 P/E: 16.6 Ticker: NVDA EPS: $0.91 P/E: 14.8 DPS: $36.46 Yield: 2.3% Exchange: NASDAQ DPS: $0.15 Yield: 1.1% BV: $689.20 P/BV: 2.3 Price: $13.47 BVPS: $7.92 P/BV: 1.70 Beta: 1.49 Market Data - S&P 500 2008 2009 2010 2011 2012 5-Yr. Avg 5-Yr. Grth Nxt Yr. Est w/Past Growth Est 1 of Nxt Yr. Est 2 of Nxt Yr. Index Value (Source: Yahoo Finance) High 1,471.77 934.73 1,133.87 1,276.17 1,284.62 -- -3.3% Low 1,442.07 899.35 1,116.56 1,257.62 1,258.86 -- -3.3% Close 1,447.16 931.80 1,132.99 1,271.87 1,277.06 -- -3.1% Earnings per Share (EPS) (Source: http://www.multpl.com/table) $67.44 $13.14 $54.73 $78.03 $85.88 -- 6.2% $91.21 $91.21 $59.84 Dividends per Share (DPS) (Source: http://www.multpl.com/table) $29.38 $30.19 $22.43 $22.77 $26.31 -- -2.7% $25.60 $25.60 $26.21 Book Value per Share (BV) (Source: http://www.multpl.com/table) $522.44 $465.90 $522.12 $586.12 $622.96 -- 4.5% $650.99 Financial Ratios - Market Index 2008 2009 2010 2011 2012 5-Yr. Avg 5-Yr. Grth Est of Nxt Yr. Price-Earnings Ratio (P/E) High 21.8 71.1 20.7 16.4 15.0 29.0 -- Low 21.4 68.4 20.4 16.1 14.7 28.2 -- Estimate of Market P/E 28.7 Close 21.5 70.9 20.7 16.3 14.9 28.9 -- Dividend Yield Low 2.0% 3.2% 2.0% 1.8% 2.0% 2.2% -- High 2.0% 3.4% 2.0% 1.8% 2.1% 2.3% -- Estimate of Market Yield 2.2% Close 2.0% 3.2% 2.0% 1.8% 2.1% 2.2% -- Price to Book Value (P/BV) High 2.8 2.0 2.2 2.2 2.1 2.2 -- Low 2.8 1.9 2.1 2.1 2.0 2.2 -- Close 2.8 2.0 2.2 2.2 2.1 2.2 -- Payout Ratio (DPS/EPS) 43.6% 229.7% 41.0% 29.2% 30.6% 74.8% -- Return on Equity (EPS/BV) 12.9% 2.8% 10.5% 13.3% 13.8% 10.7% -- Stock Data 2008 2009 2010 2011 2012 5-Yr. Avg 5-Yr. Grth Nxt Yr. Est w/Past Growth Est 1 of Nxt Yr. Est 2 of Nxt Yr. Price (P): High $34.25 $8.77 $18.62 $15.97 $14.40 -- -19.5% Low $32.56 $8.04 $18.11 $15.50 $14.01 -- -19.0% Close $33.01 $8.71 $18.49 $15.82 $14.04 -- -19.2% Sales per Share (SPS) (Source: Morningstar.com) $27.51 $2.42 $7.70 $7.19 $7.39 -- -28.0% $5.32 $5.32 $10.44 Cash Flow per Share (CFPS) (Source: Morningstar.com) $3.59 $0.34 $0.64 $1.74 $1.43 -- -20.5% $1.14 $1.14 $1.55 Earnings per Share (EPS) (Source: Morningstar.com) $2.58 $0.40 $0.44 $1.19 $0.92 -- -22.6% $0.71 $0.71 $1.11 Dividends per Share (DPS) (Source: Morningstar.com) $0.01 $0.01 $0.01 $0.01 $0.01 -- 0.0% $0.01 $0.02 $0.01 Total Assets per Share (APS) (Source: GuruFocus $6.81 $6.11 $6.52 $7.82 $9.21 -- 7.8% $9.93 $9.93 $7.30 Total Liabilities per Share (LPS) (Source: GuruFocus) $2.05 $1.74 $1.67 $2.29 $2.33 -- 3.2% $2.40 $2.40 $2.02 Book Value per Share (BV) (Source: Morningstar.com) $19.42 $2.03 $5.96 $7.53 $8.78 -- -18.0% $7.20 $7.20 $8.74 Equity Value Triangulation With Multiple Valuation Approach | Deb Sahoo | MBA, Finance, University of Michigan | MS, EE, University of Southern California | B-Tech, EE, IIT | General Information
- 2. Financial Ratios - Stock 2008 2009 2010 2011 2012 5-Yr. Avg 5-Yr. Grth Est of Nxt Yr. Price-Sales Ratio High 1.2 3.6 2.4 2.2 1.9 2.3 -- (P/SPS) Low 1.2 3.3 2.4 2.2 1.9 2.2 -- P/SPS Estimate: 2.3 Close 1.2 3.6 2.4 2.2 1.9 2.3 -- Price-Cash Flow Ratio High 9.5 25.7 28.9 9.2 10.1 16.7 -- (P/CFPS) Low 9.1 23.5 28.1 8.9 9.8 15.9 -- P/CFPS Estimate: 16.4 Close 9.2 25.5 28.7 9.1 9.8 16.5 -- Price-Earnings Ratio High 13.3 21.9 42.1 13.4 15.6 21.3 -- (P/E) Low 12.6 20.1 40.9 13.0 15.2 20.4 -- P/E Estimate: 20.9 Close 12.8 21.8 41.8 13.3 15.2 21.0 -- Dividend Yield Low 0.0% 0.1% 0.1% 0.1% 0.1% 0.1% -- High 0.0% 0.1% 0.1% 0.1% 0.1% 0.1% -- Yield Estimate: 0.1% Close 0.0% 0.1% 0.1% 0.1% 0.1% 0.1% -- Price-Book Value Ratio High 1.8 4.3 3.1 2.1 1.6 2.6 -- (P/BV) Low 1.7 4.0 3.0 2.1 1.6 2.5 -- P/BV Estimate: 2.6 Close 1.7 4.3 3.1 2.1 1.6 2.6 -- Asset Turnover (SPS/APS) 4.04 0.40 1.18 0.92 0.80 1.47 -- Net Profit Margin (EPS/SPS) 9.4% 16.5% 5.7% 16.5% 12.5% 12.1% -- Return on Assets (EPS/APS) 37.8% 6.5% 6.8% 15.2% 10.0% 15.3% -- Return on Equity (EPS/BV) 13.3% 19.7% 7.4% 15.8% 10.5% 13.4% -- Total Liabilities to Total Assets (LPS/APS) 30.1% 28.5% 25.7% 29.2% 25.3% 27.8% -- Total Liabilities to Equity (LPS/BV) 10.6% 86.1% 28.1% 30.3% 26.5% 36.3% -- Payout Ratio (DPS/EPS) 0.4% 2.5% 2.3% 0.8% 1.1% 1.4% -- Sustainable Growth (ROE X (1-Payout)) 13.2% 19.3% 7.2% 15.7% 10.4% 13.2% -- Valuation Methods A. Valuation Based on Average P/SPS Average P/SPS Estimated SPS Valuations Value to Price $5.32 w/Past Growth = $12.24 91% Average High P/SPS X Estimated SPS 2.3 X $5.32 Est. 1 = $12.24 91% $10.44 Est 2 = $24.02 178% $5.32 w/Past Growth = $11.70 87% Average Low P/SPS X Estimated SPS 2.2 X $5.32 Est. 1 = $11.70 87% $10.44 Est 2 = $22.97 171% $5.32 w/Past Growth = $12.24 91% Average Close P/SPS X Estimated SPS 2.3 X $5.32 Est. 1 = $12.24 91% $10.44 Est 2 = $24.02 178% $5.32 w/Past Growth = $12.06 90% P/SPS Estimate X Estimated SPS 2.3 X $5.32 Est. 1 = $12.06 90% $10.44 Est 2 = $23.67 176% B. Valuation Based on Average P/CFPS Average P/CFPS Estimated CFPS Valuations Value to Price $1.14 w/Past Growth = $19.02 141% Avg High P/CFPS X Estimated CFPS 16.7 X $1.14 Est. 1 = $19.02 141% $1.55 Est 2 = $25.87 192% $1.14 w/Past Growth = $18.11 134%
- 3. Avg Low P/CFPS X Estimated CFPS 15.9 X $1.14 Est. 1 = $18.11 134% $1.55 Est 2 = $24.63 183% $1.14 w/Past Growth = $18.79 140% Avg Close P/CFPS X Estimated CFPS 16.5 X $1.14 Est. 1 = $18.79 140% $1.55 Est 2 = $25.56 190% $1.14 w/Past Growth = $18.64 138% P/CFPS Estimate X Estimated CFPS 16.4 X $1.14 Est. 1 = $18.64 138% $1.55 Est 2 = $25.35 188% C. Valuation Based on Average P/E Average P/E Estimated EPS Valuations Value to Price $0.71 w/Past Growth = $15.23 113% Average High P/E X Estimated EPS 21.3 X $0.71 Est. 1 = $15.23 113% $1.11 Est 2 = $23.58 175% $0.71 w/Past Growth = $14.58 108% Average Low P/E X Estimated EPS 20.4 X $0.71 Est. 1 = $14.58 108% $1.11 Est 2 = $22.58 168% $0.71 w/Past Growth = $15.01 111% Average Close P/E X Estimated EPS 21.0 X $0.71 Est. 1 = $15.01 111% $1.11 Est 2 = $23.24 173% $0.71 w/Past Growth = $14.94 111% P/E Estimate X Estimated EPS 20.9 X $0.71 Est. 1 = $14.94 111% $1.11 Est 2 = $23.13 172% D. Valuation Based on Average Yield Estimated DPS Average Yield Valuations Value to Price $0.01 w/Past Growth = $10.00 74% Estimated DPS / Average Low Yield $0.02 Est. 1 / 0.1% = $20.00 148% $0.01 Est 2 = $10.00 74% $0.01 w/Past Growth = $10.00 74% Estimated DPS / Average High Yield $0.02 Est. 1 / 0.1% = $20.00 148% $0.01 Est 2 = $10.00 74% $0.01 w/Past Growth = $10.00 74% Estimated DPS / Average Close Yield $0.02 Est. 1 / 0.1% = $20.00 148% $0.01 Est 2 = $10.00 74% $0.01 w/Past Growth = $10.00 74% Estimated DPS / Yield Estimate $0.02 Est. 1 / 0.1% = $20.00 148% $0.01 Est 2 = $10.00 74% E. Valuation Based on Average P/BV Average P/BV Estimated BV Valuations Value to Price $7.20 w/Past Growth = $18.71 139% Average High P/BV X Estimated BV 2.6 X $7.20 Est. 1 = $18.71 139% $8.74 Est 2 = $22.73 169% $7.20 w/Past Growth = $17.99 134% Average Low P/BV X Estimated BV 2.5 X $7.20 Est. 1 = $17.99 134% $8.74 Est 2 = $21.86 162% $7.20 w/Past Growth = $18.71 139% Average Close P/BV X Estimated BV 2.6 X $7.20 Est. 1 = $18.71 139% $8.74 Est 2 = $22.73 169% $7.20 w/Past Growth = $18.47 137%
- 4. P/BV Estimate X Estimated BV 2.6 X $7.20 Est. 1 = $18.47 137% $8.74 Est 2 = $22.44 167% F. Valuation Based on Relative P/E Multiplier 2008 2009 2010 2011 2012 Avg of Relative P/E Relative P/E High 0.61 0.31 2.03 0.82 1.04 0.96 ( = Stock P/E / Market P/E) Low 0.59 0.29 2.00 0.81 1.03 0.95 Estimate of Relative P/E 0.95 Close 0.60 0.31 2.02 0.82 1.02 0.95 Valuations--EPS Forecast w/Growth Value to w/Est. 1 Value to w/Est. 2 Value to Current Market EPS Market P/E Avg of Relative P/E Adjusted P/E $0.71 Price $0.71 Price $1.11 Price 0.96 = 15.9 $11.39 85% $11.39 85% $17.64 131% $95.49 16.6 X 0.95 = 15.8 $11.27 84% $11.27 84% $17.46 130% 0.95 = 15.8 $11.27 84% $11.27 84% $17.46 130% Est 1 of Nxt Yr. Market EPS 0.96 = 16.7 $11.93 89% $11.93 89% $18.47 137% $91.21 17.4 X 0.95 = 16.5 $11.80 88% $11.80 88% $18.28 136% 0.95 = 16.5 $11.80 88% $11.80 88% $18.28 136% Est 2 of Nxt Yr. Market EPS 0.96 = 25.4 $18.18 135% $18.18 135% $28.15 209% $59.84 26.5 X 0.95 = 25.2 $17.99 134% $17.99 134% $27.85 207% 0.95 = 25.2 $17.99 134% $17.99 134% $27.85 207% Valuation Value to Valuation Value to Valuation Value to Estimate of Market P/E Estimate of Relative P/E Adjusted P/E w/Growth Price w/Est. 1 Price w/Est. 2 Price 28.7 X 0.95 = 27.3 $19.55 145% $19.55 145% $30.27 225% G. Valuation Based on Relative Dividend Yield 2008 2009 2010 2011 2012 Avg of Relative Yield Relative Yield Low 0.00 0.03 0.05 0.06 0.05 0.04 ( = Stock Yield / Mkt Yield) High 0.00 0.03 0.05 0.06 0.05 0.04 Estimate of Relative Yield 0.04 Close 0.00 0.03 0.05 0.06 0.05 0.04 Valuations--DPS Forecast w/Growth Value to w/Est. 1 Value to w/Est. 2 Value to Current Market DPS Market Yield Avg of Relative Yield Adjusted Yield $0.01 Price $0.02 Price $0.01 Price 0.04 = 0.1% $10.87 81% $21.74 161% $10.87 81% $36.46 2.3% X 0.04 = 0.1% $10.87 81% $21.74 161% $10.87 81% 0.04 = 0.1% $10.87 81% $21.74 161% $10.87 81% Market DPS 1 0.04 = 0.1% $15.48 115% $30.96 230% $15.48 115% $25.60 1.6% X 0.04 = 0.1% $15.48 115% $30.96 230% $15.48 115% 0.04 = 0.1% $15.48 115% $30.96 230% $15.48 115% Market DPS 2 0.04 = 0.1% $15.12 112% $30.23 224% $15.12 112% $26.21 1.7% X 0.04 = 0.1% $15.12 112% $30.23 224% $15.12 112% 0.04 = 0.1% $15.12 112% $30.23 224% $15.12 112% Valuation Value to Valuation Value to Valuation Value to Estimate of Market Yield Estimate of Relative Yield Adjusted Yield w/Growth Price w/Est. 1 Price w/Est. 2 Price 2.2% X 0.04 = 0.1% $11.23 83% $22.46 167% $11.23 83%
- 5. Valuation Summary Valuation Method Minimum Values Maximum Values Minimum Value/Price Maximum Value/Price Current Stock Price Valuation Based on Average P/SPS $11.70 $24.02 87% 178% $13.47 Valuation Based on Average P/CFPS $18.11 $25.87 134% 192% $13.47 Valuation Based on Average P/E $14.58 $23.58 108% 175% $13.47 Valuation Based on Average Yield $10.00 $23.58 108% 175% $13.47 Valuation Based on Average P/BV $17.99 $22.73 134% 169% $13.47 Valuation Based on Relative P/E Multiplier - Est 1 of Stock EPS $11.27 $19.55 84% 145% $13.47 Valuation Based on Relative P/E Multiplier - Est 2 of Stock EPS $17.46 $30.27 130% 225% $13.47 Valuation Based on Relative Dividend Yield - Est 1 of Stock Yield $21.74 $30.96 161% 230% $13.47 Valuation Based on Relative Dividend Yield - Est 2 of Stock Yield $10.87 $15.48 81% 115% $13.47 Valuation Charts 0% 50% 100% 150% 200% 250% $0.00 $5.00 $10.00 $15.00 $20.00 $25.00 $30.00 $35.00 Valuation Based on Average P/SPS Valuation Based on Average P/CFPS Valuation Based on Average P/E Valuation Based on Average Yield Valuation Based on Average P/BV Valuation Based on Relative P/E Multiplier - Est 1 of Stock EPS Valuation Based on Relative P/E Multiplier - Est 2 of Stock EPS Valuation Based on Relative Dividend Yield - Est 1 of Stock Yield Valuation Based on Relative Dividend Yield - Est 2 of Stock Yield IntrinsicStockValue/StcoPriceRatio(%) IntrinsicStockValue Valuation Methods Equity Valuation Range Minimum Values Maximum Values Current Stock Price Minimum Value/Price Maximum Value/Price