Falcon Invoice Discounting: Unlock Your Business Potential
Venture-Backed Exits - Q1 '06
1. Emily Mendell, NVCA, 610-565-3904, emendell@nvca.org
Joshua Radler, Thomson Venture Economics, 646-822-7323, Joshua.radler@thomson.com
VENTURE-BACKED IPO MARKET LANGUISHED WHILE ACQUISITIONS MARKET
MAINTAINED BULLISH PACE IN FIRST QUARTER OF 2006
Strongest M&A Valuations Since 2001 Not Enough to Ease Economic Concerns
New York, NY- April 3, 2006 – Only ten venture-backed companies raised $540.8 million through Initial
Public Offerings (IPOs) in the first quarter of 2006, according to the Exit Poll report by Thomson Venture
Economics and the National Venture Capital Association. While the first quarter is typically the lowest of
the year for IPOs, offer amounts were also down considerably, as the first quarter’s average offer amount of
$54.1 million is the lowest average since the third quarter of 2002, when the average offer amount was
$30.0 million. Conversely, the venture-backed M&A market continued to perform strongly with 95
companies being acquired with a disclosed value of $4.8 billion, the highest total disclosed value in five
years.
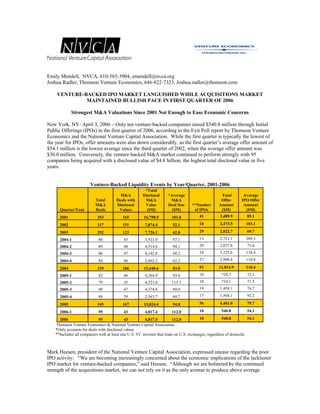
Venture-Backed Liquidity Events by Year/Quarter, 2001-2006
*Total
M&A *Average Total Average
Disclosed
Total Deals with M&A M&A Offer IPO Offer
M&A Disclosed Value Deal Size **Number Amount Amount
Quarter/Year Deals Values ($M) ($M) ($M)
($M) of IPOs
41 3,489.9 85.1
2001 353 165 16,798.9 101.8
24 2,473.5 103.1
2002 317 151 7,874.4 52.1
29 2,022.7 69.7
2003 292 123 7,726.1 62.8
13 2,721.1 209.3
80 45 3,921.0 87.1
2004-1
29 2,077.8 71.6
89 48 4,514.6 94.1
2004-2
24 3,225.6 134.4
86 47 4,142.8 88.2
2004-3
27 2,990.4 110.8
84 46 2,862.2 62.2
2004-4
93 11,014.9 118.4
2004 339 186 15,440.6 83.0
10 720.7 72.1
82 46 4,364.9 93.6
2005-1
10 714.1 71.5
79 35 4,521.0 115.3
2005-2
19 1,458.1 76.7
98 47 4,374.8 89.0
2005-3
17 1,568.1 92.2
86 39 2,563.7 69.7
2005-4
56 4,461.0 79.7
2005 345 167 15,824.4 94.8
10 540.8 54.1
2006-1 95 43 4,817.4 112.0
10 540.8 54.1
2006 95 43 4,817.4 112.0
Thomson Venture Economics & National Venture Capital Association
*Only accounts for deals with disclosed values
**Includes all companies with at least one U.S. VC investor that trade on U.S. exchanges, regardless of domicile.
Mark Heesen, president of the National Venture Capital Association, expressed unease regarding the poor
IPO activity: “We are becoming increasingly concerned about the economic implications of the lackluster
IPO market for venture-backed companies,” said Heesen. “Although we are bolstered by the continued
strength of the acquisitions market, we can not rely on it as the only avenue to produce above average
2. returns for the venture industry. Our economy depends on a strong US capital markets system to create
jobs and revenues here. And while the companies that have gone public during the past year have seen
their stock prices rise, their successes have not yet translated into a marked improvement in IPO activity.
This situation needs to show signs of improvement before year end or we will begin to feel the effects on a
much broader scale.”
IPO Activity Highlights
The Life Sciences sector drove the IPO activity in the first quarter of 2006, accounting for seven of the ten
IPOs. The largest IPO of the first quarter came from the Life Sciences sector, Altus Pharmaceuticals, Inc.’s
$105.0 million offering. Altus Pharmaceuticals was backed by Warburg Pincus, U.S. Venture Partners,
CMEA Ventures, China Development Industrial Bank, and Nomura International. The Life Sciences sector
in total raised $309.8 million.
The Technology sector had three companies raise a total of $231.1 million. The largest IPO in the
Technology sector, and the second largest overall, was Traffic.com, Inc., which raised $78.6 million.
Traffic.com was backed by TL Ventures, PA Early Stage Partners, Convergence Capital, and Internet
Capital Group. The Technology sector also contained the third largest IPO of the quarter, Liquidity
Services, Inc.’s $76.9 million offering. Liquidity Services was backed by ABS Capital Partners.
Industry Breakdown
Q1 2006
*Number Total
of Venture-
Venture- Backed
Backed Offering
IPO's in Size
Industry the U.S. ($M)
Biotechnology 4 197.0
Medical/Health 3 112.8
Life Sciences TOTAL 7 309.8
Internet Specific 2 155.5
Semiconductors 1 75.6
Technology TOTAL 3 231.1
Thomson Venture Economics & National Venture Capital Association
*Includes all companies with at least one U.S. VC investor that trade on U.S.
exchanges, regardless of domicile
For the rolling 12 month period ending March 31, 2006, 73% of the companies that went public are
currently trading above their offering price. In addition to the IPOs completed this quarter, there are
currently twenty-four venture-backed companies “in registration” with the Securities and Exchange
Commission. These companies have filed with the SEC in 2005 or 2006 and are now preparing for their
initial public offerings. This compares with sixteen companies in registration at the end of 2005.
Merger and Acquisition Highlights
In contrast to the IPO market, merger and acquisition activity remained especially vibrant, building
strongly on momentum from the previous two years. The first quarter M&A total disclosed value represents
a 46.8% increase over the fourth quarter of 2005, and a 10.4% increase over last year’s strong first quarter.
This quarter has been the most robust since the first quarter of 2001.
The average disclosed deal size came in at $112 million, a significant improvement over last quarter and
the first quarter of 2005 which posted averages of $69.7 million and $93.6 million respectively. The
3. improvement is even more starkly illustrated in the median figures with this quarter reporting a median size
disclosed value of $60 million. Last quarter that figure was only $31 million and in the first quarter of 2005
it was $33.6 million.
Daniel Benkert, senior analyst at Thomson Financial said, “This quarter’s M&A performance will adjust
expectations slightly upwards. Somewhere around the midpoint of last year the acquisitions market moved
unequivocally out of the recovery phase and has now found its legs. With billions already in the pipeline of
pending deals, this level of activity looks to be a protracted phenomenon over the coming quarters,
especially with a downward trending IPO environment.”
This quarter’s venture-backed M&A activity remained primarily technology-focused, with tech companies
accounting for seventy-five deals and a disclosed value of $3.3 billion. This contrasts sharply with the IPO
activity, which trended towards the medical/biotechnology sectors.
The largest disclosed deal of the quarter was the $600 million acquisition of wireless network products
developer Flarion Technologies by QUALCOMM in January. This is the largest deal since the September
2004 acquisition of Seisint by LexisNexis for $775 million, also a technology-specific deal.
Venture-Backed M&A Industry Breakdown
Q1 2006
Number of Total
Venture- Disclosed
Number of Backed Venture-
M&A Backed
Venture-
Backed deals with Deal
M&A a disclosed Value
Industry value ($M)
deals
Internet Specific 21 8 981.3
Semiconductors 7 4 391.4
Communications/Media 11 6 517.6
Computer Software 33 13 854.9
Computer Hardware 3 1 600.0
Technology TOTAL 75 32 3,345.2
Medical/Health 6 3 588.2
Biotechnology 3 3 241.5
Life
Sciences TOTAL 9 6 829.7
Non-high Technology 11 5 642.5
Other TOTAL 95 43 4,817.4
Source: Thomson Venture Economics & National Venture Capital Association
In terms of the return on total investment, this quarter also showed a marked improvement. The deals
bringing in the top returns, those with values greater than 4x the venture investment, accounted for 33% of
the total this quarter. Last quarter these deals made up 23% of the total. At the lower end of the scale, those
deals returning less than the amount invested accounted for 16.6% of the quarter’s total, while last quarter
they comprised 36% of the group.
4. Analysis of Transaction Values versus Amount Invested
Relationship between transaction value
Q4 2005 Q1 2006
and investment
Deals where transaction value is less than
14 7
total venture investment
Deals where transaction value is 1-4x total
16 21
venture investment
Deals where transaction value is 4x-10x
4 8
total venture investment
Deals where transaction value is greater
5 6
than 10x venture investment
Total Disclosed Deals 39 42**
Source: Thomson Venture Economics & National Venture Capital Association
** In Q1 2006, 43 deals had disclosed values, but one of these targets did not have
a disclosed total investment amount.
Thomson Venture Economics, a Thomson Financial company, is the foremost information provider for
equity professionals worldwide. Venture Economics offers an unparalleled range of products from
directories to conferences, journals, newsletters, research reports, and the VentureXpert™ database. For
over 40 years, Venture Economics has been tracking the venture capital and buyouts industry. Since 1961,
it has been a recognized source for comprehensive analysis of investment activity and performance of the
private equity industry. Venture Economics maintains a long-standing relationship within the private equity
investment community, in-depth industry knowledge, and proprietary research techniques. Private equity
managers and institutional investors alike consider Venture Economics information to be the industry
standard. For more information about Venture Economics, please visit www.ventureeconomics.com.
About Thomson Financial
Thomson Financial, with 2005 revenues of US$1.9 billion, is a provider of information and technology
solutions to the worldwide financial community. Through the widest range of products and services in the
industry, Thomson Financial helps clients in more than 70 countries make better decisions, be more
productive and achieve superior results. Thomson Financial is part of The Thomson Corporation
(www.thomson.com), a global leader in providing integrated information solutions to more than 20 million
business and professional customers in the fields of law, tax, accounting, financial services, higher
education, reference information, corporate e-learning and assessment, scientific research and healthcare.
With revenues of US$8.70 billion, The Thomson Corporation lists its common shares on the New York and
Toronto stock exchanges (NYSE: TOC; TSX: TOC).
The National Venture Capital Association (NVCA) represents approximately 480 venture capital and
private equity firms. NVCA's mission is to foster greater understanding of the importance of venture capital
to the U.S. economy, and support entrepreneurial activity and innovation. According to a 2004 Global
Insight study, venture-backed companies accounted for 10.1 million jobs and $1.8 trillion in revenue in the
United States in 2003. The NVCA represents the public policy interests of the venture capital community,
strives to maintain high professional standards, provides reliable industry data, sponsors professional
development, and facilitates interaction among its members. For more information about the NVCA, please
visit www.nvca.org.