SlideShare una empresa de Scribd logo
1 de 3
Descargar para leer sin conexión
Emily Mendell, NVCA, 610-359-9609, emendell@nvca.org
Joshua Radler, Thomson Venture Economics, 212-806-3146, joshua.radler@thomson.com

 VENTURE BACKED M&A VOLUME HOLDS STEADY; VALUATIONS RISE
                     AGAIN IN Q2 2005
New York, NY, August 8, 2005 –Venture-backed merger and acquisition volume in the second quarter
held steady as disclosed valuations continued to rise, according to Thomson Venture Economics and the
National Venture Capital Association (NVCA). Over the course of the quarter 75 companies were
acquired, with 32 reporting a combined value of $4.4 billion and an average disclosed value of $136.7
million.

These figures represent a 3.9% increase in the combined disclosed value over last quarter’s $4.2 billion
spread across 45 disclosed value deals. However, the quarterly average deal value rose 46% from the first
quarter to the highest level in four years. The $136.7 million average was the highest since Q1 2001, which
had an average deal value of $207 million. The Q2 2005 median disclosed deal size of $68.8 million was
the highest since the last quarter of 2000, which had a median value of $77 million.

    Venture-Backed Liquidity Events by Year/Quarter, 2000-2005
                                                                                          Average
                                 Deals        Total                              Total        IPO
                                  with    Disclosed                              Offer      Offer
                                                      *Average
                             Disclosed       Value                             Amount
                     Total                            Deal Size   Number                  Amount
     Quarter/Year    Deals     Values         ($M)        ($M)    of IPOs        ($M)        ($M)
     2000             315         202      68,353.1      338.4        264      25,499.4      96.6
     2001             353         165      16,798.9      101.8          41      3,489.9      85.1
     2002             316         151       7,874.4        52.2         24      2,473.5     103.1
     2003-1            69          21       1,453.3        69.2          1         77.2      77.2
     2003-2            73          27       1,841.9        68.2          2       164.0       82.0
     2003-3            77          41       2,127.7        51.9          9       732.8       81.4
     2003-4            71          34       2,303.2        67.7         17      1,048.7      61.7
     2003             290         123       7,726.1        62.8         29      2,022.7      69.7
     2004-1            80          45       3,921.0        87.1         13      2,721.1     209.3
     2004-2            89          48       4,514.6        94.1         29      2,077.8      71.6
     2004-3            85          44       3,916.1        89.0         24      3,225.6     134.4
     2004-4            84          46       2,862.2        62.2         27      2,990.4     110.8
     2004             338         183      15,213.9        83.1         93     11,014.9     118.4
     2005-1            79          45       4,209.9        93.6         10       720.7       72.1
     2005-2            75          32       4,373.9      136.7          10       714.1       71.5
     2005
                      154          77       8,583.9      111.5          20      1,434.8      71.7
     (1st Half)

    Source: Thomson Venture Economics & National Venture Capital Association
    * Only accounts for deals with disclosed values

“Given the lackluster IPO market, we are encouraged by the continued relative strength of M&A activity,
which has been the brighter light in the 2005 exit picture for venture-backed companies,” said Mark
Heesen, president of the NVCA. “There are companies that were funded in 1999 and 2000 which are just
now entering maturity and we will be watching to see how they fare. Transaction volume is in line with
historical norms and we expect to see another year of 300 or more deals. It is critical however, that
valuations continue to strengthen, as the ultimate measure of success is the number of emerging companies
acquired at a significant multiple of their total venture investment.”

The half year totals reinforce evidence of a stable M&A market, registering slight gains over the first half
of 2004. Seventy-seven deals out of 154 in the first half of 2005 reported a total value of $8.6 billion, a
1.75% increase over the first half of last year when 93 deals out of 169 reported a total of $8.4 billion.
While the average deal size increased in 2005 from 2004’s $90.7 million to $111.5 million, the median
value declined from $48.8 million to $42.5 million in 2005.

The second quarter saw a substantial decline in deal values in the Software industry. While still preeminent
in the number of deals closed, 10 of the 23 deals reported just $509.9 million in combined value. That $51
million average deal size was the third lowest across all sectors, followed only by Healthcare Services ($35
million average) and Business Products and Services ($9.7 million average).

The largest deal of the quarter was in the Industrial/Energy sector. Antero Resources, a natural gas and oil
producer was acquired by XTO Energy for $842.9 million. This was also the largest deal since the $2.8
billion acquisition of data communications company Cyras Systems in the first quarter of 2001.

Biologics developer Angiosyn completed its acquisition by Pfizer for $527 million, making it the second
largest deal of the quarter and accounted for most of the $767 million brought in by Biotechnology targets.
Rounding out the top three for the quarter was the Internet-era company Shopzilla, a shopping-focused
search engine. It was bought by EW Scripps for $525 million.

Daniel Benkert, senior analyst at Thomson Venture Economics sees mixed signals in the quarterly results:

“Aggregate valuations this quarter were up across the board, with particularly impressive gains in average
and median deal sizes,” said Benkert. “However, the top 10 deals of the quarter accounted for almost 80%
of the disclosed total. That figure is more reminiscent of the post-bubble lean period when the top 10
ranged between 70 and 90% of quarterly totals as opposed to the 60% range of 2004. This suggests that
while the best deals are getting larger, the remaining deal values are much more static. One year into the
recovery the industry is still shedding underperforming investments.”

                 Analysis of Transaction Values versus Amount Invested


                   Relationship between transaction value and            2004            2005
                   investment                                       (1st Half)      (1st Half)


                   Deals where transaction value is less than
                   total venture investment                                 30              24

                   Deals where transaction value is 1-4x total
                   venture investment                                       29              27

                   Deals where transaction value is 4x-10x
                   total venture investment                                 19              16


                   Deals where transaction value is greater
                   than 10x venture investment                              14               9


                   Total Disclosed Deals                                  92*            76**

                 Source: Thomson Venture Economics & National Venture Capital Association

                 * In 2004 (1st Half), 93 deals had disclosed values, but one of these targets did not have a
                 disclosed total investment amount.

                 ** In 2005 (1st Half), 77 deals had disclosed values, but one of these targets did not have a
                 disclosed total investment amount.
A ratio analysis of company acquisition price to the total venture investment shows similar success patterns
in the first half of 2004 and 2005. Approximately one third of the transactions yielded less proceeds than
the venture investment; one third returned 1 – 4X investment; and one third return more than 4X
investment.

About Thomson Venture Economics
Thomson Venture Economics, a Thomson Financial company, is the foremost information
provider for equity professionals worldwide. Venture Economics offers an unparalleled range of
products from directories to conferences, journals, newsletters, research reports, and the Venture
Expert™ database. For over 35 years, Venture Economics has been tracking the venture capital
and buyouts industry. Since 1961, it has been a recognized source for comprehensive analysis of
investment activity and performance of the private equity industry. Venture Economics maintains
a long-standing relationship within the private equity investment community, in-depth industry
knowledge, and proprietary research techniques. Private equity managers and institutional
investors alike consider Venture Economics information to be the industry standard. For more
information about Venture Economics, please visit www.ventureeconomics.com.

About Thomson Financial
Thomson Financial is a US$1.73 billion provider of information and technology solutions to the
worldwide financial community. Through the widest range of products and services in the
industry, Thomson Financial helps clients in more than 70 countries make better decisions, be
more productive and achieve superior results. Thomson Financial is part of The Thomson
Corporation (www.thomson.com), a global leader in providing integrated information solutions to
more than 20 million business and professional customers in the fields of law, tax, accounting,
financial services, higher education, reference information, corporate e-learning and assessment,
scientific research and healthcare. With revenues of US$8.10 billion, The Thomson Corporation
lists its common shares on the New York and Toronto stock exchanges (NYSE: TOC; TSX:
TOC).


About NVCA
The National Venture Capital Association (NVCA) represents approximately 475 venture capital
and private equity firms. NVCA's mission is to foster greater understanding of the importance of
venture capital to the U.S. economy, and support entrepreneurial activity and
innovation. According to a 2004 Global Insight study, venture-backed companies accounted for
10.1 million jobs and $1.8 trillion in revenue in the U.S. in 2003. The NVCA represents the
public policy interests of the venture capital community, strives to maintain high professional
standards, provides reliable industry data, sponsors professional development, and facilitates
interaction among its members. For more information about the NVCA, please visit
www.nvca.org

Más contenido relacionado

La actualidad más candente

Recticel Annual Results 2011 - ENGLISH
Recticel Annual Results 2011 - ENGLISHRecticel Annual Results 2011 - ENGLISH
Recticel Annual Results 2011 - ENGLISHRecticel NV/SA
 
First powerpoint to
First powerpoint to First powerpoint to
First powerpoint to collincooke
 
Cooper_Valuation
Cooper_ValuationCooper_Valuation
Cooper_ValuationTy Sheehan
 
Mergers and Acquisition, Arcelor_mittal
Mergers and Acquisition, Arcelor_mittalMergers and Acquisition, Arcelor_mittal
Mergers and Acquisition, Arcelor_mittalVikram Dahiya
 
A project report on comparative study on performance of differnet industreis ...
A project report on comparative study on performance of differnet industreis ...A project report on comparative study on performance of differnet industreis ...
A project report on comparative study on performance of differnet industreis ...Dinesh Dhawan
 
BBBY_AR2007_proxy_v3
BBBY_AR2007_proxy_v3BBBY_AR2007_proxy_v3
BBBY_AR2007_proxy_v3finance44
 
WEG 3Q10 Results Conference Call Presentation
WEG 3Q10 Results Conference Call PresentationWEG 3Q10 Results Conference Call Presentation
WEG 3Q10 Results Conference Call PresentationWEG
 

La actualidad más candente (15)

Q1 2009 Earning Report of Interactive Brokers
Q1 2009 Earning Report of Interactive BrokersQ1 2009 Earning Report of Interactive Brokers
Q1 2009 Earning Report of Interactive Brokers
 
Recticel Annual Results 2011 - ENGLISH
Recticel Annual Results 2011 - ENGLISHRecticel Annual Results 2011 - ENGLISH
Recticel Annual Results 2011 - ENGLISH
 
First powerpoint to
First powerpoint to First powerpoint to
First powerpoint to
 
credit suisse
credit suisse credit suisse
credit suisse
 
Cooper_Valuation
Cooper_ValuationCooper_Valuation
Cooper_Valuation
 
AZN/ALXN
AZN/ALXNAZN/ALXN
AZN/ALXN
 
Piaggio Group - Full Year 2010 Financial Results
Piaggio Group - Full Year 2010 Financial ResultsPiaggio Group - Full Year 2010 Financial Results
Piaggio Group - Full Year 2010 Financial Results
 
Mergers and Acquisition, Arcelor_mittal
Mergers and Acquisition, Arcelor_mittalMergers and Acquisition, Arcelor_mittal
Mergers and Acquisition, Arcelor_mittal
 
A project report on comparative study on performance of differnet industreis ...
A project report on comparative study on performance of differnet industreis ...A project report on comparative study on performance of differnet industreis ...
A project report on comparative study on performance of differnet industreis ...
 
credit suiss Quarterly Report Q3/2006
credit suiss Quarterly Report Q3/2006credit suiss Quarterly Report Q3/2006
credit suiss Quarterly Report Q3/2006
 
BBBY_AR2007_proxy_v3
BBBY_AR2007_proxy_v3BBBY_AR2007_proxy_v3
BBBY_AR2007_proxy_v3
 
credit suisse Quarterly Report Q3/2005
credit suisse Quarterly Report Q3/2005credit suisse Quarterly Report Q3/2005
credit suisse Quarterly Report Q3/2005
 
credit-suisse Quarterly Report Q2/2006
 credit-suisse Quarterly Report Q2/2006 credit-suisse Quarterly Report Q2/2006
credit-suisse Quarterly Report Q2/2006
 
Piaggio Group - First Nine Months 2011 Financial Results
Piaggio Group - First Nine Months 2011 Financial ResultsPiaggio Group - First Nine Months 2011 Financial Results
Piaggio Group - First Nine Months 2011 Financial Results
 
WEG 3Q10 Results Conference Call Presentation
WEG 3Q10 Results Conference Call PresentationWEG 3Q10 Results Conference Call Presentation
WEG 3Q10 Results Conference Call Presentation
 

Destacado

Co Operatives And Ced Final
Co Operatives And Ced FinalCo Operatives And Ced Final
Co Operatives And Ced Finalguest0f4c867e
 
VC Performance Q2 '08
VC Performance Q2 '08  VC Performance Q2 '08
VC Performance Q2 '08 mensa25
 
青蛙的故事
青蛙的故事青蛙的故事
青蛙的故事lamyer
 
日本人が好きな国
日本人が好きな国日本人が好きな国
日本人が好きな国guest75b1ed
 
Q4 ’04 Venture Capital Fund Performance
Q4 ’04 Venture Capital Fund PerformanceQ4 ’04 Venture Capital Fund Performance
Q4 ’04 Venture Capital Fund Performancemensa25
 

Destacado (6)

Co Operatives And Ced Final
Co Operatives And Ced FinalCo Operatives And Ced Final
Co Operatives And Ced Final
 
4.3.4example2
4.3.4example24.3.4example2
4.3.4example2
 
VC Performance Q2 '08
VC Performance Q2 '08  VC Performance Q2 '08
VC Performance Q2 '08
 
青蛙的故事
青蛙的故事青蛙的故事
青蛙的故事
 
日本人が好きな国
日本人が好きな国日本人が好きな国
日本人が好きな国
 
Q4 ’04 Venture Capital Fund Performance
Q4 ’04 Venture Capital Fund PerformanceQ4 ’04 Venture Capital Fund Performance
Q4 ’04 Venture Capital Fund Performance
 

Similar a Venture-Backed M&A's Q2 '05

Q3 '05 venture backed IPOs & M&As
Q3 '05 venture backed IPOs & M&As Q3 '05 venture backed IPOs & M&As
Q3 '05 venture backed IPOs & M&As mensa25
 
Q3 '05 venture backed IPOs & M&As
Q3 '05 venture backed IPOs & M&As Q3 '05 venture backed IPOs & M&As
Q3 '05 venture backed IPOs & M&As mensa25
 
Venture-backed IPO & Acquisitions Q4 05
Venture-backed IPO & Acquisitions Q4 05 Venture-backed IPO & Acquisitions Q4 05
Venture-backed IPO & Acquisitions Q4 05 mensa25
 
Exit Poll Release – Q4 ‘06
  	Exit Poll Release – Q4 ‘06    	Exit Poll Release – Q4 ‘06
Exit Poll Release – Q4 ‘06 mensa25
 
Q2 04 Venture-Backed M&A’s
Q2 04 Venture-Backed M&A’sQ2 04 Venture-Backed M&A’s
Q2 04 Venture-Backed M&A’smensa25
 
Q2 ’04 IPO Activity
 	Q2 ’04 IPO Activity 	Q2 ’04 IPO Activity
Q2 ’04 IPO Activitymensa25
 
Venture Exits Q1 '07
 	Venture Exits Q1 '07   	Venture Exits Q1 '07
Venture Exits Q1 '07 mensa25
 
Venture Backed Exits - Q4 '07/full year 2007
 	Venture Backed Exits - Q4 '07/full year 2007   	Venture Backed Exits - Q4 '07/full year 2007
Venture Backed Exits - Q4 '07/full year 2007 mensa25
 
Q4 Venture Backed IPOs
Q4 Venture Backed IPOsQ4 Venture Backed IPOs
Q4 Venture Backed IPOsmensa25
 
Venture Backed Exits Q2 2008 - NVCA Declares Capital Crisis for Start Up C...
  	Venture Backed Exits Q2 2008 - NVCA Declares Capital Crisis for Start Up C...  	Venture Backed Exits Q2 2008 - NVCA Declares Capital Crisis for Start Up C...
Venture Backed Exits Q2 2008 - NVCA Declares Capital Crisis for Start Up C...mensa25
 
Venture-Backed Exits Q3 07
Venture-Backed Exits Q3 07  Venture-Backed Exits Q3 07
Venture-Backed Exits Q3 07 mensa25
 
Venture Capital Exits Q3 06
  	Venture Capital Exits Q3 06    	Venture Capital Exits Q3 06
Venture Capital Exits Q3 06 mensa25
 
VC Fundraising Q2 2005
  	VC Fundraising Q2 2005   	VC Fundraising Q2 2005
VC Fundraising Q2 2005 mensa25
 
Venture-Backed M&A Activity Witnesses Slight Uptick in Q2
Venture-Backed M&A Activity Witnesses Slight Uptick in Q2Venture-Backed M&A Activity Witnesses Slight Uptick in Q2
Venture-Backed M&A Activity Witnesses Slight Uptick in Q2mensa25
 
Venture Backed Exits - Q1 2008
  	Venture Backed Exits - Q1 2008    	Venture Backed Exits - Q1 2008
Venture Backed Exits - Q1 2008 mensa25
 
Venture Backed Exits Q2 '07
 	Venture Backed Exits Q2 '07   	Venture Backed Exits Q2 '07
Venture Backed Exits Q2 '07 mensa25
 
Venture Capital Fundraising Q1 05
Venture Capital Fundraising Q1 05 Venture Capital Fundraising Q1 05
Venture Capital Fundraising Q1 05 mensa25
 
Number of Venture-Backed Companies Acquired in the First Quarter of 2003 De...
 	Number of Venture-Backed Companies Acquired in the First Quarter of 2003 De... 	Number of Venture-Backed Companies Acquired in the First Quarter of 2003 De...
Number of Venture-Backed Companies Acquired in the First Quarter of 2003 De...mensa25
 
Venture Capital Fundraising Q4 04
Venture Capital Fundraising Q4 04Venture Capital Fundraising Q4 04
Venture Capital Fundraising Q4 04mensa25
 

Similar a Venture-Backed M&A's Q2 '05 (20)

Q3 '05 venture backed IPOs & M&As
Q3 '05 venture backed IPOs & M&As Q3 '05 venture backed IPOs & M&As
Q3 '05 venture backed IPOs & M&As
 
Q3 '05 venture backed IPOs & M&As
Q3 '05 venture backed IPOs & M&As Q3 '05 venture backed IPOs & M&As
Q3 '05 venture backed IPOs & M&As
 
Venture-backed IPO & Acquisitions Q4 05
Venture-backed IPO & Acquisitions Q4 05 Venture-backed IPO & Acquisitions Q4 05
Venture-backed IPO & Acquisitions Q4 05
 
 
Exit Poll Release – Q4 ‘06
  	Exit Poll Release – Q4 ‘06    	Exit Poll Release – Q4 ‘06
Exit Poll Release – Q4 ‘06
 
Q2 04 Venture-Backed M&A’s
Q2 04 Venture-Backed M&A’sQ2 04 Venture-Backed M&A’s
Q2 04 Venture-Backed M&A’s
 
Q2 ’04 IPO Activity
 	Q2 ’04 IPO Activity 	Q2 ’04 IPO Activity
Q2 ’04 IPO Activity
 
Venture Exits Q1 '07
 	Venture Exits Q1 '07   	Venture Exits Q1 '07
Venture Exits Q1 '07
 
Venture Backed Exits - Q4 '07/full year 2007
 	Venture Backed Exits - Q4 '07/full year 2007   	Venture Backed Exits - Q4 '07/full year 2007
Venture Backed Exits - Q4 '07/full year 2007
 
Q4 Venture Backed IPOs
Q4 Venture Backed IPOsQ4 Venture Backed IPOs
Q4 Venture Backed IPOs
 
Venture Backed Exits Q2 2008 - NVCA Declares Capital Crisis for Start Up C...
  	Venture Backed Exits Q2 2008 - NVCA Declares Capital Crisis for Start Up C...  	Venture Backed Exits Q2 2008 - NVCA Declares Capital Crisis for Start Up C...
Venture Backed Exits Q2 2008 - NVCA Declares Capital Crisis for Start Up C...
 
Venture-Backed Exits Q3 07
Venture-Backed Exits Q3 07  Venture-Backed Exits Q3 07
Venture-Backed Exits Q3 07
 
Venture Capital Exits Q3 06
  	Venture Capital Exits Q3 06    	Venture Capital Exits Q3 06
Venture Capital Exits Q3 06
 
VC Fundraising Q2 2005
  	VC Fundraising Q2 2005   	VC Fundraising Q2 2005
VC Fundraising Q2 2005
 
Venture-Backed M&A Activity Witnesses Slight Uptick in Q2
Venture-Backed M&A Activity Witnesses Slight Uptick in Q2Venture-Backed M&A Activity Witnesses Slight Uptick in Q2
Venture-Backed M&A Activity Witnesses Slight Uptick in Q2
 
Venture Backed Exits - Q1 2008
  	Venture Backed Exits - Q1 2008    	Venture Backed Exits - Q1 2008
Venture Backed Exits - Q1 2008
 
Venture Backed Exits Q2 '07
 	Venture Backed Exits Q2 '07   	Venture Backed Exits Q2 '07
Venture Backed Exits Q2 '07
 
Venture Capital Fundraising Q1 05
Venture Capital Fundraising Q1 05 Venture Capital Fundraising Q1 05
Venture Capital Fundraising Q1 05
 
Number of Venture-Backed Companies Acquired in the First Quarter of 2003 De...
 	Number of Venture-Backed Companies Acquired in the First Quarter of 2003 De... 	Number of Venture-Backed Companies Acquired in the First Quarter of 2003 De...
Number of Venture-Backed Companies Acquired in the First Quarter of 2003 De...
 
Venture Capital Fundraising Q4 04
Venture Capital Fundraising Q4 04Venture Capital Fundraising Q4 04
Venture Capital Fundraising Q4 04
 

Más de mensa25

Palin Mask
Palin MaskPalin Mask
Palin Maskmensa25
 
Sarah Palin Troopergate Report
Sarah Palin Troopergate ReportSarah Palin Troopergate Report
Sarah Palin Troopergate Reportmensa25
 
Palin Report / Branchflower Report OFFICIAL FINAL Full Text with Gov.'s Press...
Palin Report / Branchflower Report OFFICIAL FINAL Full Text with Gov.'s Press...Palin Report / Branchflower Report OFFICIAL FINAL Full Text with Gov.'s Press...
Palin Report / Branchflower Report OFFICIAL FINAL Full Text with Gov.'s Press...mensa25
 
Top 10 Sarah Palin Look Alikes
Top 10 Sarah Palin Look AlikesTop 10 Sarah Palin Look Alikes
Top 10 Sarah Palin Look Alikesmensa25
 
Sarah Palin Speaking At The Rnc+08
Sarah Palin Speaking At The Rnc+08Sarah Palin Speaking At The Rnc+08
Sarah Palin Speaking At The Rnc+08mensa25
 
Sarah Palin Snl Rap
Sarah Palin Snl RapSarah Palin Snl Rap
Sarah Palin Snl Rapmensa25
 
Sarah Palin September 3 2008
Sarah Palin September 3 2008Sarah Palin September 3 2008
Sarah Palin September 3 2008mensa25
 
Sarah Palin Secret Emails What Does Sarah Palin Have To Hide
Sarah Palin Secret Emails  What Does Sarah Palin Have To HideSarah Palin Secret Emails  What Does Sarah Palin Have To Hide
Sarah Palin Secret Emails What Does Sarah Palin Have To Hidemensa25
 
Sarah Palin Painting
Sarah Palin PaintingSarah Palin Painting
Sarah Palin Paintingmensa25
 
Sarah Palin In Vogue
Sarah Palin In VogueSarah Palin In Vogue
Sarah Palin In Voguemensa25
 
Sarah Palin Gop Convention Photo 2008
Sarah Palin Gop Convention Photo 2008Sarah Palin Gop Convention Photo 2008
Sarah Palin Gop Convention Photo 2008mensa25
 
Sarah Palin Being Sworn In As Governor
Sarah Palin Being Sworn In As GovernorSarah Palin Being Sworn In As Governor
Sarah Palin Being Sworn In As Governormensa25
 
Sarah Palin At Age 17
Sarah Palin At Age 17Sarah Palin At Age 17
Sarah Palin At Age 17mensa25
 
Sarah Palin As A Little Girl
Sarah Palin As A Little GirlSarah Palin As A Little Girl
Sarah Palin As A Little Girlmensa25
 
Palin Family Meets Mc Cain
Palin Family Meets Mc CainPalin Family Meets Mc Cain
Palin Family Meets Mc Cainmensa25
 
Palin Bikini Photo Was Photoshopped
Palin Bikini Photo Was PhotoshoppedPalin Bikini Photo Was Photoshopped
Palin Bikini Photo Was Photoshoppedmensa25
 
Official Photo Of Palin Family 2007
Official Photo Of Palin Family 2007Official Photo Of Palin Family 2007
Official Photo Of Palin Family 2007mensa25
 
Mc Cain Palin On Stage At Rnc September 3 2008
Mc Cain Palin On Stage At Rnc September 3 2008Mc Cain Palin On Stage At Rnc September 3 2008
Mc Cain Palin On Stage At Rnc September 3 2008mensa25
 
List Of Sarah Palin Secret Emails
List Of Sarah Palin Secret EmailsList Of Sarah Palin Secret Emails
List Of Sarah Palin Secret Emailsmensa25
 
Palin Quotes
Palin QuotesPalin Quotes
Palin Quotesmensa25
 

Más de mensa25 (20)

Palin Mask
Palin MaskPalin Mask
Palin Mask
 
Sarah Palin Troopergate Report
Sarah Palin Troopergate ReportSarah Palin Troopergate Report
Sarah Palin Troopergate Report
 
Palin Report / Branchflower Report OFFICIAL FINAL Full Text with Gov.'s Press...
Palin Report / Branchflower Report OFFICIAL FINAL Full Text with Gov.'s Press...Palin Report / Branchflower Report OFFICIAL FINAL Full Text with Gov.'s Press...
Palin Report / Branchflower Report OFFICIAL FINAL Full Text with Gov.'s Press...
 
Top 10 Sarah Palin Look Alikes
Top 10 Sarah Palin Look AlikesTop 10 Sarah Palin Look Alikes
Top 10 Sarah Palin Look Alikes
 
Sarah Palin Speaking At The Rnc+08
Sarah Palin Speaking At The Rnc+08Sarah Palin Speaking At The Rnc+08
Sarah Palin Speaking At The Rnc+08
 
Sarah Palin Snl Rap
Sarah Palin Snl RapSarah Palin Snl Rap
Sarah Palin Snl Rap
 
Sarah Palin September 3 2008
Sarah Palin September 3 2008Sarah Palin September 3 2008
Sarah Palin September 3 2008
 
Sarah Palin Secret Emails What Does Sarah Palin Have To Hide
Sarah Palin Secret Emails  What Does Sarah Palin Have To HideSarah Palin Secret Emails  What Does Sarah Palin Have To Hide
Sarah Palin Secret Emails What Does Sarah Palin Have To Hide
 
Sarah Palin Painting
Sarah Palin PaintingSarah Palin Painting
Sarah Palin Painting
 
Sarah Palin In Vogue
Sarah Palin In VogueSarah Palin In Vogue
Sarah Palin In Vogue
 
Sarah Palin Gop Convention Photo 2008
Sarah Palin Gop Convention Photo 2008Sarah Palin Gop Convention Photo 2008
Sarah Palin Gop Convention Photo 2008
 
Sarah Palin Being Sworn In As Governor
Sarah Palin Being Sworn In As GovernorSarah Palin Being Sworn In As Governor
Sarah Palin Being Sworn In As Governor
 
Sarah Palin At Age 17
Sarah Palin At Age 17Sarah Palin At Age 17
Sarah Palin At Age 17
 
Sarah Palin As A Little Girl
Sarah Palin As A Little GirlSarah Palin As A Little Girl
Sarah Palin As A Little Girl
 
Palin Family Meets Mc Cain
Palin Family Meets Mc CainPalin Family Meets Mc Cain
Palin Family Meets Mc Cain
 
Palin Bikini Photo Was Photoshopped
Palin Bikini Photo Was PhotoshoppedPalin Bikini Photo Was Photoshopped
Palin Bikini Photo Was Photoshopped
 
Official Photo Of Palin Family 2007
Official Photo Of Palin Family 2007Official Photo Of Palin Family 2007
Official Photo Of Palin Family 2007
 
Mc Cain Palin On Stage At Rnc September 3 2008
Mc Cain Palin On Stage At Rnc September 3 2008Mc Cain Palin On Stage At Rnc September 3 2008
Mc Cain Palin On Stage At Rnc September 3 2008
 
List Of Sarah Palin Secret Emails
List Of Sarah Palin Secret EmailsList Of Sarah Palin Secret Emails
List Of Sarah Palin Secret Emails
 
Palin Quotes
Palin QuotesPalin Quotes
Palin Quotes
 

Último

MAHA Global and IPR: Do Actions Speak Louder Than Words?
MAHA Global and IPR: Do Actions Speak Louder Than Words?MAHA Global and IPR: Do Actions Speak Louder Than Words?
MAHA Global and IPR: Do Actions Speak Louder Than Words?Olivia Kresic
 
Organizational Structure Running A Successful Business
Organizational Structure Running A Successful BusinessOrganizational Structure Running A Successful Business
Organizational Structure Running A Successful BusinessSeta Wicaksana
 
8447779800, Low rate Call girls in Rohini Delhi NCR
8447779800, Low rate Call girls in Rohini Delhi NCR8447779800, Low rate Call girls in Rohini Delhi NCR
8447779800, Low rate Call girls in Rohini Delhi NCRashishs7044
 
Buy gmail accounts.pdf Buy Old Gmail Accounts
Buy gmail accounts.pdf Buy Old Gmail AccountsBuy gmail accounts.pdf Buy Old Gmail Accounts
Buy gmail accounts.pdf Buy Old Gmail AccountsBuy Verified Accounts
 
Market Sizes Sample Report - 2024 Edition
Market Sizes Sample Report - 2024 EditionMarket Sizes Sample Report - 2024 Edition
Market Sizes Sample Report - 2024 EditionMintel Group
 
Ms Motilal Padampat Sugar Mills vs. State of Uttar Pradesh & Ors. - A Milesto...
Ms Motilal Padampat Sugar Mills vs. State of Uttar Pradesh & Ors. - A Milesto...Ms Motilal Padampat Sugar Mills vs. State of Uttar Pradesh & Ors. - A Milesto...
Ms Motilal Padampat Sugar Mills vs. State of Uttar Pradesh & Ors. - A Milesto...ShrutiBose4
 
Call Us 📲8800102216📞 Call Girls In DLF City Gurgaon
Call Us 📲8800102216📞 Call Girls In DLF City GurgaonCall Us 📲8800102216📞 Call Girls In DLF City Gurgaon
Call Us 📲8800102216📞 Call Girls In DLF City Gurgaoncallgirls2057
 
APRIL2024_UKRAINE_xml_0000000000000 .pdf
APRIL2024_UKRAINE_xml_0000000000000 .pdfAPRIL2024_UKRAINE_xml_0000000000000 .pdf
APRIL2024_UKRAINE_xml_0000000000000 .pdfRbc Rbcua
 
Digital Transformation in the PLM domain - distrib.pdf
Digital Transformation in the PLM domain - distrib.pdfDigital Transformation in the PLM domain - distrib.pdf
Digital Transformation in the PLM domain - distrib.pdfJos Voskuil
 
Call Girls in DELHI Cantt, ( Call Me )-8377877756-Female Escort- In Delhi / Ncr
Call Girls in DELHI Cantt, ( Call Me )-8377877756-Female Escort- In Delhi / NcrCall Girls in DELHI Cantt, ( Call Me )-8377877756-Female Escort- In Delhi / Ncr
Call Girls in DELHI Cantt, ( Call Me )-8377877756-Female Escort- In Delhi / Ncrdollysharma2066
 
8447779800, Low rate Call girls in Tughlakabad Delhi NCR
8447779800, Low rate Call girls in Tughlakabad Delhi NCR8447779800, Low rate Call girls in Tughlakabad Delhi NCR
8447779800, Low rate Call girls in Tughlakabad Delhi NCRashishs7044
 
8447779800, Low rate Call girls in Saket Delhi NCR
8447779800, Low rate Call girls in Saket Delhi NCR8447779800, Low rate Call girls in Saket Delhi NCR
8447779800, Low rate Call girls in Saket Delhi NCRashishs7044
 
FULL ENJOY Call girls in Paharganj Delhi | 8377087607
FULL ENJOY Call girls in Paharganj Delhi | 8377087607FULL ENJOY Call girls in Paharganj Delhi | 8377087607
FULL ENJOY Call girls in Paharganj Delhi | 8377087607dollysharma2066
 
IoT Insurance Observatory: summary 2024
IoT Insurance Observatory:  summary 2024IoT Insurance Observatory:  summary 2024
IoT Insurance Observatory: summary 2024Matteo Carbone
 
Islamabad Escorts | Call 03070433345 | Escort Service in Islamabad
Islamabad Escorts | Call 03070433345 | Escort Service in IslamabadIslamabad Escorts | Call 03070433345 | Escort Service in Islamabad
Islamabad Escorts | Call 03070433345 | Escort Service in IslamabadAyesha Khan
 
PSCC - Capability Statement Presentation
PSCC - Capability Statement PresentationPSCC - Capability Statement Presentation
PSCC - Capability Statement PresentationAnamaria Contreras
 
Independent Call Girls Andheri Nightlaila 9967584737
Independent Call Girls Andheri Nightlaila 9967584737Independent Call Girls Andheri Nightlaila 9967584737
Independent Call Girls Andheri Nightlaila 9967584737Riya Pathan
 
Future Of Sample Report 2024 | Redacted Version
Future Of Sample Report 2024 | Redacted VersionFuture Of Sample Report 2024 | Redacted Version
Future Of Sample Report 2024 | Redacted VersionMintel Group
 
International Business Environments and Operations 16th Global Edition test b...
International Business Environments and Operations 16th Global Edition test b...International Business Environments and Operations 16th Global Edition test b...
International Business Environments and Operations 16th Global Edition test b...ssuserf63bd7
 
8447779800, Low rate Call girls in Uttam Nagar Delhi NCR
8447779800, Low rate Call girls in Uttam Nagar Delhi NCR8447779800, Low rate Call girls in Uttam Nagar Delhi NCR
8447779800, Low rate Call girls in Uttam Nagar Delhi NCRashishs7044
 

Último (20)

MAHA Global and IPR: Do Actions Speak Louder Than Words?
MAHA Global and IPR: Do Actions Speak Louder Than Words?MAHA Global and IPR: Do Actions Speak Louder Than Words?
MAHA Global and IPR: Do Actions Speak Louder Than Words?
 
Organizational Structure Running A Successful Business
Organizational Structure Running A Successful BusinessOrganizational Structure Running A Successful Business
Organizational Structure Running A Successful Business
 
8447779800, Low rate Call girls in Rohini Delhi NCR
8447779800, Low rate Call girls in Rohini Delhi NCR8447779800, Low rate Call girls in Rohini Delhi NCR
8447779800, Low rate Call girls in Rohini Delhi NCR
 
Buy gmail accounts.pdf Buy Old Gmail Accounts
Buy gmail accounts.pdf Buy Old Gmail AccountsBuy gmail accounts.pdf Buy Old Gmail Accounts
Buy gmail accounts.pdf Buy Old Gmail Accounts
 
Market Sizes Sample Report - 2024 Edition
Market Sizes Sample Report - 2024 EditionMarket Sizes Sample Report - 2024 Edition
Market Sizes Sample Report - 2024 Edition
 
Ms Motilal Padampat Sugar Mills vs. State of Uttar Pradesh & Ors. - A Milesto...
Ms Motilal Padampat Sugar Mills vs. State of Uttar Pradesh & Ors. - A Milesto...Ms Motilal Padampat Sugar Mills vs. State of Uttar Pradesh & Ors. - A Milesto...
Ms Motilal Padampat Sugar Mills vs. State of Uttar Pradesh & Ors. - A Milesto...
 
Call Us 📲8800102216📞 Call Girls In DLF City Gurgaon
Call Us 📲8800102216📞 Call Girls In DLF City GurgaonCall Us 📲8800102216📞 Call Girls In DLF City Gurgaon
Call Us 📲8800102216📞 Call Girls In DLF City Gurgaon
 
APRIL2024_UKRAINE_xml_0000000000000 .pdf
APRIL2024_UKRAINE_xml_0000000000000 .pdfAPRIL2024_UKRAINE_xml_0000000000000 .pdf
APRIL2024_UKRAINE_xml_0000000000000 .pdf
 
Digital Transformation in the PLM domain - distrib.pdf
Digital Transformation in the PLM domain - distrib.pdfDigital Transformation in the PLM domain - distrib.pdf
Digital Transformation in the PLM domain - distrib.pdf
 
Call Girls in DELHI Cantt, ( Call Me )-8377877756-Female Escort- In Delhi / Ncr
Call Girls in DELHI Cantt, ( Call Me )-8377877756-Female Escort- In Delhi / NcrCall Girls in DELHI Cantt, ( Call Me )-8377877756-Female Escort- In Delhi / Ncr
Call Girls in DELHI Cantt, ( Call Me )-8377877756-Female Escort- In Delhi / Ncr
 
8447779800, Low rate Call girls in Tughlakabad Delhi NCR
8447779800, Low rate Call girls in Tughlakabad Delhi NCR8447779800, Low rate Call girls in Tughlakabad Delhi NCR
8447779800, Low rate Call girls in Tughlakabad Delhi NCR
 
8447779800, Low rate Call girls in Saket Delhi NCR
8447779800, Low rate Call girls in Saket Delhi NCR8447779800, Low rate Call girls in Saket Delhi NCR
8447779800, Low rate Call girls in Saket Delhi NCR
 
FULL ENJOY Call girls in Paharganj Delhi | 8377087607
FULL ENJOY Call girls in Paharganj Delhi | 8377087607FULL ENJOY Call girls in Paharganj Delhi | 8377087607
FULL ENJOY Call girls in Paharganj Delhi | 8377087607
 
IoT Insurance Observatory: summary 2024
IoT Insurance Observatory:  summary 2024IoT Insurance Observatory:  summary 2024
IoT Insurance Observatory: summary 2024
 
Islamabad Escorts | Call 03070433345 | Escort Service in Islamabad
Islamabad Escorts | Call 03070433345 | Escort Service in IslamabadIslamabad Escorts | Call 03070433345 | Escort Service in Islamabad
Islamabad Escorts | Call 03070433345 | Escort Service in Islamabad
 
PSCC - Capability Statement Presentation
PSCC - Capability Statement PresentationPSCC - Capability Statement Presentation
PSCC - Capability Statement Presentation
 
Independent Call Girls Andheri Nightlaila 9967584737
Independent Call Girls Andheri Nightlaila 9967584737Independent Call Girls Andheri Nightlaila 9967584737
Independent Call Girls Andheri Nightlaila 9967584737
 
Future Of Sample Report 2024 | Redacted Version
Future Of Sample Report 2024 | Redacted VersionFuture Of Sample Report 2024 | Redacted Version
Future Of Sample Report 2024 | Redacted Version
 
International Business Environments and Operations 16th Global Edition test b...
International Business Environments and Operations 16th Global Edition test b...International Business Environments and Operations 16th Global Edition test b...
International Business Environments and Operations 16th Global Edition test b...
 
8447779800, Low rate Call girls in Uttam Nagar Delhi NCR
8447779800, Low rate Call girls in Uttam Nagar Delhi NCR8447779800, Low rate Call girls in Uttam Nagar Delhi NCR
8447779800, Low rate Call girls in Uttam Nagar Delhi NCR
 

Venture-Backed M&A's Q2 '05

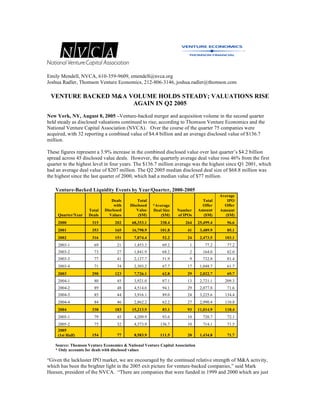
  • 1. Emily Mendell, NVCA, 610-359-9609, emendell@nvca.org Joshua Radler, Thomson Venture Economics, 212-806-3146, joshua.radler@thomson.com VENTURE BACKED M&A VOLUME HOLDS STEADY; VALUATIONS RISE AGAIN IN Q2 2005 New York, NY, August 8, 2005 –Venture-backed merger and acquisition volume in the second quarter held steady as disclosed valuations continued to rise, according to Thomson Venture Economics and the National Venture Capital Association (NVCA). Over the course of the quarter 75 companies were acquired, with 32 reporting a combined value of $4.4 billion and an average disclosed value of $136.7 million. These figures represent a 3.9% increase in the combined disclosed value over last quarter’s $4.2 billion spread across 45 disclosed value deals. However, the quarterly average deal value rose 46% from the first quarter to the highest level in four years. The $136.7 million average was the highest since Q1 2001, which had an average deal value of $207 million. The Q2 2005 median disclosed deal size of $68.8 million was the highest since the last quarter of 2000, which had a median value of $77 million. Venture-Backed Liquidity Events by Year/Quarter, 2000-2005 Average Deals Total Total IPO with Disclosed Offer Offer *Average Disclosed Value Amount Total Deal Size Number Amount Quarter/Year Deals Values ($M) ($M) of IPOs ($M) ($M) 2000 315 202 68,353.1 338.4 264 25,499.4 96.6 2001 353 165 16,798.9 101.8 41 3,489.9 85.1 2002 316 151 7,874.4 52.2 24 2,473.5 103.1 2003-1 69 21 1,453.3 69.2 1 77.2 77.2 2003-2 73 27 1,841.9 68.2 2 164.0 82.0 2003-3 77 41 2,127.7 51.9 9 732.8 81.4 2003-4 71 34 2,303.2 67.7 17 1,048.7 61.7 2003 290 123 7,726.1 62.8 29 2,022.7 69.7 2004-1 80 45 3,921.0 87.1 13 2,721.1 209.3 2004-2 89 48 4,514.6 94.1 29 2,077.8 71.6 2004-3 85 44 3,916.1 89.0 24 3,225.6 134.4 2004-4 84 46 2,862.2 62.2 27 2,990.4 110.8 2004 338 183 15,213.9 83.1 93 11,014.9 118.4 2005-1 79 45 4,209.9 93.6 10 720.7 72.1 2005-2 75 32 4,373.9 136.7 10 714.1 71.5 2005 154 77 8,583.9 111.5 20 1,434.8 71.7 (1st Half) Source: Thomson Venture Economics & National Venture Capital Association * Only accounts for deals with disclosed values “Given the lackluster IPO market, we are encouraged by the continued relative strength of M&A activity, which has been the brighter light in the 2005 exit picture for venture-backed companies,” said Mark Heesen, president of the NVCA. “There are companies that were funded in 1999 and 2000 which are just
  • 2. now entering maturity and we will be watching to see how they fare. Transaction volume is in line with historical norms and we expect to see another year of 300 or more deals. It is critical however, that valuations continue to strengthen, as the ultimate measure of success is the number of emerging companies acquired at a significant multiple of their total venture investment.” The half year totals reinforce evidence of a stable M&A market, registering slight gains over the first half of 2004. Seventy-seven deals out of 154 in the first half of 2005 reported a total value of $8.6 billion, a 1.75% increase over the first half of last year when 93 deals out of 169 reported a total of $8.4 billion. While the average deal size increased in 2005 from 2004’s $90.7 million to $111.5 million, the median value declined from $48.8 million to $42.5 million in 2005. The second quarter saw a substantial decline in deal values in the Software industry. While still preeminent in the number of deals closed, 10 of the 23 deals reported just $509.9 million in combined value. That $51 million average deal size was the third lowest across all sectors, followed only by Healthcare Services ($35 million average) and Business Products and Services ($9.7 million average). The largest deal of the quarter was in the Industrial/Energy sector. Antero Resources, a natural gas and oil producer was acquired by XTO Energy for $842.9 million. This was also the largest deal since the $2.8 billion acquisition of data communications company Cyras Systems in the first quarter of 2001. Biologics developer Angiosyn completed its acquisition by Pfizer for $527 million, making it the second largest deal of the quarter and accounted for most of the $767 million brought in by Biotechnology targets. Rounding out the top three for the quarter was the Internet-era company Shopzilla, a shopping-focused search engine. It was bought by EW Scripps for $525 million. Daniel Benkert, senior analyst at Thomson Venture Economics sees mixed signals in the quarterly results: “Aggregate valuations this quarter were up across the board, with particularly impressive gains in average and median deal sizes,” said Benkert. “However, the top 10 deals of the quarter accounted for almost 80% of the disclosed total. That figure is more reminiscent of the post-bubble lean period when the top 10 ranged between 70 and 90% of quarterly totals as opposed to the 60% range of 2004. This suggests that while the best deals are getting larger, the remaining deal values are much more static. One year into the recovery the industry is still shedding underperforming investments.” Analysis of Transaction Values versus Amount Invested Relationship between transaction value and 2004 2005 investment (1st Half) (1st Half) Deals where transaction value is less than total venture investment 30 24 Deals where transaction value is 1-4x total venture investment 29 27 Deals where transaction value is 4x-10x total venture investment 19 16 Deals where transaction value is greater than 10x venture investment 14 9 Total Disclosed Deals 92* 76** Source: Thomson Venture Economics & National Venture Capital Association * In 2004 (1st Half), 93 deals had disclosed values, but one of these targets did not have a disclosed total investment amount. ** In 2005 (1st Half), 77 deals had disclosed values, but one of these targets did not have a disclosed total investment amount.
  • 3. A ratio analysis of company acquisition price to the total venture investment shows similar success patterns in the first half of 2004 and 2005. Approximately one third of the transactions yielded less proceeds than the venture investment; one third returned 1 – 4X investment; and one third return more than 4X investment. About Thomson Venture Economics Thomson Venture Economics, a Thomson Financial company, is the foremost information provider for equity professionals worldwide. Venture Economics offers an unparalleled range of products from directories to conferences, journals, newsletters, research reports, and the Venture Expert™ database. For over 35 years, Venture Economics has been tracking the venture capital and buyouts industry. Since 1961, it has been a recognized source for comprehensive analysis of investment activity and performance of the private equity industry. Venture Economics maintains a long-standing relationship within the private equity investment community, in-depth industry knowledge, and proprietary research techniques. Private equity managers and institutional investors alike consider Venture Economics information to be the industry standard. For more information about Venture Economics, please visit www.ventureeconomics.com. About Thomson Financial Thomson Financial is a US$1.73 billion provider of information and technology solutions to the worldwide financial community. Through the widest range of products and services in the industry, Thomson Financial helps clients in more than 70 countries make better decisions, be more productive and achieve superior results. Thomson Financial is part of The Thomson Corporation (www.thomson.com), a global leader in providing integrated information solutions to more than 20 million business and professional customers in the fields of law, tax, accounting, financial services, higher education, reference information, corporate e-learning and assessment, scientific research and healthcare. With revenues of US$8.10 billion, The Thomson Corporation lists its common shares on the New York and Toronto stock exchanges (NYSE: TOC; TSX: TOC). About NVCA The National Venture Capital Association (NVCA) represents approximately 475 venture capital and private equity firms. NVCA's mission is to foster greater understanding of the importance of venture capital to the U.S. economy, and support entrepreneurial activity and innovation. According to a 2004 Global Insight study, venture-backed companies accounted for 10.1 million jobs and $1.8 trillion in revenue in the U.S. in 2003. The NVCA represents the public policy interests of the venture capital community, strives to maintain high professional standards, provides reliable industry data, sponsors professional development, and facilitates interaction among its members. For more information about the NVCA, please visit www.nvca.org