SlideShare una empresa de Scribd logo
1 de 3
Resultados


     1. ¿CON QUÉ FRECUENCIA VISITA ESTA ESTACIÓN? (Calle 25 No 15D-26)


A DIARIO                                           32       64%
DIA DE POR MEDIO                                   14       28%
CADA 5 DIAS                                         3        6%
SEMANALMENTE                                        1        2%
CADA 15 DÍAS                                        0        0%
CADA MES                                            0        0%
                                                   50      100%
Tabla 1. Muestra la frecuencia de visita

Según la tabla No 1, la mayor parte de las personas visitan la estación diariamente, y en menor
proporcióndía por medio. Presumimos que esto se debe a que la encuesta se aplicó en su mayoría
a taxistas que tanquean su vehículo 3 veces al día.


   2. AL MOMENTO DE VISITAR LA ESTACIÓN (Calle 25 No 15D-26), QUÉ ES LO PRIMERO QUE
       TOMA EN CUENTA?
PRECIO                            39
ATENCIÓN                           6
CALIDAD                            2
UBICACIÓN DE LA ESTACIÓN           3
                                  50
Tabla 2. Muestra las preferencias de la gente.

Según tabla No2, la mayor parte de los encuestados visitan la estación por el precio

     3. CADA CUANTO TANQUEA SU VEHÍCULO? (marque con una x la opción que más se ajuste)

A DIARIO                                           43       86%
DIA DE POR MEDIO                                    7       14%
CADA 5 DIAS                                         0        0%
SEMANALMENTE                                        0        0%
CADA 15 DÍAS                                        0        0%
CADA MES                                            0        0%
                                                   50      100%
Tabla 3. Muestra la frecuencia del tanqueo del vehículo.

Según tabla No 3, la mayor parte de clientes tanquean su vehículo a diario. Probablemente esto se
debe a que la mayor parte de los encuestados pertenecen a gremio de taxistas, que tanquean por
lo regular 3 veces al día su vehículos, además que manifestaron frecuentar esta zona.
4. ¿CUÁNTOS METROS CÚBICOS COMPRA CADA VEZ? (marque con una x la opción que más
        se acerque)

DE 1-3                                            0            0%
DE 4-6                                           26           52%
DE 7-10                                          22           44%
MAS DE 10                                         2            4%
                                                 50          100%
Tabla 4. Muestra la cantidad de metros cúbicos comprados cada vez.

Según tabla No 4 la mayoría de clientes tanquean "full" promedio de 6 a 7 metros cúbicos


     5. ¿CUÁNTO DINERO GASTA EN G.N.C.V. SEMANALMENTE? (marque con una x la opción que
        mas se acerque)

De 1 a 10.000                                     0            0%
De 11.000 a 20.000                                0            0%
De 21.000 a 30.000                                0            0%
De 31.000 a 40.000                                1            2%
De 41.000 a 50.000                                1            2%
De 51.000 a 60.000                                1            2%
De 61.000 a 80.000                                2            4%
De 81.000 a 100.000                              18           36%
Mas de 100.000                                   27           54%
                                                 50          100%
Tabla 5. Muestra cantidad de dinero gastado semanalmente.

Según tabla No 5, el promedio que compra un cliente de G.N.C.V. esta en $ 80.000


     6. ¿ESTARÍA DISPUESTO A VISITAR LA NUEVA ESTACIÓN? (Cra 12 Calle 15 ) (marque con una
        x su respuesta)

SI                                               44           88%
NO                                                6           12%
                                                 50          100%
Tabla 6. Muestra disposición de visita

Según tabla No 6 la mayor cantidad de las personas encuestadas estarían dispuestas a visitar la
nueva estación.
7. ¿CADA CUÁNTO TIEMPO VISITARÍA LA NUEVA ESTACIÓN? (Cra 12 Calle 15 ) (marque x en
        la opción que mas se acerque)

A DIARIO                                    18     36%
DIA DE POR MEDIO                             6     12%
CADA 5 DIAS                                  3      6%
SEMANALMENTE                                10     20%
CADA 15 DÍAS                                 4      8%
CADA MES                                     3      6%
NO RESPONDEN                                 6     12%
                                            50    100%
Tabla 7. Muestra la frecuencia de visita.

Según tabla No 7, la mayor parte de encuestados visitarían la nueva estación a diario, aunque
encontramos un 12% que no respondieron a la pregunta, que fueron los que contestaron
negativamente a la pregunta 6, y que no estaban contempladas dentro de las posibles opciones de
respuesta, dentro de la encuesta.

Más contenido relacionado

Destacado

2024 State of Marketing Report – by Hubspot
2024 State of Marketing Report – by Hubspot2024 State of Marketing Report – by Hubspot
2024 State of Marketing Report – by HubspotMarius Sescu
 
Everything You Need To Know About ChatGPT
Everything You Need To Know About ChatGPTEverything You Need To Know About ChatGPT
Everything You Need To Know About ChatGPTExpeed Software
 
Product Design Trends in 2024 | Teenage Engineerings
Product Design Trends in 2024 | Teenage EngineeringsProduct Design Trends in 2024 | Teenage Engineerings
Product Design Trends in 2024 | Teenage EngineeringsPixeldarts
 
How Race, Age and Gender Shape Attitudes Towards Mental Health
How Race, Age and Gender Shape Attitudes Towards Mental HealthHow Race, Age and Gender Shape Attitudes Towards Mental Health
How Race, Age and Gender Shape Attitudes Towards Mental HealthThinkNow
 
AI Trends in Creative Operations 2024 by Artwork Flow.pdf
AI Trends in Creative Operations 2024 by Artwork Flow.pdfAI Trends in Creative Operations 2024 by Artwork Flow.pdf
AI Trends in Creative Operations 2024 by Artwork Flow.pdfmarketingartwork
 
PEPSICO Presentation to CAGNY Conference Feb 2024
PEPSICO Presentation to CAGNY Conference Feb 2024PEPSICO Presentation to CAGNY Conference Feb 2024
PEPSICO Presentation to CAGNY Conference Feb 2024Neil Kimberley
 
Content Methodology: A Best Practices Report (Webinar)
Content Methodology: A Best Practices Report (Webinar)Content Methodology: A Best Practices Report (Webinar)
Content Methodology: A Best Practices Report (Webinar)contently
 
How to Prepare For a Successful Job Search for 2024
How to Prepare For a Successful Job Search for 2024How to Prepare For a Successful Job Search for 2024
How to Prepare For a Successful Job Search for 2024Albert Qian
 
Social Media Marketing Trends 2024 // The Global Indie Insights
Social Media Marketing Trends 2024 // The Global Indie InsightsSocial Media Marketing Trends 2024 // The Global Indie Insights
Social Media Marketing Trends 2024 // The Global Indie InsightsKurio // The Social Media Age(ncy)
 
Trends In Paid Search: Navigating The Digital Landscape In 2024
Trends In Paid Search: Navigating The Digital Landscape In 2024Trends In Paid Search: Navigating The Digital Landscape In 2024
Trends In Paid Search: Navigating The Digital Landscape In 2024Search Engine Journal
 
5 Public speaking tips from TED - Visualized summary
5 Public speaking tips from TED - Visualized summary5 Public speaking tips from TED - Visualized summary
5 Public speaking tips from TED - Visualized summarySpeakerHub
 
ChatGPT and the Future of Work - Clark Boyd
ChatGPT and the Future of Work - Clark Boyd ChatGPT and the Future of Work - Clark Boyd
ChatGPT and the Future of Work - Clark Boyd Clark Boyd
 
Getting into the tech field. what next
Getting into the tech field. what next Getting into the tech field. what next
Getting into the tech field. what next Tessa Mero
 
Google's Just Not That Into You: Understanding Core Updates & Search Intent
Google's Just Not That Into You: Understanding Core Updates & Search IntentGoogle's Just Not That Into You: Understanding Core Updates & Search Intent
Google's Just Not That Into You: Understanding Core Updates & Search IntentLily Ray
 
Time Management & Productivity - Best Practices
Time Management & Productivity -  Best PracticesTime Management & Productivity -  Best Practices
Time Management & Productivity - Best PracticesVit Horky
 
The six step guide to practical project management
The six step guide to practical project managementThe six step guide to practical project management
The six step guide to practical project managementMindGenius
 
Beginners Guide to TikTok for Search - Rachel Pearson - We are Tilt __ Bright...
Beginners Guide to TikTok for Search - Rachel Pearson - We are Tilt __ Bright...Beginners Guide to TikTok for Search - Rachel Pearson - We are Tilt __ Bright...
Beginners Guide to TikTok for Search - Rachel Pearson - We are Tilt __ Bright...RachelPearson36
 

Destacado (20)

2024 State of Marketing Report – by Hubspot
2024 State of Marketing Report – by Hubspot2024 State of Marketing Report – by Hubspot
2024 State of Marketing Report – by Hubspot
 
Everything You Need To Know About ChatGPT
Everything You Need To Know About ChatGPTEverything You Need To Know About ChatGPT
Everything You Need To Know About ChatGPT
 
Product Design Trends in 2024 | Teenage Engineerings
Product Design Trends in 2024 | Teenage EngineeringsProduct Design Trends in 2024 | Teenage Engineerings
Product Design Trends in 2024 | Teenage Engineerings
 
How Race, Age and Gender Shape Attitudes Towards Mental Health
How Race, Age and Gender Shape Attitudes Towards Mental HealthHow Race, Age and Gender Shape Attitudes Towards Mental Health
How Race, Age and Gender Shape Attitudes Towards Mental Health
 
AI Trends in Creative Operations 2024 by Artwork Flow.pdf
AI Trends in Creative Operations 2024 by Artwork Flow.pdfAI Trends in Creative Operations 2024 by Artwork Flow.pdf
AI Trends in Creative Operations 2024 by Artwork Flow.pdf
 
Skeleton Culture Code
Skeleton Culture CodeSkeleton Culture Code
Skeleton Culture Code
 
PEPSICO Presentation to CAGNY Conference Feb 2024
PEPSICO Presentation to CAGNY Conference Feb 2024PEPSICO Presentation to CAGNY Conference Feb 2024
PEPSICO Presentation to CAGNY Conference Feb 2024
 
Content Methodology: A Best Practices Report (Webinar)
Content Methodology: A Best Practices Report (Webinar)Content Methodology: A Best Practices Report (Webinar)
Content Methodology: A Best Practices Report (Webinar)
 
How to Prepare For a Successful Job Search for 2024
How to Prepare For a Successful Job Search for 2024How to Prepare For a Successful Job Search for 2024
How to Prepare For a Successful Job Search for 2024
 
Social Media Marketing Trends 2024 // The Global Indie Insights
Social Media Marketing Trends 2024 // The Global Indie InsightsSocial Media Marketing Trends 2024 // The Global Indie Insights
Social Media Marketing Trends 2024 // The Global Indie Insights
 
Trends In Paid Search: Navigating The Digital Landscape In 2024
Trends In Paid Search: Navigating The Digital Landscape In 2024Trends In Paid Search: Navigating The Digital Landscape In 2024
Trends In Paid Search: Navigating The Digital Landscape In 2024
 
5 Public speaking tips from TED - Visualized summary
5 Public speaking tips from TED - Visualized summary5 Public speaking tips from TED - Visualized summary
5 Public speaking tips from TED - Visualized summary
 
ChatGPT and the Future of Work - Clark Boyd
ChatGPT and the Future of Work - Clark Boyd ChatGPT and the Future of Work - Clark Boyd
ChatGPT and the Future of Work - Clark Boyd
 
Getting into the tech field. what next
Getting into the tech field. what next Getting into the tech field. what next
Getting into the tech field. what next
 
Google's Just Not That Into You: Understanding Core Updates & Search Intent
Google's Just Not That Into You: Understanding Core Updates & Search IntentGoogle's Just Not That Into You: Understanding Core Updates & Search Intent
Google's Just Not That Into You: Understanding Core Updates & Search Intent
 
How to have difficult conversations
How to have difficult conversations How to have difficult conversations
How to have difficult conversations
 
Introduction to Data Science
Introduction to Data ScienceIntroduction to Data Science
Introduction to Data Science
 
Time Management & Productivity - Best Practices
Time Management & Productivity -  Best PracticesTime Management & Productivity -  Best Practices
Time Management & Productivity - Best Practices
 
The six step guide to practical project management
The six step guide to practical project managementThe six step guide to practical project management
The six step guide to practical project management
 
Beginners Guide to TikTok for Search - Rachel Pearson - We are Tilt __ Bright...
Beginners Guide to TikTok for Search - Rachel Pearson - We are Tilt __ Bright...Beginners Guide to TikTok for Search - Rachel Pearson - We are Tilt __ Bright...
Beginners Guide to TikTok for Search - Rachel Pearson - We are Tilt __ Bright...
 

Resultados encuesta

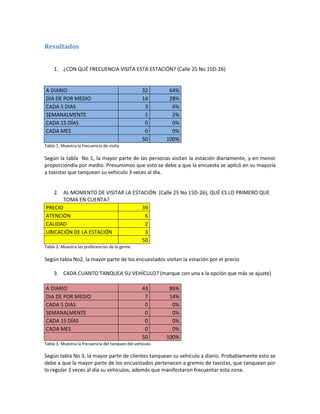
  • 1. Resultados 1. ¿CON QUÉ FRECUENCIA VISITA ESTA ESTACIÓN? (Calle 25 No 15D-26) A DIARIO 32 64% DIA DE POR MEDIO 14 28% CADA 5 DIAS 3 6% SEMANALMENTE 1 2% CADA 15 DÍAS 0 0% CADA MES 0 0% 50 100% Tabla 1. Muestra la frecuencia de visita Según la tabla No 1, la mayor parte de las personas visitan la estación diariamente, y en menor proporcióndía por medio. Presumimos que esto se debe a que la encuesta se aplicó en su mayoría a taxistas que tanquean su vehículo 3 veces al día. 2. AL MOMENTO DE VISITAR LA ESTACIÓN (Calle 25 No 15D-26), QUÉ ES LO PRIMERO QUE TOMA EN CUENTA? PRECIO 39 ATENCIÓN 6 CALIDAD 2 UBICACIÓN DE LA ESTACIÓN 3 50 Tabla 2. Muestra las preferencias de la gente. Según tabla No2, la mayor parte de los encuestados visitan la estación por el precio 3. CADA CUANTO TANQUEA SU VEHÍCULO? (marque con una x la opción que más se ajuste) A DIARIO 43 86% DIA DE POR MEDIO 7 14% CADA 5 DIAS 0 0% SEMANALMENTE 0 0% CADA 15 DÍAS 0 0% CADA MES 0 0% 50 100% Tabla 3. Muestra la frecuencia del tanqueo del vehículo. Según tabla No 3, la mayor parte de clientes tanquean su vehículo a diario. Probablemente esto se debe a que la mayor parte de los encuestados pertenecen a gremio de taxistas, que tanquean por lo regular 3 veces al día su vehículos, además que manifestaron frecuentar esta zona.
  • 2. 4. ¿CUÁNTOS METROS CÚBICOS COMPRA CADA VEZ? (marque con una x la opción que más se acerque) DE 1-3 0 0% DE 4-6 26 52% DE 7-10 22 44% MAS DE 10 2 4% 50 100% Tabla 4. Muestra la cantidad de metros cúbicos comprados cada vez. Según tabla No 4 la mayoría de clientes tanquean "full" promedio de 6 a 7 metros cúbicos 5. ¿CUÁNTO DINERO GASTA EN G.N.C.V. SEMANALMENTE? (marque con una x la opción que mas se acerque) De 1 a 10.000 0 0% De 11.000 a 20.000 0 0% De 21.000 a 30.000 0 0% De 31.000 a 40.000 1 2% De 41.000 a 50.000 1 2% De 51.000 a 60.000 1 2% De 61.000 a 80.000 2 4% De 81.000 a 100.000 18 36% Mas de 100.000 27 54% 50 100% Tabla 5. Muestra cantidad de dinero gastado semanalmente. Según tabla No 5, el promedio que compra un cliente de G.N.C.V. esta en $ 80.000 6. ¿ESTARÍA DISPUESTO A VISITAR LA NUEVA ESTACIÓN? (Cra 12 Calle 15 ) (marque con una x su respuesta) SI 44 88% NO 6 12% 50 100% Tabla 6. Muestra disposición de visita Según tabla No 6 la mayor cantidad de las personas encuestadas estarían dispuestas a visitar la nueva estación.
  • 3. 7. ¿CADA CUÁNTO TIEMPO VISITARÍA LA NUEVA ESTACIÓN? (Cra 12 Calle 15 ) (marque x en la opción que mas se acerque) A DIARIO 18 36% DIA DE POR MEDIO 6 12% CADA 5 DIAS 3 6% SEMANALMENTE 10 20% CADA 15 DÍAS 4 8% CADA MES 3 6% NO RESPONDEN 6 12% 50 100% Tabla 7. Muestra la frecuencia de visita. Según tabla No 7, la mayor parte de encuestados visitarían la nueva estación a diario, aunque encontramos un 12% que no respondieron a la pregunta, que fueron los que contestaron negativamente a la pregunta 6, y que no estaban contempladas dentro de las posibles opciones de respuesta, dentro de la encuesta.