Urban Launchpad - Living Dhaka
•
0 recomendaciones•689 vistas

Latest and greatest launch plan as of November 26, 2011

Recomendados
Recomendados
Más contenido relacionado
Similar a Urban Launchpad - Living Dhaka
Similar a Urban Launchpad - Living Dhaka (20)
Más de Albert Ching
Más de Albert Ching (15)
Último
Último (20)
Urban Launchpad - Living Dhaka
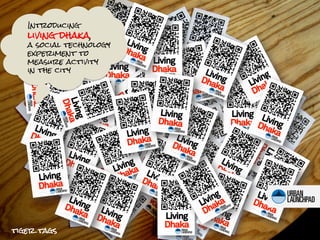
- 1. Introducing living dhaka, a social technology experiment to measure activity in the city tiger tags
- 2. a tiger tag is just a piece of paper with a qr code embedded with a unique but anonymous id e.g. bengaltiger445 Living Dhaka
- 3. when an individual carries it, he or she becomes a tiger who can then be tracked by smartphone carrying volunteers.
- 4. one scan can log a host of information on those tigers 4:59 pm (time) smiling (happiness) 23.70, 90.44 (location) walking (transport mode)
- 5. which can then be sent into the cloud and aggregrated to produce measurements like the following which we tested at mit
- 6. Living Showcase at MIT | Nov17,2011 where the tigers roamed when the tigers came and went, how long they stayed the relationship btwn what what the tigers were interested in they liked and where it was located
- 7. Living Showcase at MIT | Nov17,2011 6 smartphones, 8 volunteers, 140 tigers total cost - $200 (t-shirts, printing zebra tags, phones borrowed) development time – 4 (long) days, 1-2 people Living Dhaka | weekofJanuary12, 2012 50 smartphones, 100 volunteers, x tigers? total cost - $10-20,000 we’d like to measure things not normally measured (e.g. pedestrian flows, bus ridership, cycle rickshaw flows) and understand how both the measurements themselves and the social process of measurement is received by the city development time – 2 months
- 8. Living Dhaka | weekofJanuary12, 2012 Old Dhaka Pedestrian Density & Flows 10 AM 1 PM 6 PM (LARGER SCALE) experimental design 50 scanners at 25 fixed nodes main pedestrian 3 separate scanning times corridors color of dots = high no. of scans/ minute
- 9. Living Dhaka | weekofJanuary12, 2012 Firmgate Bus Ridership and Speeds estimated speeds experimental design <5 km/h 50 scanners @ 6 fixed nodes size of colors represents tap-outs number of people alighting from those stops from farmgate speed calculated by average of consecutive 5-10 km/h scans 10-15 km/h tap-ins 6 PM (MEDIUM SCALE)
- 10. Living Dhaka | weekofJanuary12, 2012 Dhanmondi Lake Happiness and Density Map experimental design 50 roaming scanners 1 scanning time at peak time favorite spots blue color = places of highest number of happy people 8 PM (MEDIUM SCALE)
- 11. Living Dhaka | weekofJanuary12, 2012 we’d like to measure before and after an experiment that improves car-free travel* Before After did this experiment work? would data change your mind? * are there any experiments that improve car-free travel in dhaka that can be measured in mid-january?
- 12. Living Dhaka | weekofJanuary12, 2012
- 13. Collaborators Albert Ching is an aspiring urban innovator, a lifelong Hawaiian and former Googler based in Mountain View, Hyderabad and Singapore. Albert is enduring the frigid cold of Boston to help cities innovate, specifically by using the proliferation of information technologies to solve transport problems in South and Southeast Asia. He is a researcher for the Singapore-MIT Alliance’s Future of Urban Mobility project. www.mrching.blogspot.com Stephen Kennedy is a designer and artist formerly based in Atlanta with a background in Industrial Design from Georgia Tech. At first a reluctant transplant to Boston, Stephen has enjoyed trying to escape frigid New England by working as a hybrid planner-designer on signage initiatives in New Orleans, greenway planning in the Bronx, urban realm technology in Thessaloniki, and participatory planning in Indonesia. His focus is on both physical planning and spatial information design. www.stephenjameskennedy.com Muntasir Mamun Imran is a nature lover, adventure-trekker, and an experienced social entrepreneur from Bangladesh. He is the co-founder of Kewkradong Bangladesh, country coordinator for the Ocean Conservancy’s International Coastal Cleanup, and Organizer of the Banff Mountain Film Festival World Tour. He has organized cycling rides throughout Bangladesh including the Sir Edmund Hillary Ride, the Ride for Green, and the LiveStrong Ride. www.muntasirmamun.com/
- 14. Advisors P. Chris Zegras is the Ford Assistant Professor of Urban Planning and Transportation at MIT. His research interests include the influence of the built environment on individual travel behavior, transportation infrastructure and system financing, indicators of sustainable transportation, and mitigating transportation greenhouse gas emissions. On these and other related topics, he has consulted widely, including for the World Bank, the Inter-American Development Bank, the Canadian, German, US, and Peruvian Governments, the World Business Council for Sustainable Development, and the United Nations Center for Regional Development. Zia Wadud is an Associate Professor in Civil Engineering at the Bangladesh University of Engineering and Technology (BUET). Zia completed his PhD from Imperial College London in Civil Engineering Policy in 2008 as a Commonwealth Scholar and held research positions at the University of Cambridge and at Massachusetts Institute of Technology. Zia’s current research interests are in modeling and valuation of policy interventions in the transportation and environment sector (including climate change policy), modeling energy demand and assessing risk and vulnerability in the context of broader Civil Engineering topics.
- 15. inspired by the bengal tiger and stripe spotter
- 16. appendix
- 17. why dhaka? small window of opportunity to avoid car-centric development but need creative solutions that employ a limited number of smartphones mobile phones window of opportunity smartphones penetration Chicago Sydney cars 48% Bangkok Jakarta auto lock-in line (10-20%) 1% <1% time Dhaka today
- 18. We have big ambitions . . . Can the mayor of Dhaka run his city like an MIT scientist managing a lab of experiments? we are here Feelings à Decisions Data à Decisions People à Data à Visualizations à rebranding car alternatives + the city à Decisions Experiments -> measurement (through people and phones) à Iteration à Remeasurement à new experiments à repeat à rinse -> where we’d like repeat faster cities to be zebra tags
- 19. but there’s a lot we don’t know finish 4 SUSTAINABLE zebra tags as a store 3 IMPACT of commercial value data -> decisions integration with mobile payments people à data à visualizations à incentives to motivate rebranding car users to scan 2 MEASUREMENT alternatives + the city à decisions value to local start businesses and measure pre- and post- transport providers experiments -> experiments measurement how to tell if there is a 1 SOCIAL (through people and difference? phones) à Iteration à TECHNOLOGY Remeasurement à new measure things experiments à repeat Social otherwise difficult to à rinse -> repeat will people in dhaka measure faster want to be how often the rich and measured? in what poor meet format? how should volunteers make visible the invisible be organized and pedestrians, cycle motivated? rickshaws, the poor, the aged technology will the technology work as planned in dhaka? how fast can the system be rapidly iterated on and deployed?
- 20. Living Dhaka | weekofJanuary12, 2012 1 PRINT QR 2 DISTRIBUTE 3 SCAN 4 REGISTER BADGES TO CITIZENS CITIZENS IN CITIZENS AT OUTSIDE TARGET AREA NOTABLE TARGET AREA POINTS Measurement Process
- 21. Living Dhaka | weekofJanuary12, 2012 1 NO. OF 2 SCANNING 3 FIXED vs. 4 SIZE OF SCANNERS TIME FLEXIBLE MEASUREMENT SCANNERS AREA target is 50 target is <1 second 10 teams of 5 fixed single street or few blocks peak capacity = 50 x 60 = 300 data points per large neighborhood minute, or 18,000 per or street network hour flexible Measurement Variables
- 22. The Urban Launchpad is a MIT-started social mission-driven company / research lab aspiring to accelerate experimentation and innovation in cities through rapid prototyping and performance measurement on an urban scale