

Recomendados
Más contenido relacionado
Similar a Gps 101 c_dillard
Similar a Gps 101 c_dillard (20)
Más de nacaa
Más de nacaa (20)
Último
Último (20)
Gps 101 c_dillard
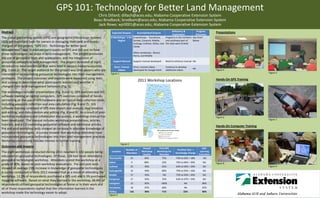
- 1. GPS 101: Technology for Better Land Management Chris Dillard; dillach@aces.edu; Alabama Cooperative Extension System Beau Brodbeck; brodbam@aces.edu; Alabama Cooperative Extension System Jack Rowe; wjr0001@aces.edu; Alabama Cooperative Extension System Abstract Deficiency & Program Presentations Expected Outputs Accomplished Outputs Explanation Outcomes The global positioning system (GPS) and geographic information systems 8 Workshops: 1 Per 8 workshops : Tuscaloosa, Programs in the northern See Chart Region Sumter, Conecuh, Mobile, and southeast part of Below (GIS) are important tools for owners in managing their land and forests. Autauga, Cullman, Dallas, and the state were limited The goal of the project, “GPS 101: Technology for Better Land Clarke Management”, was to educate participants on GPS and GIS and on how Other workshops: Blount, these technologies can assist in land management. The project promoted Henry, and Mobile the use of geospatial tools and applications, and the integration of geospatial concepts in land management. The project consisted of eight Support Manual Support manual developed Need to enhance manual NA introductory-level workshops that were held in various Alabama counties Short, Tutorial Short, tutorial videos Continue to develop NA (Fig. 1 and 2). The target audience for the project was land owners who are Videos developed for Google Earth additional videos Figure 4 Figure 1 Figure 5 interested in incorporating geospatial technologies into their management strategies. The project outcomes and impacts were measured using tests Hands-On GPS Training and surveys to determine what participants learned and whether it 2011 Workshop Locations changed their land management behaviors (Fig. 3). The workshops included presentations (Fig. 4 and 5), GPS exercises and GIS software training on laptop computers. GPS exercises consisted of hands- on training on the use of GPS hardware and on typical data collection tasks, including waypoint collection and area calculation (Fig. 6 and 7). GIS software training consisted of GPS data import and analysis, map creation and editing, and data creation and editing (Fig. 8 and 9). As a result of post- workshop evaluations and collaborator discussions, a workshop manual has Figure 6 been developed. The manual includes workshop presentations, articles, Figure 7 tutorials, and a CD containing geospatial software and additional articles. Hands-On Computer Training Pre and post-workshop tests showed an increase in attendee knowledge of geospatial technologies. A survey showed that workshop attendees have incorporated geospatial technologies into their land management practices. Workshop evaluations indicate interest in further training. Figure 2 Outcomes and Impacts Overall First GPS Self- Number of Pre/Post Test = The eight workshops conducted during 2011 resulted in 142 people being Location Workshop Workshop for Learning Attendees Knowledge Change Quality Attendee Evaluation educated on geospatial technologies. Of those, 128 had never attended a Thomasville 25 94% 75% 74% to 92% = 18% NA geospatial technologies workshop. Attendees scored the workshop at a Selma 9 88% 33% 76% to 96% = 20% NA Figure 8 grade of 90%, based on post-workshop evaluations. Pre and post tests Cullman 25 90% 65% 63% to 92% = 29% NA Figure 9 showed an average 23% increase in knowledge of geospatial technologies. Autaugaville 16 90% 80% 76% to 92% = 16% NA A survey conducted in early 2012 revealed that as a result of attending the Mobile 17 93% NA 72% to 92% = 20% NA workshop, 12.5% of respondents purchased a GPS unit and 6.3% purchased Evergreen 17 93% 76% 63% to 97% = 34% NA mapping software. Based on what they learned in the workshop, 68.8% of Livingston 15 85% 100% NA 88% respondents utilized geospatial technologies at home or in their work and all of those respondents replied that the information learned in the Tuscaloosa 18 87% 68% NA 92% workshop made the technology easier to adopt. TOTALs 142 90% 71% 23% 90% Figure 3