
Recomendados
Recomendados
Más contenido relacionado
La actualidad más candente
La actualidad más candente (6)
Similar a Social Network Analysis White Paper
Similar a Social Network Analysis White Paper (20)
Social Network Analysis White Paper
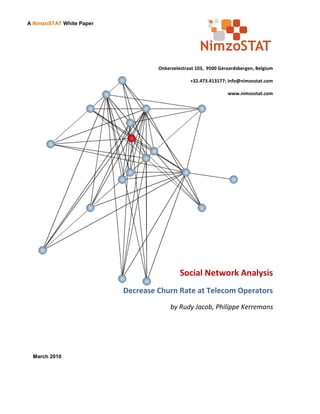
- 1. A NimzoSTAT White Paper Onkerzelestraat 103, 9500 Geraardsbergen, Belgium +32.473.413177; info@nimzostat.com www.nimzostat.com Social Network Analysis Decrease Churn Rate at Telecom Operators by Rudy Jacob, Philippe Kerremans March 2010
- 2. INTRODUCTION CONTENTS In today’s highly complex and dynamic market the ability of telecom operators to retain customers and cross-sell products and services is of critical importance. As Telecom penetration is increasing and even approaching saturation, the focus of Introduction ......................................... 2 Telecom Business Intelligence is shifting from customer acquisition to customer retention; Churn in Telecom is a Problem ......... 2 Telecoms must work harder than ever to hold onto their customer base and attempt to draw numbers Added Value of SNA ........................... 3 from their rivals. Improve Existing Models ........................ 3 Further investments are being made into customer profiling, to obtain a detailed picture of customer Predict Churn Standalone ....................... 3 segments and individual customers. However, Improve Marketing Campaigns .............. 3 traditional methods of generating customer insight to achieve these goals continue to miss a key How to Implement SNA ...................... 3 dimension. The key to better targeting and treatment is to gain insight into the relationships Identify Influencers in your Network ...... 3 customers have with other people in their (call) network. Modules of Social Network Analysis....... 3 SOCIAL NETWORK ANALYSIS (SNA) IS A FAST Constructing the Network .................. 3 EMERGING DISCIPLINE FOR PREDICTING AND Deeper Digging ................................... 4 INFLUENCING CONSUMER BEHAVIOR. IT FOCUSES ON HOW RELATIONSHIPS ARE BUILT Methodology ...................................... 5 AND HOW THEY CONTRIBUTE TO INFLUENCING INDIVIDUALS WITHIN SOCIAL GROUPS. Let us analyze your call data ............. 5 Integrating SNA in marketing campaigns and Conclusion .......................................... 5 customer retention has shown on several accounts that churn can be reduced significantly in Telecom About NimzoSTAT .............................. 6 operators (prepaid/postpaid, fixed/mobile). About the authors .................................. 6 CHURN IN TELECOM IS A PROBLEM Churn and customer value are critical to Telecoms. If a customer spends $50/month and you have 5M customers then 0.5% churn is $1.25M/mo every month from then on. Annual churn rates in the prepaid segment average between a significant 50 to 70 percent. Lowering this churn percentage has a large effect on the bottom line. 2|P a g e
- 3. Even a small reduction in churn can mean IMPROVE MARKETING CAMPAIGNS big savings—the cost of retaining a client is estimated to be only one-fifth of acquiring By having detailed influence parameters per target, one. And these consumers could ultimately marketing campaigns can be better segmented and help decrease the churn within their own therefore cheaper and more efficient. social circles, amounting to even more potential savings. HOW TO IMPLEMENT SNA ADDED VALUE OF SNA IDENTIFY INFLUENCERS IN YOUR NETWORK Attributes derived from SNA may be used alone or as input to classic predictive Influencers are people that are more (or more models to help improve their accuracy. strongly) connected. Not only will their impact on Marketing campaigns aimed at retaining the network be larger than for people with an existing subscribers can be enriched by the average amount of connections, they are also an intelligence gained through SNA ideal target for a marketing campaign. Research has capabilities. SNA helps to pinpoint shown that network neighbors – customers who are influential customers who are the most linked to an existing consumer – adopt a service at a likely to drop their service or jump to a rate three to five times greater than customers competitor. selected using marketing best practices. Because those influencers will have contact with more potential customers, the ROI of a marketing IMPROVE EXISTING MODELS campaign will increase significantly when targeted to the influencers in your network. Integrating the social network parameters into existing predictive models increases the model performance by a factor of ten or more and the retention campaigns see an MODULES OF SOCIAL NETWORK ANALYSIS even better uplift (10 – 25 times). CONSTRUCTING THE NETWORK This is the basis of all the detailed analysis. PREDICT CHURN STANDALONE Data is already available on-site in your Call Data Even if no other predictive model is database. The processing step can be time available at a Telco, it is still possible by consuming but social networks do not change means of simply analyzing existing call data, drastically overnight, and therefore monthly or to calculate the probability that if one user quarterly processing of the call data records is churns, that other people in his network will sufficient. churn. Several centrality parameters are determined: 3|P a g e
- 4. o Degree Centrality: Number of direct o Eigenvector Centrality (Reach) is a measure of ties to other people in the network. the importance of your nodes in the network. Google's PageRank is a variant of the Eigenvector centrality measure. Depending on the type of marketing campaign one of the above metrics will determine which customer to select: If you simply want to spread your message to as many people as possible, you want to seed your campaign with members that have high Degree Centrality. o Closeness Centrality: Capacity to IF YOU WANT TO SPREAD YOUR MESSAGE AS FAST reach the rest of the network. AS POSSIBLE, YOU WILL NEED TO TARGET MEMBERS WITH A HIGH CLOSENESS VALUE. If conversion is important you must choose the influencers that have a large reach. DEEPER DIGGING o Find families and head of households. o Identify rotational churners (spinners). Sometimes people leave and come back; try to keep them for good. o Betweenness Centrality: A node on a o Anomaly detection is not a direct way to communication path controls the reduce churn, but identifying anomalies in communication flow, and therefore the network can keep those nodes out of important (node value .73). the calculations, so that the normal ones provide cleaner results. 4|P a g e
- 5. The “Validation & Interpretation” step requires your METHODOLOGY business knowledge and assistance, together with NimzoSTAT’s statistical analysis. NimzoSTAT uses the Fayyad methodology for Knowledge Discovery in its SNA solution. NimzoSTAT has collaborations with leading scientific researchers within the field of social network The iterative nature is important for analysis and modeling, such as Prof. Dr. Bart Baesens constant learning and tuning of the model. from K.U.Leuven. The centrality parameters in a way, are “just” numbers, and need to be properly The output can be stored in your database and weighed for their influence of churn in your integrated in your business process to set up network. marketing campaigns. By contrasting these results with your list of Our solution is offered in a SaaS business model. actual churners and other socio- However, for privacy policy reasons, the solution can demographic and CRM data, the model can be also be deployed locally within your existing IT be further optimized. infrastructure. LET US ANALYZE YOUR CALL DATA CONCLUSION NimzoSTAT has the algorithms in place to Social Network Analysis provides ways to help you to analyze your CDR data. We discuss with all lower customer churn significantly and can decrease stakeholders how to select, pre-process, the cost of your marketing campaign through better transform and mine your data for SNA. selection of the target customer population. 5|P a g e
- 6. ABOUT NIMZOSTAT NimzoSTAT is a Belgian privately owned company. NimzoSTAT innovates with its own down-to-earth solutions, placing the field-specific expertise of its customers at the heart of its know-how and tools. NimzoSTAT translates its cross-sector experience in a win-win solution for each customer. Our goal is to activate the memory (databases, data warehouse) of your company to be able to use it to steer your current and future policy and vision in an easy and efficient manner. ABOUT THE AUTHORS Rudy Jacob has 15 years of international experience with Telecom BSS systems and is Managing Partner of NimzoSTAT. Dr. Philippe Kerremans has 25 years of experience as an IT professional and is an expert in virtual world and social network analytics. We collaborate with the academic world, and take the opportunity to thank Prof. Dr. Bart Baesens of the University of Leuven, Belgium (www.econ.kuleuven.be) for his input for this white paper. 6|P a g e