SlideShare una empresa de Scribd logo
1 de 2
Descargar para leer sin conexión
Republic of the Philippines
                                                                                                                                      Department of Environment & Natural Resources
                                                                                                                                           MINES & GEOSCIENCES BUREAU

                                                                                                                                            MINING INDUSTRY STATISTICS
                                                                                                                                            (Release Date: 8 January 2013)

                                                            1997             1998             1999             2000            2001             2002               2003               2004             2005                2006               2007              2008              2009              2010              2011
Gross Production Value In Mining (MGB)
      Large Scale Metallic Mining                        P 9.1 Billion    P 9.0 Billion    P 7.6 Billion   P 9.2 Billion    P 7.8 Billion    P 6.7 Billion    P    7.5 Billion   P    8.0 Billion   P 13.2 Billion    P   27.0 Billion    P 49.2 Billion   P 29.7 Billion    P 42.8 Billion    P 69.1 Billion    P 88.0 Billion
      Small Scale Gold Mining                            P 4.5 Billion   P 7.6 Billion     P 6.0 Billion   P 8.3 Billion    P10.0 Billion    P14.3 Billion    P   19.9 Billion   P   21.5 Billion   P 24.2 Billion    P   28.2 Billion    P 32.2 Billion   P 33.9 Billion    P 36.8 Billion    P 42.9 Billion      34.1 Billion
      Non-Metallic Mining                               P 19.5 Billion   P 21.1 Billion    P17.3 Billion   P13.5 Billion    P11.2 Billion    P 14.2 Billion   P   13.7 Billion   P   13.9 Billion   P12,8 Billion     P   17.0 Billion    P 20.8 Billion   P 23.5 Billion    P 26.5 Billion    P 33.3 Billion      41.1 Billion
          TOTAL                                         P 33.1 Billion   P 37.7 Billion   P 30.9 Billion   P31.0 Billion   P 29.0 Billion    P 35.2 Billion   P   41.1 Billion   P   43.4 Billion   P 50.2 Billion   P    72.2 Billion   P 102.2 Billion   P 87.1 Billion    P 106.1 Billion   P 145.3 Billion   P163.2 Billion
Total Mining Investment Data from the Revitalization                                                                                                                                                                 $ 190.3 Million     $ 708.4 Million   $ 604.2 Million   $ 719.5 Million   $ 968.3 Million   $ 618.5 Million
 Program Under EO 270 (MGB)
Gross Value Added In Mining At Current Prices (NSCB)                     P 24.9 Billion P 21.0 Billion P 22.2 Billion P 20.7 Billion P 25.8 Billion P 30.3 Billion P 32.6 Billion P 37.1 Billion                     P 43.9 Billion      P 60.0 Billion    P 53.6 Billion    P 65.8 Billion    P 88.2 Billion    P 96.9 Billion
Mining Contribution To GDP                                                  0.8%           0.6%           0.6%           0.5%           0.6%           0.7%           0.6%            0.6%                               0.7%                0.9%              0.7%              0.8%              1.0%              1.0%
Total Exports of Minerals & Mineral Products (BSP)      $ 762 Million    $ 592 Million    $ 645 Million    $ 649 Million   $537 Million      $519 Million     $637 Million       $797 Million       $820 Million     $2,103 Million      $2,605 Million    $2,498 Million    $1,470 Million    $1,929 Million    $2,659 Million
Mining Contribution To Total Exports                        3.0%             2.0%             1.8%             1.7%           1.7%              1.5%             1.8%               2.0%               2.0%              4.5%                5.3%              5.2%              3.9%               3.8%              5.6%
Total Exports of Non-Met. Mineral Manufactures (BSP)                                      $111 Million     $133 Million    $123 Million      $113 Million     $128 Million       $165 Million       $171 Million      $182 Million        $223 Million      $211 Million      $156 Million      $162 Million      $177 Million
Mining Contribution To Total Exports                                                         0.3%             0.4%            0.4%              0.3%             0.4%               0.4%               0.4%              0.4%                0.4%              0.4%              0.4%              0.3%              0.4%
Employment In Mining and Quarrying (DOLE)                  130,000         120,000          100,000          110,000          104,000          101,000            104,000            118,000          123,000             141,000           149,000           158,000           169,000           197,000           210,000
Mining Contribution To Total Employment                     0.47%           0.43%            0.34%            0.34%            0.32%            0.3%               0.3%               0.3%             0.4%                0.4%              0.4%              0.5%              0.5%              0.5%              0.6%
Taxes, Fees and Royalties From Mining
 Fees, Charges & Royalties Collected by DENR-MGB                        P 34.9 Million P 37.5 Million P 51.2 Million       P 66.3 Million P 58.5 Million P 79.8 Million P120.1 Million     P210.2 Million             P 192.1 Million  P 774.0 Million  P 557.4 Million P 396.2 Million P 800.6 Million P 1,180.8 Million
 Excise Tax Collected by BIR                           P 114.8 Million    123.9 Million   241.1 Million   243.3 Million      129.8 Million   303.6 Million   155.8 Million   232.5 Million   251.4 Million              489.6 Million     942.1 Million    660.3 Million    718.8 Million   1,305.9 Million   6,985.8 Million
 Taxes Collected by Nat'l. Gov't. Agencies                921.5 Million  798.6 Million 1,016.9 Million 1,279.1 Million      647.6 Million   823..8 Million 1,039.2 Million 2,769.1 Million 4,733.6 Million            5,313.2 Million   8,371.7 Million  5,949.5 Million 10,272.5 Million  10,201.9 Million   9,463.7 Million
 Taxes and Fees Collected by LGUs                          70.7 Million  116.7 Million   180.9 Million    152.1 Million     138.4 Million    204.8 Million  226.9 Million    358.5 Million   453.5 Million              395.0 Million     359.8 Million    522.2 Million     992.8 Million  1,071.2 Million     897.0 Million
        TOTAL                                          P1,107.0Million P1,074.1Million P1,476.4Million P1,725.7Million     P 982.1Million P1,390.7Million P1,501.7Million P3,480.2Million P5,648.7 Million           P6,389.9 Million P10,447.6 Million P7,689.4 Million P12,380.3Million P13,379.6 Million P18,527.2 Million
Number of Operating Metallic Mines:
  Copper (with gold & silver)                                 4                3                3               3                3                1                  1                  1                1                   1                  1                 2                 3                 3                 3
  Copper (with gold, silver & zinc)                                                                                                                                                                                                             1                 1                 1                 1                 1
  Gold (with silver)                                          6                7                5               3                2                2                  6                  7                7                   7                  7                 8                 8                 8                 5
  Metallurgical Chromite (ore & concentrate)                  3                3                2               1                1                1                  1                  2                2                   2                  2                 1                 1                 1                 2
  Refractory Chromite                                         1                1                0               1                1                1                  1                  1                1                   1                  1
  Chemical Grade Chromite                                                                                                                         1                                     1                1                   1                  1                 1
  Nickel                                                      3                3                3               4                3                3                  4                  4                4                   5                 11                10                10                15                18
  Nickel Concentrate
  Iron ore                                                                                                                                                           1                                                                                                                                                  1
      Total Operating Metallic Mines                         17               17               13               12              10                9                 14                 16                16                  17                24                23                23                28                30

Number of Processing Plant/Smelter:
 Copper Smelter                                                                                                                                                                         1                1                   1                  1                 1                 1                 1                 1
 Nickel Processing Plant                                                                                                                                                                1                1                   1                  1                 1                 1                 1                 1
      Total Processing Plant/Smelter                                                                                                                                                    2                2                   2                  2                 2                 2                 2                 2
Number of Approved and Registered
  MPSA                                                                                                                          162              164                175                198              216                 209               236               264               275               318               339
  FTAA                                                                                                                           2                2                  2                  2                2                   2                 2                 2                 3                 6                 6
1997             1998              1999              2000             2001           2002           2003           2004           2005           2006           2007           2008           2009            2010              2011
  EP                                                                                                                                    9              13             16             13             28             33             44             39             54              99               113
  IP                                                                                                                                   109            104            101            103            120            161            185            199            213             202               192
  MPP                                                                                                                                                                                 7             26             26             37             41             41              54                68
     TOTAL                                                                                                                             282            283            294            323            392            431            504            545            586             679               718
Number of Applications Under Process
  MPSA                                                                                                                                1,578          1,529          1,374          1,337          1,403          1,318          1,111          1,058           997             839              605
  FTAA                                                                                                                                  43             42             41             40             56             56             54             52             52              49               21
  EP                                                                                                                                   380            374            348            366            474            720           1,074          1,496          1,575           1,545             823
  IP                                                                                                                                   346            372            310            302            251            266            288            291            288             294              242
  MPP                                                                                                                                                                                31             40             37             36             40             42              44               37
     TOTAL                                                                                                                            2347           2317           2073           2,076          2,224          2,397          2,563          2,937          2,954           2,771            1,728
Average world price of Copper (WMS/LME)                      $ 1.03 / lb.      $ 0.75 / lb      $ 0.71 / lb        $0.82 / lb       $0.72 / lb     $0.71 / lb     $0.81 / lb     $1.30 / lb     $1.58 / lb      $3.02 / lb     $3.20 / lb     $3.16 / lb     $2.28 / lb     $3.40 / lb        $4.00 / lb*
Average world price of Gold (WMS/BSP)                        $ 331 / oz        $ 293 / oz      $ 279.04 / oz     $ 279.28 / oz     $271.10 / oz   $310.20 / oz   $363.38 / oz   $409.23 / oz   $431.35 / oz   $600.71 / oz   $696.37 / oz   $871.52 / oz   $973.01 / oz   $1,222.02 / oz   $1,570.25 / oz*
Average world price of Silver (WMS/BSP)                      $ 4.90 / oz       $5.51 / oz       $ 5.22 / oz       $ 4.95 / oz       $4.37 / oz     $4.60 / oz     $4.87 / oz     $6.63 / oz     $7.04 / oz     $11.55 / oz    $13.38 / oz    $15.00 / oz    $14.67 / oz    $20.13 / oz      $35.22 / oz*
Average world price of Nickel (WMS/LME)                      $ 3.14 / lb       $ 2.10 / lb      $ 2.73 / lb       $ 3.92 / lb       $2.70 / lb     $3.07 / lb     $4.37 / lb     $6.27 / lb     $7.00 / lb     $10.88 / lb    $16.84 / lb     $9.58 / lb     $6.56 / lb     $9.82 / lb       $10.39 / lb*
Peso to US Dollar Exchange Rate (BSP)                          P 29.47 / $         P 40.90 / $      P 39.08 / $    P 44.19 / $        P 50.99       P51.62         P54.26         P56.09         P55.02         P51.32         P46.15         P44.48         P47.64          P45.11            P43.31
+Preliminary; nda - no data available; nya - not yet available
Note: Number of operating mines were based on production reports submitted.
       Gross Value Added (GVA) - measures the contribution of a particular sector to the country's GNP; computed by subtracting the cost of
           production inputs from the gross output of a particular industry. Total GVA does not include crude oil.

ref: MIS(1997-present)/econ-ind summary/rvs/8Jan2013

Más contenido relacionado

Similar a Historical Mineral Industry Statistics

Leo Jasareno presentation at Conference on Mining's Impact on Philippine Econ...
Leo Jasareno presentation at Conference on Mining's Impact on Philippine Econ...Leo Jasareno presentation at Conference on Mining's Impact on Philippine Econ...
Leo Jasareno presentation at Conference on Mining's Impact on Philippine Econ...Arangkada Philippines
 
Sait uysal presentation - amorphous graphite
Sait uysal   presentation - amorphous graphiteSait uysal   presentation - amorphous graphite
Sait uysal presentation - amorphous graphitesaituysal
 
Presentation for the_minister-mining_development_in_guyana2
Presentation for the_minister-mining_development_in_guyana2Presentation for the_minister-mining_development_in_guyana2
Presentation for the_minister-mining_development_in_guyana2Mark LaJ
 
Saudi economy 2012
Saudi economy  2012Saudi economy  2012
Saudi economy 2012Gale Pooley
 
Grendene - 15th Annual Latin America Conference - Citigroup
Grendene - 15th Annual Latin America Conference - CitigroupGrendene - 15th Annual Latin America Conference - Citigroup
Grendene - 15th Annual Latin America Conference - CitigroupGrendene
 
Apresentação call 2 t12_eng
Apresentação call 2 t12_engApresentação call 2 t12_eng
Apresentação call 2 t12_engArteris S.A.
 
csx D6E96BFD-BB9B-4786-BFED-206E571130AF_AAR2009WK08_csx
csx D6E96BFD-BB9B-4786-BFED-206E571130AF_AAR2009WK08_csxcsx D6E96BFD-BB9B-4786-BFED-206E571130AF_AAR2009WK08_csx
csx D6E96BFD-BB9B-4786-BFED-206E571130AF_AAR2009WK08_csxfinance27
 
csx D6E96BFD-BB9B-4786-BFED-206E571130AF_AAR2009WK08_csx
csx D6E96BFD-BB9B-4786-BFED-206E571130AF_AAR2009WK08_csxcsx D6E96BFD-BB9B-4786-BFED-206E571130AF_AAR2009WK08_csx
csx D6E96BFD-BB9B-4786-BFED-206E571130AF_AAR2009WK08_csxfinance27
 
Pakistan Trade Policy Year 2009 2012
Pakistan Trade Policy Year 2009 2012Pakistan Trade Policy Year 2009 2012
Pakistan Trade Policy Year 2009 2012Mudassar Salman
 
08 15-2008 - 2 q08 earnings presentation
08 15-2008 - 2 q08 earnings presentation08 15-2008 - 2 q08 earnings presentation
08 15-2008 - 2 q08 earnings presentationSiteriCR2
 
Banks Island Gold Ltd. Reports NPV(8%) of $155M and IRR of 43% from Red Mount...
Banks Island Gold Ltd. Reports NPV(8%) of $155M and IRR of 43% from Red Mount...Banks Island Gold Ltd. Reports NPV(8%) of $155M and IRR of 43% from Red Mount...
Banks Island Gold Ltd. Reports NPV(8%) of $155M and IRR of 43% from Red Mount...Viral Network Inc
 
Us Gaap Q412 M 2010 Eng Final
Us Gaap Q412 M 2010 Eng FinalUs Gaap Q412 M 2010 Eng Final
Us Gaap Q412 M 2010 Eng FinalSergey Takhiev
 
Highlights 2010 11 Economic Outlook
Highlights 2010 11 Economic OutlookHighlights 2010 11 Economic Outlook
Highlights 2010 11 Economic Outlookgauravkakran
 

Similar a Historical Mineral Industry Statistics (20)

Mineral Industry Statistics
Mineral Industry StatisticsMineral Industry Statistics
Mineral Industry Statistics
 
Leo Jasareno presentation at Conference on Mining's Impact on Philippine Econ...
Leo Jasareno presentation at Conference on Mining's Impact on Philippine Econ...Leo Jasareno presentation at Conference on Mining's Impact on Philippine Econ...
Leo Jasareno presentation at Conference on Mining's Impact on Philippine Econ...
 
Mineral Industry Statistics
Mineral Industry StatisticsMineral Industry Statistics
Mineral Industry Statistics
 
Sait uysal presentation - amorphous graphite
Sait uysal   presentation - amorphous graphiteSait uysal   presentation - amorphous graphite
Sait uysal presentation - amorphous graphite
 
Gold prices soar but Africa loses out
Gold prices soar but Africa loses outGold prices soar but Africa loses out
Gold prices soar but Africa loses out
 
Presentation for the_minister-mining_development_in_guyana2
Presentation for the_minister-mining_development_in_guyana2Presentation for the_minister-mining_development_in_guyana2
Presentation for the_minister-mining_development_in_guyana2
 
Saudi economy 2012
Saudi economy  2012Saudi economy  2012
Saudi economy 2012
 
Mongolian review 2011
Mongolian review 2011Mongolian review 2011
Mongolian review 2011
 
Grendene - 15th Annual Latin America Conference - Citigroup
Grendene - 15th Annual Latin America Conference - CitigroupGrendene - 15th Annual Latin America Conference - Citigroup
Grendene - 15th Annual Latin America Conference - Citigroup
 
Apresentação call 2 t12_eng
Apresentação call 2 t12_engApresentação call 2 t12_eng
Apresentação call 2 t12_eng
 
csx D6E96BFD-BB9B-4786-BFED-206E571130AF_AAR2009WK08_csx
csx D6E96BFD-BB9B-4786-BFED-206E571130AF_AAR2009WK08_csxcsx D6E96BFD-BB9B-4786-BFED-206E571130AF_AAR2009WK08_csx
csx D6E96BFD-BB9B-4786-BFED-206E571130AF_AAR2009WK08_csx
 
csx D6E96BFD-BB9B-4786-BFED-206E571130AF_AAR2009WK08_csx
csx D6E96BFD-BB9B-4786-BFED-206E571130AF_AAR2009WK08_csxcsx D6E96BFD-BB9B-4786-BFED-206E571130AF_AAR2009WK08_csx
csx D6E96BFD-BB9B-4786-BFED-206E571130AF_AAR2009WK08_csx
 
Pakistan Trade Policy Year 2009 2012
Pakistan Trade Policy Year 2009 2012Pakistan Trade Policy Year 2009 2012
Pakistan Trade Policy Year 2009 2012
 
Li Yun — What does climate change mean to food consumption of low income grou...
Li Yun — What does climate change mean to food consumption of low income grou...Li Yun — What does climate change mean to food consumption of low income grou...
Li Yun — What does climate change mean to food consumption of low income grou...
 
14. Maiava
14. Maiava14. Maiava
14. Maiava
 
08 15-2008 - 2 q08 earnings presentation
08 15-2008 - 2 q08 earnings presentation08 15-2008 - 2 q08 earnings presentation
08 15-2008 - 2 q08 earnings presentation
 
south african foundry market
south african foundry marketsouth african foundry market
south african foundry market
 
Banks Island Gold Ltd. Reports NPV(8%) of $155M and IRR of 43% from Red Mount...
Banks Island Gold Ltd. Reports NPV(8%) of $155M and IRR of 43% from Red Mount...Banks Island Gold Ltd. Reports NPV(8%) of $155M and IRR of 43% from Red Mount...
Banks Island Gold Ltd. Reports NPV(8%) of $155M and IRR of 43% from Red Mount...
 
Us Gaap Q412 M 2010 Eng Final
Us Gaap Q412 M 2010 Eng FinalUs Gaap Q412 M 2010 Eng Final
Us Gaap Q412 M 2010 Eng Final
 
Highlights 2010 11 Economic Outlook
Highlights 2010 11 Economic OutlookHighlights 2010 11 Economic Outlook
Highlights 2010 11 Economic Outlook
 

Más de No to mining in Palawan

Philippine_ EITI_ Report_Volume_I_Contextual_Information_Final
Philippine_ EITI_ Report_Volume_I_Contextual_Information_FinalPhilippine_ EITI_ Report_Volume_I_Contextual_Information_Final
Philippine_ EITI_ Report_Volume_I_Contextual_Information_FinalNo to mining in Palawan
 
Philippine _EITI_ Report_Volume_II_Reconciliation_Report_Final
Philippine _EITI_ Report_Volume_II_Reconciliation_Report_FinalPhilippine _EITI_ Report_Volume_II_Reconciliation_Report_Final
Philippine _EITI_ Report_Volume_II_Reconciliation_Report_FinalNo to mining in Palawan
 
Philippine_EITI_Annexes_ Volume I_Contextual_Information
Philippine_EITI_Annexes_ Volume I_Contextual_InformationPhilippine_EITI_Annexes_ Volume I_Contextual_Information
Philippine_EITI_Annexes_ Volume I_Contextual_InformationNo to mining in Palawan
 
Speech by Julian Payne, President, Canadian Chamber of Commerce of the Philip...
Speech by Julian Payne, President, Canadian Chamber of Commerce of the Philip...Speech by Julian Payne, President, Canadian Chamber of Commerce of the Philip...
Speech by Julian Payne, President, Canadian Chamber of Commerce of the Philip...No to mining in Palawan
 
Mining Arangkada-3rd-Anniversary-Assesment
Mining Arangkada-3rd-Anniversary-AssesmentMining Arangkada-3rd-Anniversary-Assesment
Mining Arangkada-3rd-Anniversary-AssesmentNo to mining in Palawan
 
Philippine Metallic Mining December 2013
Philippine Metallic Mining December 2013Philippine Metallic Mining December 2013
Philippine Metallic Mining December 2013No to mining in Palawan
 
Intex Breach of Duty to Publicly Disclose Information
Intex Breach of Duty to Publicly Disclose InformationIntex Breach of Duty to Publicly Disclose Information
Intex Breach of Duty to Publicly Disclose InformationNo to mining in Palawan
 
Philippine Mining Production Export Figures
Philippine Mining Production Export FiguresPhilippine Mining Production Export Figures
Philippine Mining Production Export FiguresNo to mining in Palawan
 
CSM Summary Senate Hearing March 19 2013
CSM Summary Senate Hearing March 19 2013CSM Summary Senate Hearing March 19 2013
CSM Summary Senate Hearing March 19 2013No to mining in Palawan
 
Pollution Adjudication Board fines Philex Mining over Clean Water Act Violations
Pollution Adjudication Board fines Philex Mining over Clean Water Act ViolationsPollution Adjudication Board fines Philex Mining over Clean Water Act Violations
Pollution Adjudication Board fines Philex Mining over Clean Water Act ViolationsNo to mining in Palawan
 
Draft Minerals Law (New) Mongolia December 5-2012
Draft  Minerals  Law (New) Mongolia December 5-2012Draft  Minerals  Law (New) Mongolia December 5-2012
Draft Minerals Law (New) Mongolia December 5-2012No to mining in Palawan
 

Más de No to mining in Palawan (20)

Philippine_ EITI_ Report_Volume_I_Contextual_Information_Final
Philippine_ EITI_ Report_Volume_I_Contextual_Information_FinalPhilippine_ EITI_ Report_Volume_I_Contextual_Information_Final
Philippine_ EITI_ Report_Volume_I_Contextual_Information_Final
 
Philippine _EITI_ Report_Volume_II_Reconciliation_Report_Final
Philippine _EITI_ Report_Volume_II_Reconciliation_Report_FinalPhilippine _EITI_ Report_Volume_II_Reconciliation_Report_Final
Philippine _EITI_ Report_Volume_II_Reconciliation_Report_Final
 
Philippine_EITI_Annexes_ Volume I_Contextual_Information
Philippine_EITI_Annexes_ Volume I_Contextual_InformationPhilippine_EITI_Annexes_ Volume I_Contextual_Information
Philippine_EITI_Annexes_ Volume I_Contextual_Information
 
Mining Presentation-11142014
Mining Presentation-11142014Mining Presentation-11142014
Mining Presentation-11142014
 
Cetim cetim's statements at the un
Cetim   cetim's statements at the unCetim   cetim's statements at the un
Cetim cetim's statements at the un
 
Speech by Julian Payne, President, Canadian Chamber of Commerce of the Philip...
Speech by Julian Payne, President, Canadian Chamber of Commerce of the Philip...Speech by Julian Payne, President, Canadian Chamber of Commerce of the Philip...
Speech by Julian Payne, President, Canadian Chamber of Commerce of the Philip...
 
Mining Arangkada-3rd-Anniversary-Assesment
Mining Arangkada-3rd-Anniversary-AssesmentMining Arangkada-3rd-Anniversary-Assesment
Mining Arangkada-3rd-Anniversary-Assesment
 
Philippine Metallic Mining December 2013
Philippine Metallic Mining December 2013Philippine Metallic Mining December 2013
Philippine Metallic Mining December 2013
 
Study Tampakan HRIA
Study Tampakan HRIAStudy Tampakan HRIA
Study Tampakan HRIA
 
Intex Breach of Duty to Publicly Disclose Information
Intex Breach of Duty to Publicly Disclose InformationIntex Breach of Duty to Publicly Disclose Information
Intex Breach of Duty to Publicly Disclose Information
 
Philippine Mining Production Export Figures
Philippine Mining Production Export FiguresPhilippine Mining Production Export Figures
Philippine Mining Production Export Figures
 
Position Paper on Philex Mining Spill
Position Paper on Philex Mining SpillPosition Paper on Philex Mining Spill
Position Paper on Philex Mining Spill
 
CSM Summary Senate Hearing March 19 2013
CSM Summary Senate Hearing March 19 2013CSM Summary Senate Hearing March 19 2013
CSM Summary Senate Hearing March 19 2013
 
Philex Padcal Mine PAB Resolution
Philex Padcal Mine PAB ResolutionPhilex Padcal Mine PAB Resolution
Philex Padcal Mine PAB Resolution
 
Mining Arangkada Assessment_2013
Mining  Arangkada Assessment_2013Mining  Arangkada Assessment_2013
Mining Arangkada Assessment_2013
 
Mining Survey 2012-2013
Mining Survey 2012-2013Mining Survey 2012-2013
Mining Survey 2012-2013
 
Ochoa Tampakan Decision
Ochoa Tampakan DecisionOchoa Tampakan Decision
Ochoa Tampakan Decision
 
Macventures MPSA 016_93_XIII
Macventures MPSA 016_93_XIIIMacventures MPSA 016_93_XIII
Macventures MPSA 016_93_XIII
 
Pollution Adjudication Board fines Philex Mining over Clean Water Act Violations
Pollution Adjudication Board fines Philex Mining over Clean Water Act ViolationsPollution Adjudication Board fines Philex Mining over Clean Water Act Violations
Pollution Adjudication Board fines Philex Mining over Clean Water Act Violations
 
Draft Minerals Law (New) Mongolia December 5-2012
Draft  Minerals  Law (New) Mongolia December 5-2012Draft  Minerals  Law (New) Mongolia December 5-2012
Draft Minerals Law (New) Mongolia December 5-2012
 

Último

Difference Between Search & Browse Methods in Odoo 17
Difference Between Search & Browse Methods in Odoo 17Difference Between Search & Browse Methods in Odoo 17
Difference Between Search & Browse Methods in Odoo 17Celine George
 
Incoming and Outgoing Shipments in 3 STEPS Using Odoo 17
Incoming and Outgoing Shipments in 3 STEPS Using Odoo 17Incoming and Outgoing Shipments in 3 STEPS Using Odoo 17
Incoming and Outgoing Shipments in 3 STEPS Using Odoo 17Celine George
 
Field Attribute Index Feature in Odoo 17
Field Attribute Index Feature in Odoo 17Field Attribute Index Feature in Odoo 17
Field Attribute Index Feature in Odoo 17Celine George
 
Science 7 Quarter 4 Module 2: Natural Resources.pptx
Science 7 Quarter 4 Module 2: Natural Resources.pptxScience 7 Quarter 4 Module 2: Natural Resources.pptx
Science 7 Quarter 4 Module 2: Natural Resources.pptxMaryGraceBautista27
 
4.18.24 Movement Legacies, Reflection, and Review.pptx
4.18.24 Movement Legacies, Reflection, and Review.pptx4.18.24 Movement Legacies, Reflection, and Review.pptx
4.18.24 Movement Legacies, Reflection, and Review.pptxmary850239
 
Proudly South Africa powerpoint Thorisha.pptx
Proudly South Africa powerpoint Thorisha.pptxProudly South Africa powerpoint Thorisha.pptx
Proudly South Africa powerpoint Thorisha.pptxthorishapillay1
 
How to do quick user assign in kanban in Odoo 17 ERP
How to do quick user assign in kanban in Odoo 17 ERPHow to do quick user assign in kanban in Odoo 17 ERP
How to do quick user assign in kanban in Odoo 17 ERPCeline George
 
FILIPINO PSYCHology sikolohiyang pilipino
FILIPINO PSYCHology sikolohiyang pilipinoFILIPINO PSYCHology sikolohiyang pilipino
FILIPINO PSYCHology sikolohiyang pilipinojohnmickonozaleda
 
Barangay Council for the Protection of Children (BCPC) Orientation.pptx
Barangay Council for the Protection of Children (BCPC) Orientation.pptxBarangay Council for the Protection of Children (BCPC) Orientation.pptx
Barangay Council for the Protection of Children (BCPC) Orientation.pptxCarlos105
 
Like-prefer-love -hate+verb+ing & silent letters & citizenship text.pdf
Like-prefer-love -hate+verb+ing & silent letters & citizenship text.pdfLike-prefer-love -hate+verb+ing & silent letters & citizenship text.pdf
Like-prefer-love -hate+verb+ing & silent letters & citizenship text.pdfMr Bounab Samir
 
Influencing policy (training slides from Fast Track Impact)
Influencing policy (training slides from Fast Track Impact)Influencing policy (training slides from Fast Track Impact)
Influencing policy (training slides from Fast Track Impact)Mark Reed
 
ENGLISH6-Q4-W3.pptxqurter our high choom
ENGLISH6-Q4-W3.pptxqurter our high choomENGLISH6-Q4-W3.pptxqurter our high choom
ENGLISH6-Q4-W3.pptxqurter our high choomnelietumpap1
 
INTRODUCTION TO CATHOLIC CHRISTOLOGY.pptx
INTRODUCTION TO CATHOLIC CHRISTOLOGY.pptxINTRODUCTION TO CATHOLIC CHRISTOLOGY.pptx
INTRODUCTION TO CATHOLIC CHRISTOLOGY.pptxHumphrey A Beña
 
MULTIDISCIPLINRY NATURE OF THE ENVIRONMENTAL STUDIES.pptx
MULTIDISCIPLINRY NATURE OF THE ENVIRONMENTAL STUDIES.pptxMULTIDISCIPLINRY NATURE OF THE ENVIRONMENTAL STUDIES.pptx
MULTIDISCIPLINRY NATURE OF THE ENVIRONMENTAL STUDIES.pptxAnupkumar Sharma
 
Earth Day Presentation wow hello nice great
Earth Day Presentation wow hello nice greatEarth Day Presentation wow hello nice great
Earth Day Presentation wow hello nice greatYousafMalik24
 
Culture Uniformity or Diversity IN SOCIOLOGY.pptx
Culture Uniformity or Diversity IN SOCIOLOGY.pptxCulture Uniformity or Diversity IN SOCIOLOGY.pptx
Culture Uniformity or Diversity IN SOCIOLOGY.pptxPoojaSen20
 

Último (20)

Difference Between Search & Browse Methods in Odoo 17
Difference Between Search & Browse Methods in Odoo 17Difference Between Search & Browse Methods in Odoo 17
Difference Between Search & Browse Methods in Odoo 17
 
Incoming and Outgoing Shipments in 3 STEPS Using Odoo 17
Incoming and Outgoing Shipments in 3 STEPS Using Odoo 17Incoming and Outgoing Shipments in 3 STEPS Using Odoo 17
Incoming and Outgoing Shipments in 3 STEPS Using Odoo 17
 
FINALS_OF_LEFT_ON_C'N_EL_DORADO_2024.pptx
FINALS_OF_LEFT_ON_C'N_EL_DORADO_2024.pptxFINALS_OF_LEFT_ON_C'N_EL_DORADO_2024.pptx
FINALS_OF_LEFT_ON_C'N_EL_DORADO_2024.pptx
 
Field Attribute Index Feature in Odoo 17
Field Attribute Index Feature in Odoo 17Field Attribute Index Feature in Odoo 17
Field Attribute Index Feature in Odoo 17
 
Science 7 Quarter 4 Module 2: Natural Resources.pptx
Science 7 Quarter 4 Module 2: Natural Resources.pptxScience 7 Quarter 4 Module 2: Natural Resources.pptx
Science 7 Quarter 4 Module 2: Natural Resources.pptx
 
4.18.24 Movement Legacies, Reflection, and Review.pptx
4.18.24 Movement Legacies, Reflection, and Review.pptx4.18.24 Movement Legacies, Reflection, and Review.pptx
4.18.24 Movement Legacies, Reflection, and Review.pptx
 
Proudly South Africa powerpoint Thorisha.pptx
Proudly South Africa powerpoint Thorisha.pptxProudly South Africa powerpoint Thorisha.pptx
Proudly South Africa powerpoint Thorisha.pptx
 
How to do quick user assign in kanban in Odoo 17 ERP
How to do quick user assign in kanban in Odoo 17 ERPHow to do quick user assign in kanban in Odoo 17 ERP
How to do quick user assign in kanban in Odoo 17 ERP
 
FILIPINO PSYCHology sikolohiyang pilipino
FILIPINO PSYCHology sikolohiyang pilipinoFILIPINO PSYCHology sikolohiyang pilipino
FILIPINO PSYCHology sikolohiyang pilipino
 
Barangay Council for the Protection of Children (BCPC) Orientation.pptx
Barangay Council for the Protection of Children (BCPC) Orientation.pptxBarangay Council for the Protection of Children (BCPC) Orientation.pptx
Barangay Council for the Protection of Children (BCPC) Orientation.pptx
 
Like-prefer-love -hate+verb+ing & silent letters & citizenship text.pdf
Like-prefer-love -hate+verb+ing & silent letters & citizenship text.pdfLike-prefer-love -hate+verb+ing & silent letters & citizenship text.pdf
Like-prefer-love -hate+verb+ing & silent letters & citizenship text.pdf
 
Influencing policy (training slides from Fast Track Impact)
Influencing policy (training slides from Fast Track Impact)Influencing policy (training slides from Fast Track Impact)
Influencing policy (training slides from Fast Track Impact)
 
ENGLISH6-Q4-W3.pptxqurter our high choom
ENGLISH6-Q4-W3.pptxqurter our high choomENGLISH6-Q4-W3.pptxqurter our high choom
ENGLISH6-Q4-W3.pptxqurter our high choom
 
YOUVE_GOT_EMAIL_PRELIMS_EL_DORADO_2024.pptx
YOUVE_GOT_EMAIL_PRELIMS_EL_DORADO_2024.pptxYOUVE_GOT_EMAIL_PRELIMS_EL_DORADO_2024.pptx
YOUVE_GOT_EMAIL_PRELIMS_EL_DORADO_2024.pptx
 
YOUVE GOT EMAIL_FINALS_EL_DORADO_2024.pptx
YOUVE GOT EMAIL_FINALS_EL_DORADO_2024.pptxYOUVE GOT EMAIL_FINALS_EL_DORADO_2024.pptx
YOUVE GOT EMAIL_FINALS_EL_DORADO_2024.pptx
 
INTRODUCTION TO CATHOLIC CHRISTOLOGY.pptx
INTRODUCTION TO CATHOLIC CHRISTOLOGY.pptxINTRODUCTION TO CATHOLIC CHRISTOLOGY.pptx
INTRODUCTION TO CATHOLIC CHRISTOLOGY.pptx
 
MULTIDISCIPLINRY NATURE OF THE ENVIRONMENTAL STUDIES.pptx
MULTIDISCIPLINRY NATURE OF THE ENVIRONMENTAL STUDIES.pptxMULTIDISCIPLINRY NATURE OF THE ENVIRONMENTAL STUDIES.pptx
MULTIDISCIPLINRY NATURE OF THE ENVIRONMENTAL STUDIES.pptx
 
Model Call Girl in Tilak Nagar Delhi reach out to us at 🔝9953056974🔝
Model Call Girl in Tilak Nagar Delhi reach out to us at 🔝9953056974🔝Model Call Girl in Tilak Nagar Delhi reach out to us at 🔝9953056974🔝
Model Call Girl in Tilak Nagar Delhi reach out to us at 🔝9953056974🔝
 
Earth Day Presentation wow hello nice great
Earth Day Presentation wow hello nice greatEarth Day Presentation wow hello nice great
Earth Day Presentation wow hello nice great
 
Culture Uniformity or Diversity IN SOCIOLOGY.pptx
Culture Uniformity or Diversity IN SOCIOLOGY.pptxCulture Uniformity or Diversity IN SOCIOLOGY.pptx
Culture Uniformity or Diversity IN SOCIOLOGY.pptx
 

Historical Mineral Industry Statistics

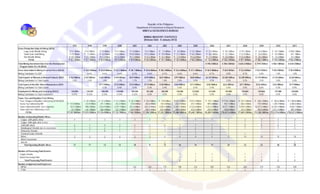
  • 1. Republic of the Philippines Department of Environment & Natural Resources MINES & GEOSCIENCES BUREAU MINING INDUSTRY STATISTICS (Release Date: 8 January 2013) 1997 1998 1999 2000 2001 2002 2003 2004 2005 2006 2007 2008 2009 2010 2011 Gross Production Value In Mining (MGB) Large Scale Metallic Mining P 9.1 Billion P 9.0 Billion P 7.6 Billion P 9.2 Billion P 7.8 Billion P 6.7 Billion P 7.5 Billion P 8.0 Billion P 13.2 Billion P 27.0 Billion P 49.2 Billion P 29.7 Billion P 42.8 Billion P 69.1 Billion P 88.0 Billion Small Scale Gold Mining P 4.5 Billion P 7.6 Billion P 6.0 Billion P 8.3 Billion P10.0 Billion P14.3 Billion P 19.9 Billion P 21.5 Billion P 24.2 Billion P 28.2 Billion P 32.2 Billion P 33.9 Billion P 36.8 Billion P 42.9 Billion 34.1 Billion Non-Metallic Mining P 19.5 Billion P 21.1 Billion P17.3 Billion P13.5 Billion P11.2 Billion P 14.2 Billion P 13.7 Billion P 13.9 Billion P12,8 Billion P 17.0 Billion P 20.8 Billion P 23.5 Billion P 26.5 Billion P 33.3 Billion 41.1 Billion TOTAL P 33.1 Billion P 37.7 Billion P 30.9 Billion P31.0 Billion P 29.0 Billion P 35.2 Billion P 41.1 Billion P 43.4 Billion P 50.2 Billion P 72.2 Billion P 102.2 Billion P 87.1 Billion P 106.1 Billion P 145.3 Billion P163.2 Billion Total Mining Investment Data from the Revitalization $ 190.3 Million $ 708.4 Million $ 604.2 Million $ 719.5 Million $ 968.3 Million $ 618.5 Million Program Under EO 270 (MGB) Gross Value Added In Mining At Current Prices (NSCB) P 24.9 Billion P 21.0 Billion P 22.2 Billion P 20.7 Billion P 25.8 Billion P 30.3 Billion P 32.6 Billion P 37.1 Billion P 43.9 Billion P 60.0 Billion P 53.6 Billion P 65.8 Billion P 88.2 Billion P 96.9 Billion Mining Contribution To GDP 0.8% 0.6% 0.6% 0.5% 0.6% 0.7% 0.6% 0.6% 0.7% 0.9% 0.7% 0.8% 1.0% 1.0% Total Exports of Minerals & Mineral Products (BSP) $ 762 Million $ 592 Million $ 645 Million $ 649 Million $537 Million $519 Million $637 Million $797 Million $820 Million $2,103 Million $2,605 Million $2,498 Million $1,470 Million $1,929 Million $2,659 Million Mining Contribution To Total Exports 3.0% 2.0% 1.8% 1.7% 1.7% 1.5% 1.8% 2.0% 2.0% 4.5% 5.3% 5.2% 3.9% 3.8% 5.6% Total Exports of Non-Met. Mineral Manufactures (BSP) $111 Million $133 Million $123 Million $113 Million $128 Million $165 Million $171 Million $182 Million $223 Million $211 Million $156 Million $162 Million $177 Million Mining Contribution To Total Exports 0.3% 0.4% 0.4% 0.3% 0.4% 0.4% 0.4% 0.4% 0.4% 0.4% 0.4% 0.3% 0.4% Employment In Mining and Quarrying (DOLE) 130,000 120,000 100,000 110,000 104,000 101,000 104,000 118,000 123,000 141,000 149,000 158,000 169,000 197,000 210,000 Mining Contribution To Total Employment 0.47% 0.43% 0.34% 0.34% 0.32% 0.3% 0.3% 0.3% 0.4% 0.4% 0.4% 0.5% 0.5% 0.5% 0.6% Taxes, Fees and Royalties From Mining Fees, Charges & Royalties Collected by DENR-MGB P 34.9 Million P 37.5 Million P 51.2 Million P 66.3 Million P 58.5 Million P 79.8 Million P120.1 Million P210.2 Million P 192.1 Million P 774.0 Million P 557.4 Million P 396.2 Million P 800.6 Million P 1,180.8 Million Excise Tax Collected by BIR P 114.8 Million 123.9 Million 241.1 Million 243.3 Million 129.8 Million 303.6 Million 155.8 Million 232.5 Million 251.4 Million 489.6 Million 942.1 Million 660.3 Million 718.8 Million 1,305.9 Million 6,985.8 Million Taxes Collected by Nat'l. Gov't. Agencies 921.5 Million 798.6 Million 1,016.9 Million 1,279.1 Million 647.6 Million 823..8 Million 1,039.2 Million 2,769.1 Million 4,733.6 Million 5,313.2 Million 8,371.7 Million 5,949.5 Million 10,272.5 Million 10,201.9 Million 9,463.7 Million Taxes and Fees Collected by LGUs 70.7 Million 116.7 Million 180.9 Million 152.1 Million 138.4 Million 204.8 Million 226.9 Million 358.5 Million 453.5 Million 395.0 Million 359.8 Million 522.2 Million 992.8 Million 1,071.2 Million 897.0 Million TOTAL P1,107.0Million P1,074.1Million P1,476.4Million P1,725.7Million P 982.1Million P1,390.7Million P1,501.7Million P3,480.2Million P5,648.7 Million P6,389.9 Million P10,447.6 Million P7,689.4 Million P12,380.3Million P13,379.6 Million P18,527.2 Million Number of Operating Metallic Mines: Copper (with gold & silver) 4 3 3 3 3 1 1 1 1 1 1 2 3 3 3 Copper (with gold, silver & zinc) 1 1 1 1 1 Gold (with silver) 6 7 5 3 2 2 6 7 7 7 7 8 8 8 5 Metallurgical Chromite (ore & concentrate) 3 3 2 1 1 1 1 2 2 2 2 1 1 1 2 Refractory Chromite 1 1 0 1 1 1 1 1 1 1 1 Chemical Grade Chromite 1 1 1 1 1 1 Nickel 3 3 3 4 3 3 4 4 4 5 11 10 10 15 18 Nickel Concentrate Iron ore 1 1 Total Operating Metallic Mines 17 17 13 12 10 9 14 16 16 17 24 23 23 28 30 Number of Processing Plant/Smelter: Copper Smelter 1 1 1 1 1 1 1 1 Nickel Processing Plant 1 1 1 1 1 1 1 1 Total Processing Plant/Smelter 2 2 2 2 2 2 2 2 Number of Approved and Registered MPSA 162 164 175 198 216 209 236 264 275 318 339 FTAA 2 2 2 2 2 2 2 2 3 6 6
  • 2. 1997 1998 1999 2000 2001 2002 2003 2004 2005 2006 2007 2008 2009 2010 2011 EP 9 13 16 13 28 33 44 39 54 99 113 IP 109 104 101 103 120 161 185 199 213 202 192 MPP 7 26 26 37 41 41 54 68 TOTAL 282 283 294 323 392 431 504 545 586 679 718 Number of Applications Under Process MPSA 1,578 1,529 1,374 1,337 1,403 1,318 1,111 1,058 997 839 605 FTAA 43 42 41 40 56 56 54 52 52 49 21 EP 380 374 348 366 474 720 1,074 1,496 1,575 1,545 823 IP 346 372 310 302 251 266 288 291 288 294 242 MPP 31 40 37 36 40 42 44 37 TOTAL 2347 2317 2073 2,076 2,224 2,397 2,563 2,937 2,954 2,771 1,728 Average world price of Copper (WMS/LME) $ 1.03 / lb. $ 0.75 / lb $ 0.71 / lb $0.82 / lb $0.72 / lb $0.71 / lb $0.81 / lb $1.30 / lb $1.58 / lb $3.02 / lb $3.20 / lb $3.16 / lb $2.28 / lb $3.40 / lb $4.00 / lb* Average world price of Gold (WMS/BSP) $ 331 / oz $ 293 / oz $ 279.04 / oz $ 279.28 / oz $271.10 / oz $310.20 / oz $363.38 / oz $409.23 / oz $431.35 / oz $600.71 / oz $696.37 / oz $871.52 / oz $973.01 / oz $1,222.02 / oz $1,570.25 / oz* Average world price of Silver (WMS/BSP) $ 4.90 / oz $5.51 / oz $ 5.22 / oz $ 4.95 / oz $4.37 / oz $4.60 / oz $4.87 / oz $6.63 / oz $7.04 / oz $11.55 / oz $13.38 / oz $15.00 / oz $14.67 / oz $20.13 / oz $35.22 / oz* Average world price of Nickel (WMS/LME) $ 3.14 / lb $ 2.10 / lb $ 2.73 / lb $ 3.92 / lb $2.70 / lb $3.07 / lb $4.37 / lb $6.27 / lb $7.00 / lb $10.88 / lb $16.84 / lb $9.58 / lb $6.56 / lb $9.82 / lb $10.39 / lb* Peso to US Dollar Exchange Rate (BSP) P 29.47 / $ P 40.90 / $ P 39.08 / $ P 44.19 / $ P 50.99 P51.62 P54.26 P56.09 P55.02 P51.32 P46.15 P44.48 P47.64 P45.11 P43.31 +Preliminary; nda - no data available; nya - not yet available Note: Number of operating mines were based on production reports submitted. Gross Value Added (GVA) - measures the contribution of a particular sector to the country's GNP; computed by subtracting the cost of production inputs from the gross output of a particular industry. Total GVA does not include crude oil. ref: MIS(1997-present)/econ-ind summary/rvs/8Jan2013