SlideShare una empresa de Scribd logo
1 de 9
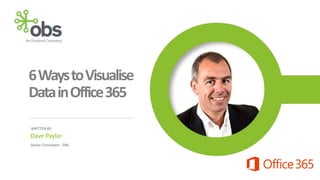
6Ways to Visualise
Data in Office 365
WRITTEN BY:

Dave Paylor
Senior Consultant - OBS
Visualise your business data using Office 365
Data visualisation is the presentation of complex data to a business
audience to provide valuable insight. In this presentation Dave will
discuss 6 tools that can be used to create charts and other visualisations
on Office 365.
He has detailed their strengths, weaknesses, use scenarios and licensing
implications.
Power BI

XSLT

Excel Services

Display Templates

Visio Services

jQuery
1. Power BI
The term Power BI is relatively new, it refers Microsoft‘s
new generation of BI tools. PowerView is one of the
elements and has been available for a few years now. It
enables dynamic, interactive visualisations which are
easily created and consumed by business users. It’s
probably one of the most useful of the Power BI suite.
Other elements of Power BI, such as Power Map and
Power Query, are tremendous tools for situational
visualisation. You can experience Power BI in Excel
2013 and Office 365 (as of the 11th of Feb 2014).

Office 365 Compatible



Example: Activation data for

SharePoint 2013 Compatible



SharePoint 2010 Compatible



Enterprise licence of SQL



Enterprise licence of SharePoint



Marine Rescue allowing analysis by
squadron and cause including
geospatial representation of
locations

Powerful, dynamic user
interface
Little or no customisation
2. Excel Services
If you have content or data in Excel that you would like
presented via SharePoint, then Excel Services is a great way to
visualise it as charts, graphs, etc. on selected pages. The Excel
Web Access web part allows you to connect to an Excel file
which is located in SharePoint and surface selected
elements, such as a chart, onto the page. The users who see the
chart do not need to have Excel installed.
The Excel REST API is one of the best kept secrets of SharePoint
and it is certainly one of the most powerful. The look and feel of
a chart is managed in Excel and the chart is returned as an image
which can be embedded anywhere in SharePoint
Dave’s Fav
Office 365 Compatible



SharePoint 2013 Compatible



SharePoint 2010 Compatible



Enterprise licence of SQL



Enterprise licence of SharePoint



Example: Country Manager using
Excel to set targets for states and
changing chart template with actual
data coming from a SharePoint list
entered by regional managers

Easy to use
REST charts are not
interactive
3. Visio Services
Visio objects can be connected to data, including
SharePoint lists. This means that the content of a Visio
diagram can dynamically change based on the incoming
data. The Visio Web Part connects to a Visio file in
SharePoint and presents this interactive visualisation of
data which will dynamically change as the source data is
updated. The API allows further customisation of the
way it interacts with other content on the page resulting
in a very powerful way to visualise information.

Office 365 Compatible



SharePoint 2013 Compatible



SharePoint 2010 Compatible



Enterprise licence of SQL



Enterprise licence of SharePoint



Example: Seating plan linked to
people search so clicking from search
shows where the person sits and
clicking on the desk shows who is
there

JavaScript API allows for
powerful interaction
Files grow quickly with a lot
of objects
4. XSLT
XSLT is commonly used to present bar charts, but other
visualisations, such as status indicators and colourcoding can also easily be achieved. It’s ability is only
limited to what can be achieved with HTML.
With minimal training, content authors can easily apply
pre-prepared XSLT to their views via the XSL link with
web part settings, although one wouldn’t expect
business users to create their own XSLT.

Office 365 Compatible



SharePoint 2013 Compatible



SharePoint 2010 Compatible



Enterprise licence of SQL



Enterprise licence of SharePoint



Example: Apply an XSL template to
a risk register in a SharePoint list to
represent the content in an ISO
31000 risk matrix

Server-side processing
Needs knowledge to create
XSL templates
5. Display Templates
Display Templates are still relatively new, they were
introduced with the launch SharePoint 2013, but the
possibilities they offer are very exciting. In many cases,
Display Templates have the potential to replace XSLT for
simple visualisation techniques such as indicators and
colour-coding.
Tool with great potential!

Office 365 Compatible



SharePoint 2013 Compatible



SharePoint 2010 Compatible



Enterprise licence of SQL



Enterprise licence of SharePoint



Example: Apply a display template
to a list of projects and convert a
choice field value to a KPI indicator
to produce a simple project
dashboard

Can effect a single field of a
view
Care needed with multiple
views on the same page
6. jQuery
There are a number of jQuery plug-ins that offer some
great visualisation capabilities. A couple of examples are
jqPlot and Amcharts. These require some technical
configuration, but it is all client-side and can produce
some great results for your efforts.
Amcharts is based on jQuery so also offers extensive
animations which may be a little gimmicky but can also
really bring a chart to life.

Office 365 Compatible



SharePoint 2013 Compatible



SharePoint 2010 Compatible



Enterprise licence of SQL



Enterprise licence of SharePoint



Example: Absenteeism summaries
held in a SharePoint list and
presented as a chart using jQuery

JavaScript API allows for
powerful interaction
Files grow quickly with a lot
of objects
Contact Dave if you
have any questions.
WRITTEN BY:

Dave Paylor
Senior Consultant - OBS
E: dave.paylor@obs.com.au
L: http://au.linkedin.com/in/paylord

OBS:

Más contenido relacionado

La actualidad más candente

Intuit quick books enterprise 12
Intuit quick books enterprise 12Intuit quick books enterprise 12
Intuit quick books enterprise 12Ahmed Yasir Khan
 
SYBIS - Power BI
SYBIS - Power BI SYBIS - Power BI
SYBIS - Power BI Iman Ef
 
Affordable Business Intelligence (BI) Tool
Affordable Business Intelligence (BI) ToolAffordable Business Intelligence (BI) Tool
Affordable Business Intelligence (BI) ToolAnswergen
 
bi tutorial - Right bi tool for the business
bi tutorial - Right bi tool for the business bi tutorial - Right bi tool for the business
bi tutorial - Right bi tool for the business Mondy Holten
 
BI in the Cloud - Microsoft Power BI Overview and Demo
BI in the Cloud - Microsoft Power BI Overview and DemoBI in the Cloud - Microsoft Power BI Overview and Demo
BI in the Cloud - Microsoft Power BI Overview and DemoChristopher Foot
 
SPS Brno 2017 - PowerApps & Microsoft Flow: Advanced scenarios
SPS Brno 2017 - PowerApps & Microsoft Flow: Advanced scenariosSPS Brno 2017 - PowerApps & Microsoft Flow: Advanced scenarios
SPS Brno 2017 - PowerApps & Microsoft Flow: Advanced scenariosAhmad Najjar
 
Power BI Online Training hyderabad | Power BI online Course
Power BI Online Training hyderabad   | Power BI online Course Power BI Online Training hyderabad   | Power BI online Course
Power BI Online Training hyderabad | Power BI online Course Cynix Technologies
 
Power BI Secrets
Power BI SecretsPower BI Secrets
Power BI SecretsDoug Burke
 
Learn How to Use Microsoft Power BI for Office 365 to Analyze Salesforce Data
Learn How to Use Microsoft Power BI for Office 365 to Analyze Salesforce DataLearn How to Use Microsoft Power BI for Office 365 to Analyze Salesforce Data
Learn How to Use Microsoft Power BI for Office 365 to Analyze Salesforce DataNetwoven Inc.
 
Supercharge your app with Power BI Embedded analytics
Supercharge your app with Power BI Embedded analyticsSupercharge your app with Power BI Embedded analytics
Supercharge your app with Power BI Embedded analyticsMicrosoft Tech Community
 
Microsoft power platform
Microsoft power platform Microsoft power platform
Microsoft power platform AYUSHISHARMA295
 
Microsoft Power BI | Brief Introduction | PPT
Microsoft Power BI | Brief Introduction | PPTMicrosoft Power BI | Brief Introduction | PPT
Microsoft Power BI | Brief Introduction | PPTSophia Smith
 
Microsoft Power BI Demo
Microsoft Power BI DemoMicrosoft Power BI Demo
Microsoft Power BI DemoJames Riley
 
Power BI - Business Intelligence Getting Started Guide - PREVIEW
Power BI - Business Intelligence Getting Started Guide - PREVIEWPower BI - Business Intelligence Getting Started Guide - PREVIEW
Power BI - Business Intelligence Getting Started Guide - PREVIEWDavid J Rosenthal
 
Power BI Zero to Hero by Rajat Jaiswal
Power BI Zero to Hero by Rajat JaiswalPower BI Zero to Hero by Rajat Jaiswal
Power BI Zero to Hero by Rajat JaiswalIndiandotnet
 

La actualidad más candente (20)

Power bi components
Power bi components Power bi components
Power bi components
 
Intuit quick books enterprise 12
Intuit quick books enterprise 12Intuit quick books enterprise 12
Intuit quick books enterprise 12
 
SYBIS - Power BI
SYBIS - Power BI SYBIS - Power BI
SYBIS - Power BI
 
Affordable Business Intelligence (BI) Tool
Affordable Business Intelligence (BI) ToolAffordable Business Intelligence (BI) Tool
Affordable Business Intelligence (BI) Tool
 
bi tutorial - Right bi tool for the business
bi tutorial - Right bi tool for the business bi tutorial - Right bi tool for the business
bi tutorial - Right bi tool for the business
 
Power Bi Basics
Power Bi BasicsPower Bi Basics
Power Bi Basics
 
BI in the Cloud - Microsoft Power BI Overview and Demo
BI in the Cloud - Microsoft Power BI Overview and DemoBI in the Cloud - Microsoft Power BI Overview and Demo
BI in the Cloud - Microsoft Power BI Overview and Demo
 
SPS Brno 2017 - PowerApps & Microsoft Flow: Advanced scenarios
SPS Brno 2017 - PowerApps & Microsoft Flow: Advanced scenariosSPS Brno 2017 - PowerApps & Microsoft Flow: Advanced scenarios
SPS Brno 2017 - PowerApps & Microsoft Flow: Advanced scenarios
 
Power BI Online Training hyderabad | Power BI online Course
Power BI Online Training hyderabad   | Power BI online Course Power BI Online Training hyderabad   | Power BI online Course
Power BI Online Training hyderabad | Power BI online Course
 
Power bi
Power biPower bi
Power bi
 
Power BI Secrets
Power BI SecretsPower BI Secrets
Power BI Secrets
 
Learn How to Use Microsoft Power BI for Office 365 to Analyze Salesforce Data
Learn How to Use Microsoft Power BI for Office 365 to Analyze Salesforce DataLearn How to Use Microsoft Power BI for Office 365 to Analyze Salesforce Data
Learn How to Use Microsoft Power BI for Office 365 to Analyze Salesforce Data
 
Supercharge your app with Power BI Embedded analytics
Supercharge your app with Power BI Embedded analyticsSupercharge your app with Power BI Embedded analytics
Supercharge your app with Power BI Embedded analytics
 
Microsoft power platform
Microsoft power platform Microsoft power platform
Microsoft power platform
 
Microsoft Power BI | Brief Introduction | PPT
Microsoft Power BI | Brief Introduction | PPTMicrosoft Power BI | Brief Introduction | PPT
Microsoft Power BI | Brief Introduction | PPT
 
Microsoft Power BI Demo
Microsoft Power BI DemoMicrosoft Power BI Demo
Microsoft Power BI Demo
 
Sap BusinessObjects 4
Sap BusinessObjects 4Sap BusinessObjects 4
Sap BusinessObjects 4
 
Power BI - Business Intelligence Getting Started Guide - PREVIEW
Power BI - Business Intelligence Getting Started Guide - PREVIEWPower BI - Business Intelligence Getting Started Guide - PREVIEW
Power BI - Business Intelligence Getting Started Guide - PREVIEW
 
Power Up with Power BI
Power Up with Power BIPower Up with Power BI
Power Up with Power BI
 
Power BI Zero to Hero by Rajat Jaiswal
Power BI Zero to Hero by Rajat JaiswalPower BI Zero to Hero by Rajat Jaiswal
Power BI Zero to Hero by Rajat Jaiswal
 

Similar a 6 Ways To Visualise Data In Office 365

Primer on Power BI 201501
Primer on Power BI 201501Primer on Power BI 201501
Primer on Power BI 201501Mark Tabladillo
 
Business Intelligence in SharePoint 2013
Business Intelligence in SharePoint 2013Business Intelligence in SharePoint 2013
Business Intelligence in SharePoint 2013Jason Himmelstein
 
LIBA++Lecture+Notes_Power+BI.docx.pdf
LIBA++Lecture+Notes_Power+BI.docx.pdfLIBA++Lecture+Notes_Power+BI.docx.pdf
LIBA++Lecture+Notes_Power+BI.docx.pdfDivya Thakur
 
Microsoft Power Stack 2019 [Power BI, Excel, Azure & Friends]
Microsoft Power Stack 2019 [Power BI, Excel, Azure & Friends]Microsoft Power Stack 2019 [Power BI, Excel, Azure & Friends]
Microsoft Power Stack 2019 [Power BI, Excel, Azure & Friends]Olivier Travers
 
SharePoint Connections Coast to Coast Business Intelligence Solutions with Sh...
SharePoint Connections Coast to Coast Business Intelligence Solutions with Sh...SharePoint Connections Coast to Coast Business Intelligence Solutions with Sh...
SharePoint Connections Coast to Coast Business Intelligence Solutions with Sh...Ivan Sanders
 
Summary of all tools and microsoft power bi
Summary of all tools and microsoft power biSummary of all tools and microsoft power bi
Summary of all tools and microsoft power biOmar Khan
 
Microsoft BI Tool Overview and Comparison
Microsoft BI Tool Overview and ComparisonMicrosoft BI Tool Overview and Comparison
Microsoft BI Tool Overview and ComparisonSenturus
 
SharePoint Saturday Sacramento Business Intelligence with SharePoint 2010
SharePoint Saturday Sacramento  Business Intelligence with SharePoint 2010SharePoint Saturday Sacramento  Business Intelligence with SharePoint 2010
SharePoint Saturday Sacramento Business Intelligence with SharePoint 2010Ivan Sanders
 
Making Smarter Business Decisions with Power BI
Making Smarter Business Decisions with Power BIMaking Smarter Business Decisions with Power BI
Making Smarter Business Decisions with Power BIAvtex
 
See Beyond the Numbers: Data Visualization in SharePoint 2010
See Beyond the Numbers: Data Visualization in SharePoint 2010See Beyond the Numbers: Data Visualization in SharePoint 2010
See Beyond the Numbers: Data Visualization in SharePoint 2010Sadalit Van Buren
 
Gerald Pryor Bi Portfolio
Gerald Pryor Bi PortfolioGerald Pryor Bi Portfolio
Gerald Pryor Bi Portfoliogppryor1
 

Similar a 6 Ways To Visualise Data In Office 365 (20)

Business intelligence
Business intelligenceBusiness intelligence
Business intelligence
 
Power BI in Office 365
Power BI in Office 365Power BI in Office 365
Power BI in Office 365
 
Primer on Power BI 201501
Primer on Power BI 201501Primer on Power BI 201501
Primer on Power BI 201501
 
Business Intelligence in SharePoint 2013
Business Intelligence in SharePoint 2013Business Intelligence in SharePoint 2013
Business Intelligence in SharePoint 2013
 
Power BI
Power BIPower BI
Power BI
 
LIBA++Lecture+Notes_Power+BI.docx.pdf
LIBA++Lecture+Notes_Power+BI.docx.pdfLIBA++Lecture+Notes_Power+BI.docx.pdf
LIBA++Lecture+Notes_Power+BI.docx.pdf
 
Microsoft Power Stack 2019 [Power BI, Excel, Azure & Friends]
Microsoft Power Stack 2019 [Power BI, Excel, Azure & Friends]Microsoft Power Stack 2019 [Power BI, Excel, Azure & Friends]
Microsoft Power Stack 2019 [Power BI, Excel, Azure & Friends]
 
SharePoint Connections Coast to Coast Business Intelligence Solutions with Sh...
SharePoint Connections Coast to Coast Business Intelligence Solutions with Sh...SharePoint Connections Coast to Coast Business Intelligence Solutions with Sh...
SharePoint Connections Coast to Coast Business Intelligence Solutions with Sh...
 
Summary of all tools and microsoft power bi
Summary of all tools and microsoft power biSummary of all tools and microsoft power bi
Summary of all tools and microsoft power bi
 
Microsoft BI Tool Overview and Comparison
Microsoft BI Tool Overview and ComparisonMicrosoft BI Tool Overview and Comparison
Microsoft BI Tool Overview and Comparison
 
Power bi overview
Power bi overview Power bi overview
Power bi overview
 
SharePoint Saturday Sacramento Business Intelligence with SharePoint 2010
SharePoint Saturday Sacramento  Business Intelligence with SharePoint 2010SharePoint Saturday Sacramento  Business Intelligence with SharePoint 2010
SharePoint Saturday Sacramento Business Intelligence with SharePoint 2010
 
Making Smarter Business Decisions with Power BI
Making Smarter Business Decisions with Power BIMaking Smarter Business Decisions with Power BI
Making Smarter Business Decisions with Power BI
 
See Beyond the Numbers: Data Visualization in SharePoint 2010
See Beyond the Numbers: Data Visualization in SharePoint 2010See Beyond the Numbers: Data Visualization in SharePoint 2010
See Beyond the Numbers: Data Visualization in SharePoint 2010
 
See Beyond the Numbers: Data Visualization in SharePoint
See Beyond the Numbers: Data Visualization in SharePointSee Beyond the Numbers: Data Visualization in SharePoint
See Beyond the Numbers: Data Visualization in SharePoint
 
Business Intelligence for SharePoint
Business Intelligence for SharePointBusiness Intelligence for SharePoint
Business Intelligence for SharePoint
 
Portfolio
PortfolioPortfolio
Portfolio
 
Portfolio
PortfolioPortfolio
Portfolio
 
Gerald Pryor Bi Portfolio
Gerald Pryor Bi PortfolioGerald Pryor Bi Portfolio
Gerald Pryor Bi Portfolio
 
Boston Area SharePoint User Group BI Data Visualization
Boston Area SharePoint User Group BI Data VisualizationBoston Area SharePoint User Group BI Data Visualization
Boston Area SharePoint User Group BI Data Visualization
 

Último

Technical Leaders - Working with the Management Team
Technical Leaders - Working with the Management TeamTechnical Leaders - Working with the Management Team
Technical Leaders - Working with the Management TeamArik Fletcher
 
Effective Strategies for Maximizing Your Profit When Selling Gold Jewelry
Effective Strategies for Maximizing Your Profit When Selling Gold JewelryEffective Strategies for Maximizing Your Profit When Selling Gold Jewelry
Effective Strategies for Maximizing Your Profit When Selling Gold JewelryWhittensFineJewelry1
 
NAB Show Exhibitor List 2024 - Exhibitors Data
NAB Show Exhibitor List 2024 - Exhibitors DataNAB Show Exhibitor List 2024 - Exhibitors Data
NAB Show Exhibitor List 2024 - Exhibitors DataExhibitors Data
 
Church Building Grants To Assist With New Construction, Additions, And Restor...
Church Building Grants To Assist With New Construction, Additions, And Restor...Church Building Grants To Assist With New Construction, Additions, And Restor...
Church Building Grants To Assist With New Construction, Additions, And Restor...Americas Got Grants
 
Horngren’s Financial & Managerial Accounting, 7th edition by Miller-Nobles so...
Horngren’s Financial & Managerial Accounting, 7th edition by Miller-Nobles so...Horngren’s Financial & Managerial Accounting, 7th edition by Miller-Nobles so...
Horngren’s Financial & Managerial Accounting, 7th edition by Miller-Nobles so...ssuserf63bd7
 
1911 Gold Corporate Presentation Apr 2024.pdf
1911 Gold Corporate Presentation Apr 2024.pdf1911 Gold Corporate Presentation Apr 2024.pdf
1911 Gold Corporate Presentation Apr 2024.pdfShaun Heinrichs
 
Planetary and Vedic Yagyas Bring Positive Impacts in Life
Planetary and Vedic Yagyas Bring Positive Impacts in LifePlanetary and Vedic Yagyas Bring Positive Impacts in Life
Planetary and Vedic Yagyas Bring Positive Impacts in LifeBhavana Pujan Kendra
 
Appkodes Tinder Clone Script with Customisable Solutions.pptx
Appkodes Tinder Clone Script with Customisable Solutions.pptxAppkodes Tinder Clone Script with Customisable Solutions.pptx
Appkodes Tinder Clone Script with Customisable Solutions.pptxappkodes
 
Cybersecurity Awareness Training Presentation v2024.03
Cybersecurity Awareness Training Presentation v2024.03Cybersecurity Awareness Training Presentation v2024.03
Cybersecurity Awareness Training Presentation v2024.03DallasHaselhorst
 
The-Ethical-issues-ghhhhhhhhjof-Byjus.pptx
The-Ethical-issues-ghhhhhhhhjof-Byjus.pptxThe-Ethical-issues-ghhhhhhhhjof-Byjus.pptx
The-Ethical-issues-ghhhhhhhhjof-Byjus.pptxmbikashkanyari
 
How Generative AI Is Transforming Your Business | Byond Growth Insights | Apr...
How Generative AI Is Transforming Your Business | Byond Growth Insights | Apr...How Generative AI Is Transforming Your Business | Byond Growth Insights | Apr...
How Generative AI Is Transforming Your Business | Byond Growth Insights | Apr...Hector Del Castillo, CPM, CPMM
 
EUDR Info Meeting Ethiopian coffee exporters
EUDR Info Meeting Ethiopian coffee exportersEUDR Info Meeting Ethiopian coffee exporters
EUDR Info Meeting Ethiopian coffee exportersPeter Horsten
 
TriStar Gold Corporate Presentation - April 2024
TriStar Gold Corporate Presentation - April 2024TriStar Gold Corporate Presentation - April 2024
TriStar Gold Corporate Presentation - April 2024Adnet Communications
 
Healthcare Feb. & Mar. Healthcare Newsletter
Healthcare Feb. & Mar. Healthcare NewsletterHealthcare Feb. & Mar. Healthcare Newsletter
Healthcare Feb. & Mar. Healthcare NewsletterJamesConcepcion7
 
business environment micro environment macro environment.pptx
business environment micro environment macro environment.pptxbusiness environment micro environment macro environment.pptx
business environment micro environment macro environment.pptxShruti Mittal
 
Onemonitar Android Spy App Features: Explore Advanced Monitoring Capabilities
Onemonitar Android Spy App Features: Explore Advanced Monitoring CapabilitiesOnemonitar Android Spy App Features: Explore Advanced Monitoring Capabilities
Onemonitar Android Spy App Features: Explore Advanced Monitoring CapabilitiesOne Monitar
 
digital marketing , introduction of digital marketing
digital marketing , introduction of digital marketingdigital marketing , introduction of digital marketing
digital marketing , introduction of digital marketingrajputmeenakshi733
 
20200128 Ethical by Design - Whitepaper.pdf
20200128 Ethical by Design - Whitepaper.pdf20200128 Ethical by Design - Whitepaper.pdf
20200128 Ethical by Design - Whitepaper.pdfChris Skinner
 
WSMM Technology February.March Newsletter_vF.pdf
WSMM Technology February.March Newsletter_vF.pdfWSMM Technology February.March Newsletter_vF.pdf
WSMM Technology February.March Newsletter_vF.pdfJamesConcepcion7
 
Entrepreneurship lessons in Philippines
Entrepreneurship lessons in  PhilippinesEntrepreneurship lessons in  Philippines
Entrepreneurship lessons in PhilippinesDavidSamuel525586
 

Último (20)

Technical Leaders - Working with the Management Team
Technical Leaders - Working with the Management TeamTechnical Leaders - Working with the Management Team
Technical Leaders - Working with the Management Team
 
Effective Strategies for Maximizing Your Profit When Selling Gold Jewelry
Effective Strategies for Maximizing Your Profit When Selling Gold JewelryEffective Strategies for Maximizing Your Profit When Selling Gold Jewelry
Effective Strategies for Maximizing Your Profit When Selling Gold Jewelry
 
NAB Show Exhibitor List 2024 - Exhibitors Data
NAB Show Exhibitor List 2024 - Exhibitors DataNAB Show Exhibitor List 2024 - Exhibitors Data
NAB Show Exhibitor List 2024 - Exhibitors Data
 
Church Building Grants To Assist With New Construction, Additions, And Restor...
Church Building Grants To Assist With New Construction, Additions, And Restor...Church Building Grants To Assist With New Construction, Additions, And Restor...
Church Building Grants To Assist With New Construction, Additions, And Restor...
 
Horngren’s Financial & Managerial Accounting, 7th edition by Miller-Nobles so...
Horngren’s Financial & Managerial Accounting, 7th edition by Miller-Nobles so...Horngren’s Financial & Managerial Accounting, 7th edition by Miller-Nobles so...
Horngren’s Financial & Managerial Accounting, 7th edition by Miller-Nobles so...
 
1911 Gold Corporate Presentation Apr 2024.pdf
1911 Gold Corporate Presentation Apr 2024.pdf1911 Gold Corporate Presentation Apr 2024.pdf
1911 Gold Corporate Presentation Apr 2024.pdf
 
Planetary and Vedic Yagyas Bring Positive Impacts in Life
Planetary and Vedic Yagyas Bring Positive Impacts in LifePlanetary and Vedic Yagyas Bring Positive Impacts in Life
Planetary and Vedic Yagyas Bring Positive Impacts in Life
 
Appkodes Tinder Clone Script with Customisable Solutions.pptx
Appkodes Tinder Clone Script with Customisable Solutions.pptxAppkodes Tinder Clone Script with Customisable Solutions.pptx
Appkodes Tinder Clone Script with Customisable Solutions.pptx
 
Cybersecurity Awareness Training Presentation v2024.03
Cybersecurity Awareness Training Presentation v2024.03Cybersecurity Awareness Training Presentation v2024.03
Cybersecurity Awareness Training Presentation v2024.03
 
The-Ethical-issues-ghhhhhhhhjof-Byjus.pptx
The-Ethical-issues-ghhhhhhhhjof-Byjus.pptxThe-Ethical-issues-ghhhhhhhhjof-Byjus.pptx
The-Ethical-issues-ghhhhhhhhjof-Byjus.pptx
 
How Generative AI Is Transforming Your Business | Byond Growth Insights | Apr...
How Generative AI Is Transforming Your Business | Byond Growth Insights | Apr...How Generative AI Is Transforming Your Business | Byond Growth Insights | Apr...
How Generative AI Is Transforming Your Business | Byond Growth Insights | Apr...
 
EUDR Info Meeting Ethiopian coffee exporters
EUDR Info Meeting Ethiopian coffee exportersEUDR Info Meeting Ethiopian coffee exporters
EUDR Info Meeting Ethiopian coffee exporters
 
TriStar Gold Corporate Presentation - April 2024
TriStar Gold Corporate Presentation - April 2024TriStar Gold Corporate Presentation - April 2024
TriStar Gold Corporate Presentation - April 2024
 
Healthcare Feb. & Mar. Healthcare Newsletter
Healthcare Feb. & Mar. Healthcare NewsletterHealthcare Feb. & Mar. Healthcare Newsletter
Healthcare Feb. & Mar. Healthcare Newsletter
 
business environment micro environment macro environment.pptx
business environment micro environment macro environment.pptxbusiness environment micro environment macro environment.pptx
business environment micro environment macro environment.pptx
 
Onemonitar Android Spy App Features: Explore Advanced Monitoring Capabilities
Onemonitar Android Spy App Features: Explore Advanced Monitoring CapabilitiesOnemonitar Android Spy App Features: Explore Advanced Monitoring Capabilities
Onemonitar Android Spy App Features: Explore Advanced Monitoring Capabilities
 
digital marketing , introduction of digital marketing
digital marketing , introduction of digital marketingdigital marketing , introduction of digital marketing
digital marketing , introduction of digital marketing
 
20200128 Ethical by Design - Whitepaper.pdf
20200128 Ethical by Design - Whitepaper.pdf20200128 Ethical by Design - Whitepaper.pdf
20200128 Ethical by Design - Whitepaper.pdf
 
WSMM Technology February.March Newsletter_vF.pdf
WSMM Technology February.March Newsletter_vF.pdfWSMM Technology February.March Newsletter_vF.pdf
WSMM Technology February.March Newsletter_vF.pdf
 
Entrepreneurship lessons in Philippines
Entrepreneurship lessons in  PhilippinesEntrepreneurship lessons in  Philippines
Entrepreneurship lessons in Philippines
 

6 Ways To Visualise Data In Office 365

  • 1. 6Ways to Visualise Data in Office 365 WRITTEN BY: Dave Paylor Senior Consultant - OBS
  • 2. Visualise your business data using Office 365 Data visualisation is the presentation of complex data to a business audience to provide valuable insight. In this presentation Dave will discuss 6 tools that can be used to create charts and other visualisations on Office 365. He has detailed their strengths, weaknesses, use scenarios and licensing implications. Power BI XSLT Excel Services Display Templates Visio Services jQuery
  • 3. 1. Power BI The term Power BI is relatively new, it refers Microsoft‘s new generation of BI tools. PowerView is one of the elements and has been available for a few years now. It enables dynamic, interactive visualisations which are easily created and consumed by business users. It’s probably one of the most useful of the Power BI suite. Other elements of Power BI, such as Power Map and Power Query, are tremendous tools for situational visualisation. You can experience Power BI in Excel 2013 and Office 365 (as of the 11th of Feb 2014). Office 365 Compatible  Example: Activation data for SharePoint 2013 Compatible  SharePoint 2010 Compatible  Enterprise licence of SQL  Enterprise licence of SharePoint  Marine Rescue allowing analysis by squadron and cause including geospatial representation of locations Powerful, dynamic user interface Little or no customisation
  • 4. 2. Excel Services If you have content or data in Excel that you would like presented via SharePoint, then Excel Services is a great way to visualise it as charts, graphs, etc. on selected pages. The Excel Web Access web part allows you to connect to an Excel file which is located in SharePoint and surface selected elements, such as a chart, onto the page. The users who see the chart do not need to have Excel installed. The Excel REST API is one of the best kept secrets of SharePoint and it is certainly one of the most powerful. The look and feel of a chart is managed in Excel and the chart is returned as an image which can be embedded anywhere in SharePoint Dave’s Fav Office 365 Compatible  SharePoint 2013 Compatible  SharePoint 2010 Compatible  Enterprise licence of SQL  Enterprise licence of SharePoint  Example: Country Manager using Excel to set targets for states and changing chart template with actual data coming from a SharePoint list entered by regional managers Easy to use REST charts are not interactive
  • 5. 3. Visio Services Visio objects can be connected to data, including SharePoint lists. This means that the content of a Visio diagram can dynamically change based on the incoming data. The Visio Web Part connects to a Visio file in SharePoint and presents this interactive visualisation of data which will dynamically change as the source data is updated. The API allows further customisation of the way it interacts with other content on the page resulting in a very powerful way to visualise information. Office 365 Compatible  SharePoint 2013 Compatible  SharePoint 2010 Compatible  Enterprise licence of SQL  Enterprise licence of SharePoint  Example: Seating plan linked to people search so clicking from search shows where the person sits and clicking on the desk shows who is there JavaScript API allows for powerful interaction Files grow quickly with a lot of objects
  • 6. 4. XSLT XSLT is commonly used to present bar charts, but other visualisations, such as status indicators and colourcoding can also easily be achieved. It’s ability is only limited to what can be achieved with HTML. With minimal training, content authors can easily apply pre-prepared XSLT to their views via the XSL link with web part settings, although one wouldn’t expect business users to create their own XSLT. Office 365 Compatible  SharePoint 2013 Compatible  SharePoint 2010 Compatible  Enterprise licence of SQL  Enterprise licence of SharePoint  Example: Apply an XSL template to a risk register in a SharePoint list to represent the content in an ISO 31000 risk matrix Server-side processing Needs knowledge to create XSL templates
  • 7. 5. Display Templates Display Templates are still relatively new, they were introduced with the launch SharePoint 2013, but the possibilities they offer are very exciting. In many cases, Display Templates have the potential to replace XSLT for simple visualisation techniques such as indicators and colour-coding. Tool with great potential! Office 365 Compatible  SharePoint 2013 Compatible  SharePoint 2010 Compatible  Enterprise licence of SQL  Enterprise licence of SharePoint  Example: Apply a display template to a list of projects and convert a choice field value to a KPI indicator to produce a simple project dashboard Can effect a single field of a view Care needed with multiple views on the same page
  • 8. 6. jQuery There are a number of jQuery plug-ins that offer some great visualisation capabilities. A couple of examples are jqPlot and Amcharts. These require some technical configuration, but it is all client-side and can produce some great results for your efforts. Amcharts is based on jQuery so also offers extensive animations which may be a little gimmicky but can also really bring a chart to life. Office 365 Compatible  SharePoint 2013 Compatible  SharePoint 2010 Compatible  Enterprise licence of SQL  Enterprise licence of SharePoint  Example: Absenteeism summaries held in a SharePoint list and presented as a chart using jQuery JavaScript API allows for powerful interaction Files grow quickly with a lot of objects
  • 9. Contact Dave if you have any questions. WRITTEN BY: Dave Paylor Senior Consultant - OBS E: dave.paylor@obs.com.au L: http://au.linkedin.com/in/paylord OBS: