SlideShare una empresa de Scribd logo
1 de 18
Familiarize yourselfwith the interface
When you first open Microsoft Mathematics, you’ll see the following elements displayed:
1. The Calculator Pad which includes a number pad and the following button groups:
Statistics, Trigonometry, Linear Algebra, Calculus, Standard, and Favorite Buttons.
2. The Worksheet tab is displayed by default, and is where you will do most of your numerical
computing. This tab includes both an input and output pane. The input pane gives you the
option of using the graphing calculator, keyboard or ink input. When you click buttons on the
calculator pad, you construct a mathematical expression in the keyboard input pane.
3. The Graphing tab can be used to create most mathematical graphs. This tab includes an
input pane to enter the function equation, inequality, data sets, or parametric equations that
you want to plot.
4. Math Tools : On the Home tab, in the Tools group, you'll see buttons for additional math
tools:
 Equation Solver to solve a single equation or a system of equations.
 Formulas and Equations to find frequently used equations from science and math, and
explore them graphically or by solving for a particular variable.
 Triangle Solver to find the measures of the remaining sides and angles of a triangle
when some sides and angles are known.
 Unit Conversion Tool to convert measurements in one system of units to another.
Microsoft® Mathematics for Educators
Step-by-Step
1 2 3 4
Using the GraphingCalculator
The primary tool in Microsoft Mathematics is a full-featured scientific calculator with extensive
graphing and equation-solving capabilities.
You can use it just like a handheld calculator by clicking buttons, or you can use your keyboard
to type the mathematical expressions that you want the calculator to evaluate.
Solve an equation:
Our sample problem is to find the area of a walkway that surrounds a rectangular swimming
pool. The pool measures 9 meters by 15 meters, and the walkway is 2 meters wide.
Using the buttons on the calculator
1. Calculate the area of the pool and walkway by clicking the following calculator buttons.
Use parentheses to group calculations appropriately:
2. Calculate the area of just the pool:
3. Subtract the area of the pool from the area of the pool and walkway:
Using the Inking Capabilities:
With Microsoft Mathematics users can input an equation or fraction using the improved ink input
capabilities. Users can write mathematical expressions in the Ink input pane using the pen from
a Tablet PC or an ultra-mobile PC. You can also use a mouse. Ink input is available on both the
Worksheet and Graphing tabs.
1. On the Home tab, Select the Ink option in the Input tab
2. In the Ink input area draw the following fraction using your pen from your Tablet PC, or
your mouse if you have a laptop
3. Hit Enter
Solving EquationsStep-by-Step
Microsoft Mathematics provides step-by-step solutions to many types of problems, from
simplification of algebraic expressions to solving systems of equations. If a step-by-step solution
is available for an expression, you will see the heading "Solution steps" between the input and
output expressions in the output pane.
1. Using the Equation from above- 2x/4=2
2. Hit Enter
3. You’ll see the equation is solved in the Output Pane
4. Click on Solution steps
5. You’ll see the completed Step-by-step solution for the equation in the Output pane
If a step-by-step solution is available for an expression, you will see the heading
"Solution steps" between the input and output expressions in the output pane
regardless if you enter the expression using the calculator, keyboard, or ink input
option
How To Create a Graph
How to Create a Graph
To create most mathematical graphs, you use the Graphing tab. The Graphing tab includes an
input pane that you use to enter the function, equation, inequality, data set, or parametric
equation that you want to plot. To work with the graph after you plot it, the Graphing tab also
includes a pane that describes what is plotted in the graph, and a graph pane that displays the
graph.
General steps for plotting a graph
1. Click the Graphing tab.
2. Expand the appropriate input pane: Equations & Functions, Equations, Data Sets,
Parametric, or Inequalities.
3. In the Dimensions list, click 2D or 3D.
4. In the Coordinates list, click Cartesian, Polar, Spherical, or Cylindrical.
5. Enter the expression or data you want to plot.
6. Click Graph
Plotting 2D Graphs
Plot a Line
You can plot any line by using Microsoft Mathematics. The simplest way is to put the equation of
the line into slope-intercept form and plot the right side of the equation as a function of y. You
can plot any form of the line as an equation, and you can also plot two data points and draw the
resulting line.
Sample Equation: y = (2/3) x + 3
Plot a line as a function of y
1. Click the Graphing tab.
2. Expand Equations & Functions.
3. In the first input box, enter y= (2/3) x +3.
4. Click Enter
5. Click Graph and see results
Plot an equation or function in 2D Cartesiancoordinates
Plot an equation or function in 2D Cartesian coordinates
To plot one equation or function
Sample Equation: r=sin (ntheta)
1. Click the Graphing tab.
2. Expand Equations & Functions.
3. In the Dimensions list, click 2D.
4. Select Polar.
5. Click in the first box.
6. In the Input box that appears, type: sin(ntheta), and then click Enter.
7. Click Graph.
To plot multiple equations or functions follow the same steps as above, but add
another equation to the second box. If you want to add a third equation or function,
click Add, and then enter the equation or function in the new box that appears.
Animate a graph
When you create a graph that involves unknown parameters, such as the graph of y = sin(ax),
Microsoft Mathematics initially picks an arbitrary value for the unknown parameter a and draws
the graph using that value. After the graph is created, however, you can change the value of a
and animate the graph by using a range of values for the unknown parameter. What you see
during the animation is a series of graphs, each drawn with a slightly different value of the
unknown parameter. If your graph involves multiple unknown parameters, you can choose
which parameter to animate. You can also set the values of some parameters to specific values
while you animate another.
To animate a graph
1. On the Graphing tab, expand Graph Controls
2. In the Parameter list, parameter that you want to animate.
3. In the Lower Bound box, enter a lower bound for the parameter. The default is 0.
4. In the Upper Bound box, enter an upper bound for the parameter. The default is 2. (You
can enter an upper bound that is smaller than the lower bound. In this case, Microsoft
Mathematics animates from the larger value to the smaller.)
5. Click
About 3D Surface Graphs
A 3D surface graph is a way to represent three-dimensional data in two dimensions. In
its simplest form, it shows a function of two variables x and y as a "carpet", with the
height of the carpet at any point (x,y) equal to the value of the function at that point. You
can create more complicated surfaces, such as spheres and tori, as the graphs of
equations in three variables.
You can create 3D surface graphs of a function of two variables: as graphs of equations
in three variables, or as graphs of three parametric equations.
You can display 3D surface graphs in two ways.
1. The default is to show a colored surface, where the color is based on the angle
each point of the surface makes with each of several differently colored light
sources.
2. You can also show the surface as a wireframe (also called a mesh or grid), which
shows the surface as made up of lines). You have probably seen similar graphs
in documentaries that show the making of a computer-animated film.
A color surface graph.
A wireframe graph.
If you right-click and move your mouse along the boundaries, you'll see the
plane and it's intersection in the graph. This action is possible if Direct3D is
installed and enabled for 3D graphing.
Plot One Equation or Function
Sample Equation: r=3theta-phi
1. Click the Graphing tab.
2. Expand Equations & Functions.
3. In the Dimensions list, click 3D.
4. Click in the first box.
5. In the Input box that appears, Type an equation or function definition, 3theta-phi, and
then click Enter.
6. Click Graph.
Rotate a 3D Graph
When you view a 3D surface graph, as when you view a 3D object in real life, part of the graph
is hidden from view. To see all of the features of the graph, you need to view the graph from
different angles.
To rotate a graph
1. On the Graphing Tools tab, in the Display group, click the axis around which you want
to rotate the graph in the Rotate list.
2. Click Counterclockwise or Clockwise. When you rotate a graph by using one of these
buttons, the graph continues to rotate until you click the button again.
To rotate a graph in any direction, hold your left-mouse key down, and drag the
graph in the direction you want the graph to rotate. To put the graph into motion,
hold your left mouse key down, drag the graph and release
Math Tools
Microsoft Mathematics includes a number of tools to perform specific types of calculations. On
the Home tab, in the Tools group, there are buttons for the following tools:
 Equation Solver
You can use the Equation Solver to solve one or more equations simultaneously. The
Equation Solver allows you to enter a single equation or system of equations, and then
the solution is displayed in the Microsoft Mathematics Worksheet.
 Formulas and Equations
You can use Formulas and Equations library to find many common formulas, constants,
and equations from a variety of mathematical and scientific disciplines, including
algebra, geometry, chemistry, and physics. You can click an equation to plot it or solve it
for a particular variable.
 Triangle Solver
You can use the Triangle Solver to enter known side and angle data for a triangle and
calculate the remaining sides and angles.
 Unit Converter
You can use the Unit Converter to convert data from one set of units to another.
Use the Equation Solver
The Equation Solver provides an easy way to enter a single equation or system of equations
that you want to solve. The solution to the equation or system is displayed in the Worksheet.
To use the Equation Solver
1. On the Home tab, in the Tools group, click Equation Solver.
2. In the list at the top of the Equation Solver, click the number of equations you want to
solve.
3. Type an equation in each of the boxes provided.
Note: Do not press Enter on the keyboard before you enter all of the equations.
4. Click Solve.
Example
1. Click Solve a system of 2 equations.
2. In the box labeled Equation 1, type the following:
3x - 4y = 2
3. In the box labeled Equation 2, type the following:
5x + 2y = 7
4. Click Solve.
Use Formulas and Equations
Microsoft Mathematics includes a library of formulas and equations that contains many common
equations and formulas from mathematics, physics, and chemistry. You can use Formulas and
Equations as a resource when you work on your homework assignments. For example, you can
copy the equations from the library into the Worksheet and then plot the equations, or solve
them for any particular variable. In Formulas and Equations, you can find everything from the
quadratic formula, to the formula for the area of a triangle, to the equation for the force of
gravity.
To solve an equation
1. On the Home tab, in the Tools group, click Formulas and Equations, and then click
the type of equations you want to view.
2. The Formulas and Equations list appears. Select one of the subjects, ranging from
Algebra, Geometry, Trigonometry, Physics, Chemistry, Law of Exponents, Properties of
Logarithms, or Constants.
3. Right-click one of the equation, and then click Solve this equation. Input boxes for
each parameter and variable of the equation appear at the bottom of Formulas and
Equations.
4. Enter values in all but one of the input boxes.
5. Click Enter. The equation is solved for the remaining variable or parameter and shown
in the Worksheet.
Use the Triangle Solver
The Triangle Solver helps you explore triangles and the relationships among their many parts.
To use the Triangle Solver
1. On the Home tab, in the Tools group, click Triangle Solver.
2. The Triangle Solver appears.
3. In the Show list, click the information you want to see:
o Rules used to calculate shows the theorems and axioms used to calculate
unknown side and angle measures from the known side and angle measures you
enter.
o Triangle type identifies the type of triangle based on the information you
entered.
o Altitudes and area shows the three altitudes and area of the triangle
4. Enter known side and angle measures in the boxes provided.
5. Click Calculate.
Use the Unit Converter
The Unit Converter helps you convert measurements from one unit of measurement to another.
To use the Unit Conversion Tool
1. On the Home tab, in the Tools group, click Unit Converter.
The Unit Converter appears.
2. In the Convert list, click the type of measurement you are converting (example: length).
3. In the From list, click the unit you are converting from. (example: feet)
4. In the To list, click the unit you are converting to. (example: meters)
5. In the Input box, enter the measurement you are converting.
6. Click Calculate.
The Weight/Mass category in the Unit Conversion Tool offers conversion
between English units of weight, such as pounds, to metric units such as
kilograms. However, some authorities insist that pounds should be converted
to newtons, the metric unit of force, and that kilograms should be converted to
slugs, the English unit of mass. These conversions are possible using the Force and Mass
categories of the tool. The conversions in the Weight/Mass category are used by such
authorities as the U.S. National Institute of Standards and Technology.

Más contenido relacionado

La actualidad más candente

Using tables in Microsoft Word
Using tables in Microsoft WordUsing tables in Microsoft Word
Using tables in Microsoft WordAngelaMcGaffin
 
Libre Office Calc Lesson 4: Understanding Functions
Libre Office Calc Lesson 4: Understanding FunctionsLibre Office Calc Lesson 4: Understanding Functions
Libre Office Calc Lesson 4: Understanding FunctionsSmart Chicago Collaborative
 
Creating graphs in excel
Creating graphs in excelCreating graphs in excel
Creating graphs in excelclynnc
 
Tutorial for chart design in MS Excel 2007
Tutorial for chart design in MS Excel 2007Tutorial for chart design in MS Excel 2007
Tutorial for chart design in MS Excel 2007slavicivan
 
50g working with matricies
50g  working with matricies50g  working with matricies
50g working with matriciesEfrain Parizaca
 
Calculating a correlation coefficient and scatter plot using excel
Calculating a correlation coefficient and scatter plot using excelCalculating a correlation coefficient and scatter plot using excel
Calculating a correlation coefficient and scatter plot using excelSandra Nicks
 
Microsoft Word: Working with Tables
Microsoft Word: Working with TablesMicrosoft Word: Working with Tables
Microsoft Word: Working with TablesTiffany Johnson
 
Making an xy scatter plot
Making an xy scatter plotMaking an xy scatter plot
Making an xy scatter plotilanasaxe
 
Excel 2007 create a chart
Excel 2007    create a chartExcel 2007    create a chart
Excel 2007 create a chartrezaulslide
 
Excel 2007 create a chart
Excel 2007    create a chartExcel 2007    create a chart
Excel 2007 create a chartkhankamrul
 
Libre Office Calc Lesson 1: Introduction to spreadsheets
Libre Office Calc Lesson 1: Introduction to spreadsheetsLibre Office Calc Lesson 1: Introduction to spreadsheets
Libre Office Calc Lesson 1: Introduction to spreadsheetsSmart Chicago Collaborative
 

La actualidad más candente (20)

Using tables in Microsoft Word
Using tables in Microsoft WordUsing tables in Microsoft Word
Using tables in Microsoft Word
 
Excel 2007 - Create a chart
Excel 2007 - Create a chartExcel 2007 - Create a chart
Excel 2007 - Create a chart
 
Libre Office Calc Lesson 4: Understanding Functions
Libre Office Calc Lesson 4: Understanding FunctionsLibre Office Calc Lesson 4: Understanding Functions
Libre Office Calc Lesson 4: Understanding Functions
 
Creating graphs in excel
Creating graphs in excelCreating graphs in excel
Creating graphs in excel
 
Introduction to mapinfo
Introduction to mapinfoIntroduction to mapinfo
Introduction to mapinfo
 
Tutorial for chart design in MS Excel 2007
Tutorial for chart design in MS Excel 2007Tutorial for chart design in MS Excel 2007
Tutorial for chart design in MS Excel 2007
 
04 ms excel
04 ms excel04 ms excel
04 ms excel
 
Excel.01
Excel.01Excel.01
Excel.01
 
50g working with matricies
50g  working with matricies50g  working with matricies
50g working with matricies
 
Calculating a correlation coefficient and scatter plot using excel
Calculating a correlation coefficient and scatter plot using excelCalculating a correlation coefficient and scatter plot using excel
Calculating a correlation coefficient and scatter plot using excel
 
Excel.01
Excel.01Excel.01
Excel.01
 
Microsoft Word: Working with Tables
Microsoft Word: Working with TablesMicrosoft Word: Working with Tables
Microsoft Word: Working with Tables
 
Making an xy scatter plot
Making an xy scatter plotMaking an xy scatter plot
Making an xy scatter plot
 
Geometry Softwares
Geometry SoftwaresGeometry Softwares
Geometry Softwares
 
Excel 2007 create a chart
Excel 2007    create a chartExcel 2007    create a chart
Excel 2007 create a chart
 
Excel 2007 create a chart
Excel 2007    create a chartExcel 2007    create a chart
Excel 2007 create a chart
 
Word Chapter 4
Word Chapter 4Word Chapter 4
Word Chapter 4
 
Excel for kids
Excel for kids Excel for kids
Excel for kids
 
Microsoft Excel 101
Microsoft Excel 101Microsoft Excel 101
Microsoft Excel 101
 
Libre Office Calc Lesson 1: Introduction to spreadsheets
Libre Office Calc Lesson 1: Introduction to spreadsheetsLibre Office Calc Lesson 1: Introduction to spreadsheets
Libre Office Calc Lesson 1: Introduction to spreadsheets
 

Destacado

Advanced math i & ii 6-18-2013
Advanced math i & ii 6-18-2013Advanced math i & ii 6-18-2013
Advanced math i & ii 6-18-2013SteveRVA
 
Mox6 owners manual part one
Mox6 owners manual part oneMox6 owners manual part one
Mox6 owners manual part oneppfrands
 
Aνανεώσιμοι φυσικοί και ενεργειακοί πόροι – εναλλακτικές μορφές ενέργειας στ...
Aνανεώσιμοι φυσικοί και ενεργειακοί  πόροι – εναλλακτικές μορφές ενέργειας στ...Aνανεώσιμοι φυσικοί και ενεργειακοί  πόροι – εναλλακτικές μορφές ενέργειας στ...
Aνανεώσιμοι φυσικοί και ενεργειακοί πόροι – εναλλακτικές μορφές ενέργειας στ...Loukia Orfanou
 
10 ways to nurture your spiritual life
10 ways to nurture your spiritual life10 ways to nurture your spiritual life
10 ways to nurture your spiritual lifeBASKARAN P
 
Manual curso taller adobe photoshop básico
Manual curso taller adobe photoshop básicoManual curso taller adobe photoshop básico
Manual curso taller adobe photoshop básicoMarco Antonio Jaén
 
Kunst&cultuur subsidies
Kunst&cultuur subsidiesKunst&cultuur subsidies
Kunst&cultuur subsidiesLejla Alic
 
Budget 2016 - what business wants to see
Budget 2016 - what business wants to seeBudget 2016 - what business wants to see
Budget 2016 - what business wants to seeGrant Thornton UK LLP
 
Confidentiality training
Confidentiality trainingConfidentiality training
Confidentiality trainingbaileesna
 
Step by step justin fijal
Step by step justin fijalStep by step justin fijal
Step by step justin fijaljfijal
 
Compositional rules
Compositional rulesCompositional rules
Compositional rulesbravozach
 
Compositional rules
Compositional rulesCompositional rules
Compositional rulesbravozach
 
Analiza de reclama: Widerøe - Grandpa's magic trick
Analiza de reclama: Widerøe - Grandpa's magic trickAnaliza de reclama: Widerøe - Grandpa's magic trick
Analiza de reclama: Widerøe - Grandpa's magic trickDiana Marcela
 

Destacado (20)

Advanced math i & ii 6-18-2013
Advanced math i & ii 6-18-2013Advanced math i & ii 6-18-2013
Advanced math i & ii 6-18-2013
 
Microsoft Mathematics
Microsoft MathematicsMicrosoft Mathematics
Microsoft Mathematics
 
Mugatzailea
MugatzaileaMugatzailea
Mugatzailea
 
Mox6 owners manual part one
Mox6 owners manual part oneMox6 owners manual part one
Mox6 owners manual part one
 
Birthday
BirthdayBirthday
Birthday
 
Aνανεώσιμοι φυσικοί και ενεργειακοί πόροι – εναλλακτικές μορφές ενέργειας στ...
Aνανεώσιμοι φυσικοί και ενεργειακοί  πόροι – εναλλακτικές μορφές ενέργειας στ...Aνανεώσιμοι φυσικοί και ενεργειακοί  πόροι – εναλλακτικές μορφές ενέργειας στ...
Aνανεώσιμοι φυσικοί και ενεργειακοί πόροι – εναλλακτικές μορφές ενέργειας στ...
 
10 ways to nurture your spiritual life
10 ways to nurture your spiritual life10 ways to nurture your spiritual life
10 ways to nurture your spiritual life
 
Religionincolonies
ReligionincoloniesReligionincolonies
Religionincolonies
 
Manual curso taller adobe photoshop básico
Manual curso taller adobe photoshop básicoManual curso taller adobe photoshop básico
Manual curso taller adobe photoshop básico
 
Kunst&cultuur subsidies
Kunst&cultuur subsidiesKunst&cultuur subsidies
Kunst&cultuur subsidies
 
Budget 2016 - what business wants to see
Budget 2016 - what business wants to seeBudget 2016 - what business wants to see
Budget 2016 - what business wants to see
 
Confidentiality training
Confidentiality trainingConfidentiality training
Confidentiality training
 
Neurologica
NeurologicaNeurologica
Neurologica
 
Step by step justin fijal
Step by step justin fijalStep by step justin fijal
Step by step justin fijal
 
Rhythm
RhythmRhythm
Rhythm
 
Compositional rules
Compositional rulesCompositional rules
Compositional rules
 
Thank you 2015
Thank you 2015Thank you 2015
Thank you 2015
 
Compositional rules
Compositional rulesCompositional rules
Compositional rules
 
Dancing Mood
Dancing MoodDancing Mood
Dancing Mood
 
Analiza de reclama: Widerøe - Grandpa's magic trick
Analiza de reclama: Widerøe - Grandpa's magic trickAnaliza de reclama: Widerøe - Grandpa's magic trick
Analiza de reclama: Widerøe - Grandpa's magic trick
 

Similar a Microsoft mathmatics step-by-step_guide

Creating an excel chart
Creating an excel chartCreating an excel chart
Creating an excel chartmeeker1987
 
Geometria analitica con geogebra secme 22589
Geometria analitica con geogebra secme 22589Geometria analitica con geogebra secme 22589
Geometria analitica con geogebra secme 22589EmilioEscalanteHerna
 
MAT 240 Random Sampling in Excel Tutorial This tutorial wi
MAT 240 Random Sampling in Excel Tutorial This tutorial wiMAT 240 Random Sampling in Excel Tutorial This tutorial wi
MAT 240 Random Sampling in Excel Tutorial This tutorial wiAbramMartino96
 
MAT 240 Random Sampling in Excel Tutorial This tutorial wi
MAT 240 Random Sampling in Excel Tutorial This tutorial wiMAT 240 Random Sampling in Excel Tutorial This tutorial wi
MAT 240 Random Sampling in Excel Tutorial This tutorial wiAbramMartino96
 
Basic Computer skill-P4 Excel.pptx
Basic Computer skill-P4 Excel.pptxBasic Computer skill-P4 Excel.pptx
Basic Computer skill-P4 Excel.pptxMastewal5
 
Curve fitting
Curve fittingCurve fitting
Curve fittingdusan4rs
 
How to make Gantt chart in Excel
How to make Gantt chart in ExcelHow to make Gantt chart in Excel
How to make Gantt chart in ExcelNavjyotsinh Jadeja
 
A Skills Approach Excel 2016 Chapter 7 Exploring Advanced C.docx
A Skills Approach Excel 2016  Chapter 7 Exploring Advanced C.docxA Skills Approach Excel 2016  Chapter 7 Exploring Advanced C.docx
A Skills Approach Excel 2016 Chapter 7 Exploring Advanced C.docxdaniahendric
 
MODULE 1 continuation .pptx
MODULE 1 continuation .pptxMODULE 1 continuation .pptx
MODULE 1 continuation .pptxsurekha1287
 
Using Applications in Windows - R.D.Sivakumar
Using Applications in Windows - R.D.SivakumarUsing Applications in Windows - R.D.Sivakumar
Using Applications in Windows - R.D.SivakumarSivakumar R D .
 
Smart sketchgettingstartedguide4
Smart sketchgettingstartedguide4Smart sketchgettingstartedguide4
Smart sketchgettingstartedguide4Fábio Junior
 

Similar a Microsoft mathmatics step-by-step_guide (20)

Mathcad
MathcadMathcad
Mathcad
 
Advanced excel
Advanced excelAdvanced excel
Advanced excel
 
Creating an excel chart
Creating an excel chartCreating an excel chart
Creating an excel chart
 
Geometria analitica con geogebra secme 22589
Geometria analitica con geogebra secme 22589Geometria analitica con geogebra secme 22589
Geometria analitica con geogebra secme 22589
 
Excel2002
Excel2002Excel2002
Excel2002
 
Ms excel ppt
Ms excel pptMs excel ppt
Ms excel ppt
 
MAT 240 Random Sampling in Excel Tutorial This tutorial wi
MAT 240 Random Sampling in Excel Tutorial This tutorial wiMAT 240 Random Sampling in Excel Tutorial This tutorial wi
MAT 240 Random Sampling in Excel Tutorial This tutorial wi
 
MAT 240 Random Sampling in Excel Tutorial This tutorial wi
MAT 240 Random Sampling in Excel Tutorial This tutorial wiMAT 240 Random Sampling in Excel Tutorial This tutorial wi
MAT 240 Random Sampling in Excel Tutorial This tutorial wi
 
ms_excel.pdf
ms_excel.pdfms_excel.pdf
ms_excel.pdf
 
Basic Computer skill-P4 Excel.pptx
Basic Computer skill-P4 Excel.pptxBasic Computer skill-P4 Excel.pptx
Basic Computer skill-P4 Excel.pptx
 
Curve fitting
Curve fittingCurve fitting
Curve fitting
 
How to make Gantt chart in Excel
How to make Gantt chart in ExcelHow to make Gantt chart in Excel
How to make Gantt chart in Excel
 
Excel booklet
Excel bookletExcel booklet
Excel booklet
 
07.bar and chats
07.bar and chats07.bar and chats
07.bar and chats
 
A Skills Approach Excel 2016 Chapter 7 Exploring Advanced C.docx
A Skills Approach Excel 2016  Chapter 7 Exploring Advanced C.docxA Skills Approach Excel 2016  Chapter 7 Exploring Advanced C.docx
A Skills Approach Excel 2016 Chapter 7 Exploring Advanced C.docx
 
Map Browser Training
Map Browser TrainingMap Browser Training
Map Browser Training
 
GeoGebra 3
GeoGebra 3GeoGebra 3
GeoGebra 3
 
MODULE 1 continuation .pptx
MODULE 1 continuation .pptxMODULE 1 continuation .pptx
MODULE 1 continuation .pptx
 
Using Applications in Windows - R.D.Sivakumar
Using Applications in Windows - R.D.SivakumarUsing Applications in Windows - R.D.Sivakumar
Using Applications in Windows - R.D.Sivakumar
 
Smart sketchgettingstartedguide4
Smart sketchgettingstartedguide4Smart sketchgettingstartedguide4
Smart sketchgettingstartedguide4
 

Último

call girls in Kamla Market (DELHI) 🔝 >༒9953330565🔝 genuine Escort Service 🔝✔️✔️
call girls in Kamla Market (DELHI) 🔝 >༒9953330565🔝 genuine Escort Service 🔝✔️✔️call girls in Kamla Market (DELHI) 🔝 >༒9953330565🔝 genuine Escort Service 🔝✔️✔️
call girls in Kamla Market (DELHI) 🔝 >༒9953330565🔝 genuine Escort Service 🔝✔️✔️9953056974 Low Rate Call Girls In Saket, Delhi NCR
 
4.16.24 21st Century Movements for Black Lives.pptx
4.16.24 21st Century Movements for Black Lives.pptx4.16.24 21st Century Movements for Black Lives.pptx
4.16.24 21st Century Movements for Black Lives.pptxmary850239
 
Visit to a blind student's school🧑‍🦯🧑‍🦯(community medicine)
Visit to a blind student's school🧑‍🦯🧑‍🦯(community medicine)Visit to a blind student's school🧑‍🦯🧑‍🦯(community medicine)
Visit to a blind student's school🧑‍🦯🧑‍🦯(community medicine)lakshayb543
 
AMERICAN LANGUAGE HUB_Level2_Student'sBook_Answerkey.pdf
AMERICAN LANGUAGE HUB_Level2_Student'sBook_Answerkey.pdfAMERICAN LANGUAGE HUB_Level2_Student'sBook_Answerkey.pdf
AMERICAN LANGUAGE HUB_Level2_Student'sBook_Answerkey.pdfphamnguyenenglishnb
 
ACC 2024 Chronicles. Cardiology. Exam.pdf
ACC 2024 Chronicles. Cardiology. Exam.pdfACC 2024 Chronicles. Cardiology. Exam.pdf
ACC 2024 Chronicles. Cardiology. Exam.pdfSpandanaRallapalli
 
ECONOMIC CONTEXT - PAPER 1 Q3: NEWSPAPERS.pptx
ECONOMIC CONTEXT - PAPER 1 Q3: NEWSPAPERS.pptxECONOMIC CONTEXT - PAPER 1 Q3: NEWSPAPERS.pptx
ECONOMIC CONTEXT - PAPER 1 Q3: NEWSPAPERS.pptxiammrhaywood
 
Inclusivity Essentials_ Creating Accessible Websites for Nonprofits .pdf
Inclusivity Essentials_ Creating Accessible Websites for Nonprofits .pdfInclusivity Essentials_ Creating Accessible Websites for Nonprofits .pdf
Inclusivity Essentials_ Creating Accessible Websites for Nonprofits .pdfTechSoup
 
MULTIDISCIPLINRY NATURE OF THE ENVIRONMENTAL STUDIES.pptx
MULTIDISCIPLINRY NATURE OF THE ENVIRONMENTAL STUDIES.pptxMULTIDISCIPLINRY NATURE OF THE ENVIRONMENTAL STUDIES.pptx
MULTIDISCIPLINRY NATURE OF THE ENVIRONMENTAL STUDIES.pptxAnupkumar Sharma
 
Earth Day Presentation wow hello nice great
Earth Day Presentation wow hello nice greatEarth Day Presentation wow hello nice great
Earth Day Presentation wow hello nice greatYousafMalik24
 
Proudly South Africa powerpoint Thorisha.pptx
Proudly South Africa powerpoint Thorisha.pptxProudly South Africa powerpoint Thorisha.pptx
Proudly South Africa powerpoint Thorisha.pptxthorishapillay1
 
Like-prefer-love -hate+verb+ing & silent letters & citizenship text.pdf
Like-prefer-love -hate+verb+ing & silent letters & citizenship text.pdfLike-prefer-love -hate+verb+ing & silent letters & citizenship text.pdf
Like-prefer-love -hate+verb+ing & silent letters & citizenship text.pdfMr Bounab Samir
 
Judging the Relevance and worth of ideas part 2.pptx
Judging the Relevance  and worth of ideas part 2.pptxJudging the Relevance  and worth of ideas part 2.pptx
Judging the Relevance and worth of ideas part 2.pptxSherlyMaeNeri
 
Grade 9 Quarter 4 Dll Grade 9 Quarter 4 DLL.pdf
Grade 9 Quarter 4 Dll Grade 9 Quarter 4 DLL.pdfGrade 9 Quarter 4 Dll Grade 9 Quarter 4 DLL.pdf
Grade 9 Quarter 4 Dll Grade 9 Quarter 4 DLL.pdfJemuel Francisco
 
Student Profile Sample - We help schools to connect the data they have, with ...
Student Profile Sample - We help schools to connect the data they have, with ...Student Profile Sample - We help schools to connect the data they have, with ...
Student Profile Sample - We help schools to connect the data they have, with ...Seán Kennedy
 
Science 7 Quarter 4 Module 2: Natural Resources.pptx
Science 7 Quarter 4 Module 2: Natural Resources.pptxScience 7 Quarter 4 Module 2: Natural Resources.pptx
Science 7 Quarter 4 Module 2: Natural Resources.pptxMaryGraceBautista27
 
ENGLISH 7_Q4_LESSON 2_ Employing a Variety of Strategies for Effective Interp...
ENGLISH 7_Q4_LESSON 2_ Employing a Variety of Strategies for Effective Interp...ENGLISH 7_Q4_LESSON 2_ Employing a Variety of Strategies for Effective Interp...
ENGLISH 7_Q4_LESSON 2_ Employing a Variety of Strategies for Effective Interp...JhezDiaz1
 
Incoming and Outgoing Shipments in 3 STEPS Using Odoo 17
Incoming and Outgoing Shipments in 3 STEPS Using Odoo 17Incoming and Outgoing Shipments in 3 STEPS Using Odoo 17
Incoming and Outgoing Shipments in 3 STEPS Using Odoo 17Celine George
 

Último (20)

call girls in Kamla Market (DELHI) 🔝 >༒9953330565🔝 genuine Escort Service 🔝✔️✔️
call girls in Kamla Market (DELHI) 🔝 >༒9953330565🔝 genuine Escort Service 🔝✔️✔️call girls in Kamla Market (DELHI) 🔝 >༒9953330565🔝 genuine Escort Service 🔝✔️✔️
call girls in Kamla Market (DELHI) 🔝 >༒9953330565🔝 genuine Escort Service 🔝✔️✔️
 
4.16.24 21st Century Movements for Black Lives.pptx
4.16.24 21st Century Movements for Black Lives.pptx4.16.24 21st Century Movements for Black Lives.pptx
4.16.24 21st Century Movements for Black Lives.pptx
 
Visit to a blind student's school🧑‍🦯🧑‍🦯(community medicine)
Visit to a blind student's school🧑‍🦯🧑‍🦯(community medicine)Visit to a blind student's school🧑‍🦯🧑‍🦯(community medicine)
Visit to a blind student's school🧑‍🦯🧑‍🦯(community medicine)
 
AMERICAN LANGUAGE HUB_Level2_Student'sBook_Answerkey.pdf
AMERICAN LANGUAGE HUB_Level2_Student'sBook_Answerkey.pdfAMERICAN LANGUAGE HUB_Level2_Student'sBook_Answerkey.pdf
AMERICAN LANGUAGE HUB_Level2_Student'sBook_Answerkey.pdf
 
ACC 2024 Chronicles. Cardiology. Exam.pdf
ACC 2024 Chronicles. Cardiology. Exam.pdfACC 2024 Chronicles. Cardiology. Exam.pdf
ACC 2024 Chronicles. Cardiology. Exam.pdf
 
ECONOMIC CONTEXT - PAPER 1 Q3: NEWSPAPERS.pptx
ECONOMIC CONTEXT - PAPER 1 Q3: NEWSPAPERS.pptxECONOMIC CONTEXT - PAPER 1 Q3: NEWSPAPERS.pptx
ECONOMIC CONTEXT - PAPER 1 Q3: NEWSPAPERS.pptx
 
Inclusivity Essentials_ Creating Accessible Websites for Nonprofits .pdf
Inclusivity Essentials_ Creating Accessible Websites for Nonprofits .pdfInclusivity Essentials_ Creating Accessible Websites for Nonprofits .pdf
Inclusivity Essentials_ Creating Accessible Websites for Nonprofits .pdf
 
FINALS_OF_LEFT_ON_C'N_EL_DORADO_2024.pptx
FINALS_OF_LEFT_ON_C'N_EL_DORADO_2024.pptxFINALS_OF_LEFT_ON_C'N_EL_DORADO_2024.pptx
FINALS_OF_LEFT_ON_C'N_EL_DORADO_2024.pptx
 
MULTIDISCIPLINRY NATURE OF THE ENVIRONMENTAL STUDIES.pptx
MULTIDISCIPLINRY NATURE OF THE ENVIRONMENTAL STUDIES.pptxMULTIDISCIPLINRY NATURE OF THE ENVIRONMENTAL STUDIES.pptx
MULTIDISCIPLINRY NATURE OF THE ENVIRONMENTAL STUDIES.pptx
 
Earth Day Presentation wow hello nice great
Earth Day Presentation wow hello nice greatEarth Day Presentation wow hello nice great
Earth Day Presentation wow hello nice great
 
Proudly South Africa powerpoint Thorisha.pptx
Proudly South Africa powerpoint Thorisha.pptxProudly South Africa powerpoint Thorisha.pptx
Proudly South Africa powerpoint Thorisha.pptx
 
Like-prefer-love -hate+verb+ing & silent letters & citizenship text.pdf
Like-prefer-love -hate+verb+ing & silent letters & citizenship text.pdfLike-prefer-love -hate+verb+ing & silent letters & citizenship text.pdf
Like-prefer-love -hate+verb+ing & silent letters & citizenship text.pdf
 
Judging the Relevance and worth of ideas part 2.pptx
Judging the Relevance  and worth of ideas part 2.pptxJudging the Relevance  and worth of ideas part 2.pptx
Judging the Relevance and worth of ideas part 2.pptx
 
Grade 9 Quarter 4 Dll Grade 9 Quarter 4 DLL.pdf
Grade 9 Quarter 4 Dll Grade 9 Quarter 4 DLL.pdfGrade 9 Quarter 4 Dll Grade 9 Quarter 4 DLL.pdf
Grade 9 Quarter 4 Dll Grade 9 Quarter 4 DLL.pdf
 
YOUVE_GOT_EMAIL_PRELIMS_EL_DORADO_2024.pptx
YOUVE_GOT_EMAIL_PRELIMS_EL_DORADO_2024.pptxYOUVE_GOT_EMAIL_PRELIMS_EL_DORADO_2024.pptx
YOUVE_GOT_EMAIL_PRELIMS_EL_DORADO_2024.pptx
 
Student Profile Sample - We help schools to connect the data they have, with ...
Student Profile Sample - We help schools to connect the data they have, with ...Student Profile Sample - We help schools to connect the data they have, with ...
Student Profile Sample - We help schools to connect the data they have, with ...
 
Science 7 Quarter 4 Module 2: Natural Resources.pptx
Science 7 Quarter 4 Module 2: Natural Resources.pptxScience 7 Quarter 4 Module 2: Natural Resources.pptx
Science 7 Quarter 4 Module 2: Natural Resources.pptx
 
ENGLISH 7_Q4_LESSON 2_ Employing a Variety of Strategies for Effective Interp...
ENGLISH 7_Q4_LESSON 2_ Employing a Variety of Strategies for Effective Interp...ENGLISH 7_Q4_LESSON 2_ Employing a Variety of Strategies for Effective Interp...
ENGLISH 7_Q4_LESSON 2_ Employing a Variety of Strategies for Effective Interp...
 
Incoming and Outgoing Shipments in 3 STEPS Using Odoo 17
Incoming and Outgoing Shipments in 3 STEPS Using Odoo 17Incoming and Outgoing Shipments in 3 STEPS Using Odoo 17
Incoming and Outgoing Shipments in 3 STEPS Using Odoo 17
 
LEFT_ON_C'N_ PRELIMS_EL_DORADO_2024.pptx
LEFT_ON_C'N_ PRELIMS_EL_DORADO_2024.pptxLEFT_ON_C'N_ PRELIMS_EL_DORADO_2024.pptx
LEFT_ON_C'N_ PRELIMS_EL_DORADO_2024.pptx
 

Microsoft mathmatics step-by-step_guide

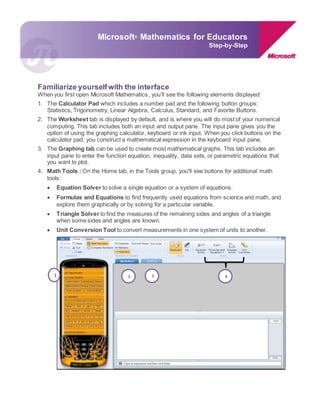
  • 1. Familiarize yourselfwith the interface When you first open Microsoft Mathematics, you’ll see the following elements displayed: 1. The Calculator Pad which includes a number pad and the following button groups: Statistics, Trigonometry, Linear Algebra, Calculus, Standard, and Favorite Buttons. 2. The Worksheet tab is displayed by default, and is where you will do most of your numerical computing. This tab includes both an input and output pane. The input pane gives you the option of using the graphing calculator, keyboard or ink input. When you click buttons on the calculator pad, you construct a mathematical expression in the keyboard input pane. 3. The Graphing tab can be used to create most mathematical graphs. This tab includes an input pane to enter the function equation, inequality, data sets, or parametric equations that you want to plot. 4. Math Tools : On the Home tab, in the Tools group, you'll see buttons for additional math tools:  Equation Solver to solve a single equation or a system of equations.  Formulas and Equations to find frequently used equations from science and math, and explore them graphically or by solving for a particular variable.  Triangle Solver to find the measures of the remaining sides and angles of a triangle when some sides and angles are known.  Unit Conversion Tool to convert measurements in one system of units to another. Microsoft® Mathematics for Educators Step-by-Step 1 2 3 4
  • 2. Using the GraphingCalculator The primary tool in Microsoft Mathematics is a full-featured scientific calculator with extensive graphing and equation-solving capabilities. You can use it just like a handheld calculator by clicking buttons, or you can use your keyboard to type the mathematical expressions that you want the calculator to evaluate. Solve an equation: Our sample problem is to find the area of a walkway that surrounds a rectangular swimming pool. The pool measures 9 meters by 15 meters, and the walkway is 2 meters wide. Using the buttons on the calculator 1. Calculate the area of the pool and walkway by clicking the following calculator buttons. Use parentheses to group calculations appropriately: 2. Calculate the area of just the pool: 3. Subtract the area of the pool from the area of the pool and walkway: Using the Inking Capabilities: With Microsoft Mathematics users can input an equation or fraction using the improved ink input capabilities. Users can write mathematical expressions in the Ink input pane using the pen from a Tablet PC or an ultra-mobile PC. You can also use a mouse. Ink input is available on both the Worksheet and Graphing tabs.
  • 3. 1. On the Home tab, Select the Ink option in the Input tab 2. In the Ink input area draw the following fraction using your pen from your Tablet PC, or your mouse if you have a laptop 3. Hit Enter Solving EquationsStep-by-Step Microsoft Mathematics provides step-by-step solutions to many types of problems, from simplification of algebraic expressions to solving systems of equations. If a step-by-step solution is available for an expression, you will see the heading "Solution steps" between the input and output expressions in the output pane. 1. Using the Equation from above- 2x/4=2 2. Hit Enter 3. You’ll see the equation is solved in the Output Pane 4. Click on Solution steps
  • 4. 5. You’ll see the completed Step-by-step solution for the equation in the Output pane If a step-by-step solution is available for an expression, you will see the heading "Solution steps" between the input and output expressions in the output pane regardless if you enter the expression using the calculator, keyboard, or ink input option
  • 5. How To Create a Graph How to Create a Graph To create most mathematical graphs, you use the Graphing tab. The Graphing tab includes an input pane that you use to enter the function, equation, inequality, data set, or parametric equation that you want to plot. To work with the graph after you plot it, the Graphing tab also includes a pane that describes what is plotted in the graph, and a graph pane that displays the graph. General steps for plotting a graph 1. Click the Graphing tab. 2. Expand the appropriate input pane: Equations & Functions, Equations, Data Sets, Parametric, or Inequalities. 3. In the Dimensions list, click 2D or 3D.
  • 6. 4. In the Coordinates list, click Cartesian, Polar, Spherical, or Cylindrical. 5. Enter the expression or data you want to plot. 6. Click Graph Plotting 2D Graphs Plot a Line You can plot any line by using Microsoft Mathematics. The simplest way is to put the equation of the line into slope-intercept form and plot the right side of the equation as a function of y. You can plot any form of the line as an equation, and you can also plot two data points and draw the resulting line. Sample Equation: y = (2/3) x + 3 Plot a line as a function of y 1. Click the Graphing tab. 2. Expand Equations & Functions. 3. In the first input box, enter y= (2/3) x +3. 4. Click Enter 5. Click Graph and see results
  • 7. Plot an equation or function in 2D Cartesiancoordinates Plot an equation or function in 2D Cartesian coordinates To plot one equation or function Sample Equation: r=sin (ntheta) 1. Click the Graphing tab. 2. Expand Equations & Functions. 3. In the Dimensions list, click 2D. 4. Select Polar. 5. Click in the first box. 6. In the Input box that appears, type: sin(ntheta), and then click Enter.
  • 8. 7. Click Graph. To plot multiple equations or functions follow the same steps as above, but add another equation to the second box. If you want to add a third equation or function, click Add, and then enter the equation or function in the new box that appears. Animate a graph When you create a graph that involves unknown parameters, such as the graph of y = sin(ax), Microsoft Mathematics initially picks an arbitrary value for the unknown parameter a and draws the graph using that value. After the graph is created, however, you can change the value of a and animate the graph by using a range of values for the unknown parameter. What you see during the animation is a series of graphs, each drawn with a slightly different value of the unknown parameter. If your graph involves multiple unknown parameters, you can choose which parameter to animate. You can also set the values of some parameters to specific values while you animate another. To animate a graph 1. On the Graphing tab, expand Graph Controls
  • 9. 2. In the Parameter list, parameter that you want to animate. 3. In the Lower Bound box, enter a lower bound for the parameter. The default is 0. 4. In the Upper Bound box, enter an upper bound for the parameter. The default is 2. (You can enter an upper bound that is smaller than the lower bound. In this case, Microsoft Mathematics animates from the larger value to the smaller.) 5. Click About 3D Surface Graphs A 3D surface graph is a way to represent three-dimensional data in two dimensions. In its simplest form, it shows a function of two variables x and y as a "carpet", with the height of the carpet at any point (x,y) equal to the value of the function at that point. You can create more complicated surfaces, such as spheres and tori, as the graphs of equations in three variables.
  • 10. You can create 3D surface graphs of a function of two variables: as graphs of equations in three variables, or as graphs of three parametric equations. You can display 3D surface graphs in two ways. 1. The default is to show a colored surface, where the color is based on the angle each point of the surface makes with each of several differently colored light sources. 2. You can also show the surface as a wireframe (also called a mesh or grid), which shows the surface as made up of lines). You have probably seen similar graphs in documentaries that show the making of a computer-animated film. A color surface graph. A wireframe graph. If you right-click and move your mouse along the boundaries, you'll see the plane and it's intersection in the graph. This action is possible if Direct3D is installed and enabled for 3D graphing. Plot One Equation or Function Sample Equation: r=3theta-phi 1. Click the Graphing tab. 2. Expand Equations & Functions. 3. In the Dimensions list, click 3D.
  • 11. 4. Click in the first box. 5. In the Input box that appears, Type an equation or function definition, 3theta-phi, and then click Enter. 6. Click Graph.
  • 12. Rotate a 3D Graph When you view a 3D surface graph, as when you view a 3D object in real life, part of the graph is hidden from view. To see all of the features of the graph, you need to view the graph from different angles. To rotate a graph 1. On the Graphing Tools tab, in the Display group, click the axis around which you want to rotate the graph in the Rotate list. 2. Click Counterclockwise or Clockwise. When you rotate a graph by using one of these buttons, the graph continues to rotate until you click the button again. To rotate a graph in any direction, hold your left-mouse key down, and drag the graph in the direction you want the graph to rotate. To put the graph into motion, hold your left mouse key down, drag the graph and release Math Tools Microsoft Mathematics includes a number of tools to perform specific types of calculations. On the Home tab, in the Tools group, there are buttons for the following tools:
  • 13.  Equation Solver You can use the Equation Solver to solve one or more equations simultaneously. The Equation Solver allows you to enter a single equation or system of equations, and then the solution is displayed in the Microsoft Mathematics Worksheet.  Formulas and Equations You can use Formulas and Equations library to find many common formulas, constants, and equations from a variety of mathematical and scientific disciplines, including algebra, geometry, chemistry, and physics. You can click an equation to plot it or solve it for a particular variable.  Triangle Solver You can use the Triangle Solver to enter known side and angle data for a triangle and calculate the remaining sides and angles.  Unit Converter You can use the Unit Converter to convert data from one set of units to another. Use the Equation Solver The Equation Solver provides an easy way to enter a single equation or system of equations that you want to solve. The solution to the equation or system is displayed in the Worksheet. To use the Equation Solver 1. On the Home tab, in the Tools group, click Equation Solver. 2. In the list at the top of the Equation Solver, click the number of equations you want to solve.
  • 14. 3. Type an equation in each of the boxes provided. Note: Do not press Enter on the keyboard before you enter all of the equations. 4. Click Solve. Example 1. Click Solve a system of 2 equations. 2. In the box labeled Equation 1, type the following: 3x - 4y = 2 3. In the box labeled Equation 2, type the following: 5x + 2y = 7 4. Click Solve. Use Formulas and Equations Microsoft Mathematics includes a library of formulas and equations that contains many common equations and formulas from mathematics, physics, and chemistry. You can use Formulas and Equations as a resource when you work on your homework assignments. For example, you can copy the equations from the library into the Worksheet and then plot the equations, or solve them for any particular variable. In Formulas and Equations, you can find everything from the quadratic formula, to the formula for the area of a triangle, to the equation for the force of gravity. To solve an equation 1. On the Home tab, in the Tools group, click Formulas and Equations, and then click the type of equations you want to view. 2. The Formulas and Equations list appears. Select one of the subjects, ranging from Algebra, Geometry, Trigonometry, Physics, Chemistry, Law of Exponents, Properties of Logarithms, or Constants.
  • 15. 3. Right-click one of the equation, and then click Solve this equation. Input boxes for each parameter and variable of the equation appear at the bottom of Formulas and Equations. 4. Enter values in all but one of the input boxes.
  • 16. 5. Click Enter. The equation is solved for the remaining variable or parameter and shown in the Worksheet. Use the Triangle Solver The Triangle Solver helps you explore triangles and the relationships among their many parts. To use the Triangle Solver 1. On the Home tab, in the Tools group, click Triangle Solver. 2. The Triangle Solver appears.
  • 17. 3. In the Show list, click the information you want to see: o Rules used to calculate shows the theorems and axioms used to calculate unknown side and angle measures from the known side and angle measures you enter. o Triangle type identifies the type of triangle based on the information you entered. o Altitudes and area shows the three altitudes and area of the triangle 4. Enter known side and angle measures in the boxes provided. 5. Click Calculate. Use the Unit Converter The Unit Converter helps you convert measurements from one unit of measurement to another. To use the Unit Conversion Tool 1. On the Home tab, in the Tools group, click Unit Converter. The Unit Converter appears.
  • 18. 2. In the Convert list, click the type of measurement you are converting (example: length). 3. In the From list, click the unit you are converting from. (example: feet) 4. In the To list, click the unit you are converting to. (example: meters) 5. In the Input box, enter the measurement you are converting. 6. Click Calculate. The Weight/Mass category in the Unit Conversion Tool offers conversion between English units of weight, such as pounds, to metric units such as kilograms. However, some authorities insist that pounds should be converted to newtons, the metric unit of force, and that kilograms should be converted to slugs, the English unit of mass. These conversions are possible using the Force and Mass categories of the tool. The conversions in the Weight/Mass category are used by such authorities as the U.S. National Institute of Standards and Technology.