SlideShare una empresa de Scribd logo
1 de 12
Descargar para leer sin conexión
Monday January 23, 2012
  Market Trends                                                                            MISSOULA, MT
  Executive Summary                                                                             Single Family Homes


     This Week
                                                                                                                           Real-Time Market Profile                          Trend
                                                                                                          Median List Price                            $ 239,450             ±+
                                                                                                          Asking Price Per Square Foot                     $ 136             ==
        The median list price in MISSOULA, MT this week is $239,450.                                      Average Days on Market (DOM)                       214             ==
                                                                                                          Percent of Properties with Price Decrease         23 %
                                                                                                          Percent Relisted (reset DOM)                       n/a
        Inventory has been tightening and days-on-market increasing
        recently. The Market Action Index has been basically flat, not                                    Percent Flip (price increased)                      2%
        providing strong indication for market conditions.                                                Median House Size (sq ft)                         1749
                                                                                                          Median Lot Size                     8,001 - 10,000 sqft
                                                                                                          Median Number of Bedrooms                           3.0
                                                                                                          Median Number of Bathrooms                                  2.0

     Supply and Demand                                                                                    Market Action Index            Strong Buyer's             17.2     ±+


         The market has shown some evidence of slowing recently. Both                            ±+ No change         == Strong upward trend ≠≠ Strong downward trend
         prices and inventory levels are relatively unchanged in recent weeks.
         Watch the Market Action Index for changes as it can be a leading                                              = Slight upward trend ≠ Slight downward trend
         indicator for price changes.


                                                                                                           Price
                                                             Market Action Index                               The market seems to have paused around this plateau. The
                                                                                                               Market Action Index is a good leading indicator for the durability
                                                                                                               of this trend.


                                                                                                                                                                         Price Trends


     7-Day Rolling Average          90-Day Rolling Average           Buyer/Seller Cutoff


        The Market Action Index answers the question "How's the
        Market?" by measuring the current rate of sale versus the
        amount of the inventory. Index above 30 implies Seller's
        Market conditions. Below 30, conditions favor the buyer.


     Quartiles
                                                                                                                       7-Day Rolling Average        90-Day Rolling Average


                                                                                              Characteristics per Quartile            Investigate the market in quartiles -
                                                                                                                                      where each quartile is 25% of homes
                                                                                                                                      ordered by price.
      Quartile          Median Price       Sq. Ft.     Lot Size          Beds      Baths   Age Inventory New Absorbed DOM
                                                         1.0 - 2.5
    Top/First                $ 499,000       2999           acres         4.0       3.0    13     113         4        7    274      Most expensive 25% of properties

                                                       0.25 - 0.50
Upper/Second                 $ 289,900       2249             acre        3.0       2.0    20     113         3        4    231      Upper-middle 25% of properties

                                                           6,501 -
  Lower/Third                $ 210,000       1749       8,000 sqft        3.0       2.0    30     113         7        6    168      Lower-middle 25% of properties

                                                           4,501 -
Bottom/Fourth                $ 169,000       1249       6,500 sqft        3.0       2.0    33     113         6        7    184      Least expensive 25% of properties


                                                  Prudential Montana Real Estate | (406) 721-4141


                              Powered by Altos Research LLC | www.altosresearch.com | Copyright ©2005-2010 Altos Research LLC
City Overview                                                                                                             Single Family Homes in

  Prudential Montana Real Estate | (406) 721-4141
                                                                                                                             MISSOULA, MT


  This Week                                                                               Real-Time Market Profile                                 Trend
     The median list price in MISSOULA,                              Median List Price                                               $ 239,450      ±+
     MT this week is $239,450. The 452                               Average List Price                                              $ 323,586
     properties have been on the market                              Asking Price Per Square Foot                                        $ 136      ==
     for an average of 214 days.                                     Average Days on Market (DoM)                                          214      ==

                                                                     Inventory of Properties Listed                                        452      ≠≠

                                                                     Most Expensive Listing                                        $ 3,985,000
     Inventory has been tightening and                               Least Expensive Listing                                          $ 45,900

     days-on-market increasing recently.                             Average Age of Listing                                                 30
     The Market Action Index has been                                Percent of Properties with Price Decrease                            23 %
     basically flat, not providing strong                            Percent Relisted (reset DOM)                                          n/a
     indication for market conditions.                               Percent Flip (price increased)                                        2%
                                                                     Median House Size (sq ft)                                            1749
                                                                     Median Lot Size                                        8,001 - 10,000 sqft
                                                                     Median Number of Bedrooms                                             3.0


  Supply and Demand
                                                                     Median Number of Bathrooms                                            2.0

                                                                                          Altos Research Value Statistics
    The market has shown some                                        Market Action Index                Strong Buyer's                    17.2      ±+
    evidence of slowing recently. Both                                The Market Action Index answers the question "How's the Market?" by measuring
                                                                      the current rate of sale versus the amount of the inventory. Index above 30
    prices and inventory levels are                                   implies a seller's advantage. Below 30, conditions give the advantage to the
    relatively unchanged in recent                                    buyer.
    weeks. Watch the Market Action
    Index for changes as it can be a                           Trend Key:                         == Strong upward trend ≠≠ Strong downward trend
    leading indicator for price changes.                                  ±+ No change             = Slight upward trend ≠ Slight downward trend


  Characteristics per Quartile

      Quartile   Median Price   Sq. Ft. Lot Size      Beds   Baths      Age Inventory New         Absorbed   DOM

                                         1.0 - 2.5
    Top/First       $ 499,000   2999        acres      4.0    3.0        13       113         4        7     274         Most expensive 25% of properties

                                       0.25 - 0.50
Upper/Second        $ 289,900   2249          acre     3.0    2.0        20       113         3        4     231         Upper-middle 25% of properties

                                           6,501 -
  Lower/Third       $ 210,000   1749    8,000 sqft     3.0    2.0        30       113         7        6     168         Lower-middle 25% of properties

                                           4,501 -
Bottom/Fourth       $ 169,000   1249    6,500 sqft     3.0    2.0        33       113         6        7     184         Least expensive 25% of properties


Page 2 of 31                                         Monday January 23, 2012
Single Family Homes in
  City Overview
  Prudential Montana Real Estate | (406) 721-4141
                                                                                                                 MISSOULA, MT


 Median Price
    The market seems to have paused around this plateau. The Market Action Index is a good leading indicator for the durability of
    this trend.


                                                 7-day Average                    90-day Average


 Quartile Prices
    Prices have settled at a price plateau across the board. Prices in all four quartiles are basically mixed. Look for a persistent shift
    (up or down) in the Market Action Index before prices move from these current levels.


                First/Top                       Second/Upper                    Third/Lower                     Fourth/Bottom


Page 3 of 31                                    Monday January 23, 2012
Single Family Homes in
  City Overview
  Prudential Montana Real Estate | (406) 721-4141
                                                                                                             MISSOULA, MT


 Price per Square Foot
    The value placed on homes continues to increase, despite the fact that prices in general have been basically flat recently.
    These conditions can arise when inventory is light and more, smaller homes have more influence on overall prices.


                                               7-day Average                  90-day Average


 Inventory of Properties Listed for Sale
    Inventory has been falling in recent weeks. Note that declining inventory alone does not signal a strengthening market. Look to
    the Market Action Index and Days on Market trends to gauge whether buyer interest is changing with the available supply.


                                             7-day Average                  90-day Average


Page 4 of 31                                   Monday January 23, 2012
Single Family Homes in
  City Overview
  Prudential Montana Real Estate | (406) 721-4141
                                                                                                            MISSOULA, MT


 Market Action Index
    The MISSOULA market is currently quite strongly in the Buyer's Advantage zone (below 30). The 90-day Market Action Index
    stands at 17.19. With several months of inventory available at the current sales rate, buyers should find ample choice.


                                              90-day Average               Buyers/Sellers Cutoff


 Market Action Index per Quartile
   Not surprisingly given the overall Market Action Index, all quartiles are in the Buyer's Market zone with several months of
   inventory given the current rate of demand for homes in the quartile. Watch the quartile for changes before the overall market
   shifts. Often one end of the market (e.g. the low end) will improve and signal a strengthening market before the whole group
   changes.


           First/Top                      Second/Upper                 Third/Lower                    Fourth/Bottom

                                                        Buyers/Sellers Cutoff
          Residential house prices are a function of supply and demand, and market conditions can be characterized
          by analyzing those factors. Watch this index for sustained changes: if the index falls into the Buyer’s
          Advantage zone (below 30) for a long period, prices are likely in for a downward correction.


Page 5 of 31                                  Monday January 23, 2012
Single Family Homes in
  City Overview
  Prudential Montana Real Estate | (406) 721-4141
                                                                                                              MISSOULA, MT


 Days on Market
    The properties have been on the market for an average of 214 days. Half of the listings have come newly on the market in the
    past 152 or so days.


                                                7-day Average                90-day Average


 Days on Market per Quartile
    It is not uncommon for the higher priced homes in an area to take longer to sell than those in the lower quartiles.


           First/Top                       Second/Upper                  Third/Lower                     Fourth/Bottom


Page 6 of 31                                    Monday January 23, 2012
Monday January 23, 2012
  Market Trends                                                                            MISSOULA, MT
  Executive Summary                                                                         Condos - Townhomes


     This Week
                                                                                                                      Real-Time Market Profile                            Trend
                                                                                                      Median List Price                                  $ 179,900         ==
                                                                                                      Asking Price Per Square Foot                           $ 139         ==
        The median list price in MISSOULA, MT this week is $179,900.                                  Average Days on Market (DOM)                             255         ==
                                                                                                      Percent of Properties with Price Decrease               18 %
                                                                                                      Percent Relisted (reset DOM)                             n/a
        Inventory has been decreasing lately but the Market Action Index is
        falling also. With days-on-market climbing, these are relatively                              Percent Flip (price increased)                           0%
        negative implications for the market.                                                         Median House Size (sq ft)                               1249
                                                                                                      Median Number of Bedrooms                                2.0
                                                                                                      Median Number of Bathrooms                               2.0
                                                                                                      Market Action Index            Strong Buyer's             10.9       ≠≠

     Supply and Demand
          In terms of supply and demand, the market is getting cooler - more                 ±+ No change        == Strong upward trend ≠≠ Strong downward trend
          supply is coming on the market relative to the sales demand.
          However, in recent weeks prices have been moving higher. Since it is                                    = Slight upward trend ≠ Slight downward trend
          technically a Buyer's market, this price trend may be a result of
          improved quality (newer, larger homes) of the homes being listed.
          Look at the descriptive statistics where you may notice the homes
          being listed are larger and younger than they have been in the past.                         Price
                                                             Market Action Index                          Price trends continued their recent uptrend this week. While
                                                                                                          still below the market's price high-point, we've seen a nice run
                                                                                                          recently.


                                                                                                                                                                        Price Trends


     7-Day Rolling Average          90-Day Rolling Average     Buyer/Seller Cutoff


        The Market Action Index answers the question "How's the
        Market?" by measuring the current rate of sale versus the
        amount of the inventory. Index above 30 implies Seller's
        Market conditions. Below 30, conditions favor the buyer.


     Quartiles
                                                                                                                  7-Day Rolling Average        90-Day Rolling Average


                                                                                         Characteristics per Quartile             Investigate the market in quartiles -
                                                                                                                                  where each quartile is 25% of homes
                                                                                                                                  ordered by price.
      Quartile               Median Price        Square Feet        Beds      Baths   Age Inventory New Absorbed DOM

    Top/First                 $ 375,000                 2249        3.0        2.2     4        29       0        0    488       Most expensive 25% of properties


Upper/Second                  $ 210,000                 1249        2.0        2.0    18        30       3        0    187       Upper-middle 25% of properties

  Lower/Third                 $ 161,950                 1249        2.0        1.8     4        30       0        0    180       Lower-middle 25% of properties


Bottom/Fourth                 $ 125,750                  999        2.0        1.0    10        30       0        2    174       Least expensive 25% of properties


                                                   Prudential Montana Real Estate | (406) 721-4141


                              Powered by Altos Research LLC | www.altosresearch.com | Copyright ©2005-2010 Altos Research LLC
City Overview                                                                                                Condos & Townhomes in

 Prudential Montana Real Estate | (406) 721-4141
                                                                                                                 MISSOULA, MT


 This Week                                                                     Real-Time Market Profile                                Trend
    The median list price in MISSOULA,                    Median List Price                                              $ 179,900      ==
    MT this week is $179,900. The 119                     Average List Price                                             $ 226,840
    properties have been on the market                    Asking Price Per Square Foot                                       $ 139      ==
    for an average of 255 days.                           Average Days on Market (DoM)                                         255      ==

                                                          Inventory of Properties Listed                                       119      ≠≠

                                                          Most Expensive Listing                                         $ 667,500
    Inventory has been decreasing lately                  Least Expensive Listing                                         $ 77,500

    but the Market Action Index is falling                Average Age of Listing                                                21
    also. With days-on-market climbing,                   Percent of Properties with Price Decrease                           18 %
    these are relatively negative                         Percent Relisted (reset DOM)                                         n/a
    implications for the market.                          Percent Flip (price increased)                                       0%
                                                          Median House Size (sq ft)                                           1249
                                                          Median Number of Bedrooms                                            2.0
                                                          Median Number of Bathrooms                                           2.0


 Supply and Demand                                                             Altos Research Value Statistics
   Inventory levels have been relatively                  Market Action Index               Strong Buyer's                    10.9      ≠≠
   consistent relative to sales. Despite                   The Market Action Index answers the question "How's the Market?" by measuring
                                                           the current rate of sale versus the amount of the inventory. Index above 30
   the fact that there is a relatively                     implies a seller's advantage. Below 30, conditions give the advantage to the
   high amount of available inventory,                     buyer.
   this Buyer's market is still seeing
   prices move higher. Given inventory                  Trend Key:                    == Strong upward trend ≠≠ Strong downward trend
   levels, these price conditions are                            ±+ No change          = Slight upward trend ≠ Slight downward trend
   relatively fragile. If the market
   cools off further, the price trend is
   likely to reverse.


 Characteristics per Quartile

     Quartile   Median Price   Sq. Ft.   Beds   Baths     Age Inventory        New    Absorbed   DOM


    Top/First     $ 375,000    2249      3.0    2.2          4       29         0          0     488         Most expensive 25% of properties


Upper/Second      $ 210,000    1249      2.0    2.0        18        30         3          0     187         Upper-middle 25% of properties

  Lower/Third     $ 161,950    1249      2.0    1.8          4       30         0          0     180         Lower-middle 25% of properties


Bottom/Fourth     $ 125,750     999      2.0    1.0        10        30         0          2     174         Least expensive 25% of properties


Page 2 of 26                             Monday January 23, 2012
Condos & Townhomes in
  City Overview
  Prudential Montana Real Estate | (406) 721-4141
                                                                                                                 MISSOULA, MT


 Median Price
    Price trends continued their recent uptrend this week. While still below the market's price high-point, we've seen a nice run
    recently.


                                                 7-day Average                    90-day Average


 Quartile Prices
    Prices have settled at a price plateau across the board. Prices in all four quartiles are basically mixed. Look for a persistent shift
    (up or down) in the Market Action Index before prices move from these current levels.


                First/Top                       Second/Upper                    Third/Lower                     Fourth/Bottom


Page 3 of 26                                    Monday January 23, 2012
Condos & Townhomes in
 City Overview
 Prudential Montana Real Estate | (406) 721-4141
                                                                                                            MISSOULA, MT


 Price per Square Foot
   The market appears to be placing an increasing premium on homes. When list prices and price per square foot consistently
   increase in tandem, as they're doing now, you can often find short-term investment opportunities. Watch the Market Action
   Index for persistent changes as a leading indicator for these trends to flatten or drop.


                                              7-day Average                  90-day Average


 Inventory of Properties Listed for Sale
   Inventory has been falling in recent weeks. Note that declining inventory alone does not signal a strengthening market. Look to
   the Market Action Index and Days on Market trends to gauge whether buyer interest is changing with the available supply.


                                            7-day Average                  90-day Average


Page 4 of 26                                 Monday January 23, 2012
Condos & Townhomes in
  City Overview
  Prudential Montana Real Estate | (406) 721-4141
                                                                                                            MISSOULA, MT


 Market Action Index
    The MISSOULA market is currently quite strongly in the Buyer's Advantage zone (below 30). The 90-day Market Action Index
    stands at 10.94. With several months of inventory available at the current sales rate, buyers should find ample choice.


                                              90-day Average               Buyers/Sellers Cutoff


 Market Action Index per Quartile
   Not surprisingly given the overall Market Action Index, all quartiles are in the Buyer's Market zone with several months of
   inventory given the current rate of demand for homes in the quartile. Watch the quartile for changes before the overall market
   shifts. Often one end of the market (e.g. the low end) will improve and signal a strengthening market before the whole group
   changes.


           First/Top                      Second/Upper                 Third/Lower                    Fourth/Bottom

                                                        Buyers/Sellers Cutoff
          Residential house prices are a function of supply and demand, and market conditions can be characterized
          by analyzing those factors. Watch this index for sustained changes: if the index falls into the Buyer’s
          Advantage zone (below 30) for a long period, prices are likely in for a downward correction.


Page 5 of 26                                  Monday January 23, 2012
Condos & Townhomes in
  City Overview
  Prudential Montana Real Estate | (406) 721-4141
                                                                                                             MISSOULA, MT


 Days on Market
   The properties have been on the market for an average of 255 days. Half of the listings have come newly on the market in the
   past 162 or so days.


                                               7-day Average                90-day Average


 Days on Market per Quartile
   It is not uncommon for the higher priced homes in an area to take longer to sell than those in the lower quartiles.


          First/Top                       Second/Upper                  Third/Lower                     Fourth/Bottom


Page 6 of 26                                   Monday January 23, 2012

Más contenido relacionado

Destacado (9)

2013 Missoula Housing Report - March 28, 2013
2013 Missoula Housing Report - March 28, 20132013 Missoula Housing Report - March 28, 2013
2013 Missoula Housing Report - March 28, 2013
 
Are Missoula’s Property Taxes High?
Are Missoula’s Property Taxes High?Are Missoula’s Property Taxes High?
Are Missoula’s Property Taxes High?
 
2014 Missoula Housing Report - April, 2014
2014 Missoula Housing Report - April, 20142014 Missoula Housing Report - April, 2014
2014 Missoula Housing Report - April, 2014
 
2012 Missoula Housing Report - April 12, 2012
2012 Missoula Housing Report - April 12, 20122012 Missoula Housing Report - April 12, 2012
2012 Missoula Housing Report - April 12, 2012
 
Missoula Housing Report - March 5, 2009
Missoula Housing Report - March 5, 2009Missoula Housing Report - March 5, 2009
Missoula Housing Report - March 5, 2009
 
Demographics of Missoula Neighborhoods
Demographics of Missoula NeighborhoodsDemographics of Missoula Neighborhoods
Demographics of Missoula Neighborhoods
 
Infinitive vs Gerund
Infinitive vs GerundInfinitive vs Gerund
Infinitive vs Gerund
 
Conditionals 1,2,3
Conditionals 1,2,3Conditionals 1,2,3
Conditionals 1,2,3
 
Missoula Housing Report - March 25, 2010
Missoula Housing Report - March 25, 2010Missoula Housing Report - March 25, 2010
Missoula Housing Report - March 25, 2010
 

Último

Call Girls in Inderpuri Delhi 💯Call Us 🔝8264348440🔝
Call Girls in Inderpuri Delhi 💯Call Us 🔝8264348440🔝Call Girls in Inderpuri Delhi 💯Call Us 🔝8264348440🔝
Call Girls in Inderpuri Delhi 💯Call Us 🔝8264348440🔝soniya singh
 
Call Girls in Nehru Place Delhi 💯Call Us 🔝8264348440🔝
Call Girls in Nehru Place Delhi 💯Call Us 🔝8264348440🔝Call Girls in Nehru Place Delhi 💯Call Us 🔝8264348440🔝
Call Girls in Nehru Place Delhi 💯Call Us 🔝8264348440🔝soniya singh
 
Call Girls in Janakpuri ↫8447779280↫Short 1500 Night 6000-Escorts Service In ...
Call Girls in Janakpuri ↫8447779280↫Short 1500 Night 6000-Escorts Service In ...Call Girls in Janakpuri ↫8447779280↫Short 1500 Night 6000-Escorts Service In ...
Call Girls in Janakpuri ↫8447779280↫Short 1500 Night 6000-Escorts Service In ...asmaqueen5
 
Call Girls in Noida Sector 12 Noida 💯Call Us 🔝 9582086666 🔝 South Delhi Escor...
Call Girls in Noida Sector 12 Noida 💯Call Us 🔝 9582086666 🔝 South Delhi Escor...Call Girls in Noida Sector 12 Noida 💯Call Us 🔝 9582086666 🔝 South Delhi Escor...
Call Girls in Noida Sector 12 Noida 💯Call Us 🔝 9582086666 🔝 South Delhi Escor...delhimodel235
 
Purva Palm Hills Devanahalli, Bangalore E- Brochure.pdf
Purva Palm Hills Devanahalli, Bangalore E- Brochure.pdfPurva Palm Hills Devanahalli, Bangalore E- Brochure.pdf
Purva Palm Hills Devanahalli, Bangalore E- Brochure.pdffaheemali990101
 
Call Girls in Khan Market 9654467111 ESCORTS SERVICE
Call Girls in Khan Market 9654467111 ESCORTS SERVICECall Girls in Khan Market 9654467111 ESCORTS SERVICE
Call Girls in Khan Market 9654467111 ESCORTS SERVICESapana Sha
 
How to Build Multifamily and Laneway Suites in Toronto!! (feat. Expert Archi...
How to Build Multifamily and Laneway Suites  in Toronto!! (feat. Expert Archi...How to Build Multifamily and Laneway Suites  in Toronto!! (feat. Expert Archi...
How to Build Multifamily and Laneway Suites in Toronto!! (feat. Expert Archi...Volition Properties
 
Omaxe Dwarka In Delhi E Brochure Pdf
Omaxe Dwarka In Delhi E Brochure     PdfOmaxe Dwarka In Delhi E Brochure     Pdf
Omaxe Dwarka In Delhi E Brochure Pdfashiyadav24
 
9990771857 Call Girls in Noida Sector 11 Noida (Call Girls) Delhi
9990771857 Call Girls in Noida Sector 11 Noida (Call Girls) Delhi9990771857 Call Girls in Noida Sector 11 Noida (Call Girls) Delhi
9990771857 Call Girls in Noida Sector 11 Noida (Call Girls) Delhidelhimodel235
 
Call Girls in Pitampura Delhi 💯Call Us 🔝8264348440🔝
Call Girls in Pitampura Delhi 💯Call Us 🔝8264348440🔝Call Girls in Pitampura Delhi 💯Call Us 🔝8264348440🔝
Call Girls in Pitampura Delhi 💯Call Us 🔝8264348440🔝soniya singh
 
call girls in Shahdara (DELHI) 🔝 >༒9953330565🔝 genuine Escort Service 🔝✔️✔️
call girls in Shahdara (DELHI) 🔝 >༒9953330565🔝 genuine Escort Service 🔝✔️✔️call girls in Shahdara (DELHI) 🔝 >༒9953330565🔝 genuine Escort Service 🔝✔️✔️
call girls in Shahdara (DELHI) 🔝 >༒9953330565🔝 genuine Escort Service 🔝✔️✔️9953056974 Low Rate Call Girls In Saket, Delhi NCR
 
Rustomjee The Panorama At Pali Hill, Bandra West, Mumbai - Brochure.pdf
Rustomjee The Panorama At Pali Hill, Bandra West, Mumbai - Brochure.pdfRustomjee The Panorama At Pali Hill, Bandra West, Mumbai - Brochure.pdf
Rustomjee The Panorama At Pali Hill, Bandra West, Mumbai - Brochure.pdfmonikasharma630
 
Call girls in Jeewan Park .Delhi↫8447779280↬ ꧂Escorts Service In Delhi Ncr
Call girls in Jeewan Park .Delhi↫8447779280↬ ꧂Escorts Service In Delhi NcrCall girls in Jeewan Park .Delhi↫8447779280↬ ꧂Escorts Service In Delhi Ncr
Call girls in Jeewan Park .Delhi↫8447779280↬ ꧂Escorts Service In Delhi Ncrasmaqueen5
 
Call Girls in shastri nagar Delhi 8264348440 ✅ call girls ❤️
Call Girls in shastri nagar Delhi 8264348440 ✅ call girls ❤️Call Girls in shastri nagar Delhi 8264348440 ✅ call girls ❤️
Call Girls in shastri nagar Delhi 8264348440 ✅ call girls ❤️soniya singh
 
Call Girls in Noida Sector 11 Noida 💯Call Us 🔝 9582086666 🔝 South Delhi Escor...
Call Girls in Noida Sector 11 Noida 💯Call Us 🔝 9582086666 🔝 South Delhi Escor...Call Girls in Noida Sector 11 Noida 💯Call Us 🔝 9582086666 🔝 South Delhi Escor...
Call Girls in Noida Sector 11 Noida 💯Call Us 🔝 9582086666 🔝 South Delhi Escor...delhimodel235
 
Call Girls in Model Town Delhi 💯Call Us 🔝8264348440🔝
Call Girls in Model Town Delhi 💯Call Us 🔝8264348440🔝Call Girls in Model Town Delhi 💯Call Us 🔝8264348440🔝
Call Girls in Model Town Delhi 💯Call Us 🔝8264348440🔝soniya singh
 
83770-87607 ۞Call Girls In Near The Park Hotel (Cp) Delhi
83770-87607 ۞Call Girls In Near The Park Hotel (Cp) Delhi83770-87607 ۞Call Girls In Near The Park Hotel (Cp) Delhi
83770-87607 ۞Call Girls In Near The Park Hotel (Cp) Delhidollysharma2066
 
The Omaxe State Dwarka Delhi-broucher.pdf.pdf
The Omaxe State Dwarka Delhi-broucher.pdf.pdfThe Omaxe State Dwarka Delhi-broucher.pdf.pdf
The Omaxe State Dwarka Delhi-broucher.pdf.pdfkratirudram
 
Aparna Greenscapes Kompally Hyderabad E - Brochure.pdf
Aparna Greenscapes Kompally Hyderabad E - Brochure.pdfAparna Greenscapes Kompally Hyderabad E - Brochure.pdf
Aparna Greenscapes Kompally Hyderabad E - Brochure.pdffaheemali990101
 

Último (20)

Call Girls in Inderpuri Delhi 💯Call Us 🔝8264348440🔝
Call Girls in Inderpuri Delhi 💯Call Us 🔝8264348440🔝Call Girls in Inderpuri Delhi 💯Call Us 🔝8264348440🔝
Call Girls in Inderpuri Delhi 💯Call Us 🔝8264348440🔝
 
VIP Escorts in Delhi:🔝9953056974🔝 Hot Qutub Minar Delhi Escorts Service
VIP Escorts in Delhi:🔝9953056974🔝 Hot Qutub Minar Delhi Escorts ServiceVIP Escorts in Delhi:🔝9953056974🔝 Hot Qutub Minar Delhi Escorts Service
VIP Escorts in Delhi:🔝9953056974🔝 Hot Qutub Minar Delhi Escorts Service
 
Call Girls in Nehru Place Delhi 💯Call Us 🔝8264348440🔝
Call Girls in Nehru Place Delhi 💯Call Us 🔝8264348440🔝Call Girls in Nehru Place Delhi 💯Call Us 🔝8264348440🔝
Call Girls in Nehru Place Delhi 💯Call Us 🔝8264348440🔝
 
Call Girls in Janakpuri ↫8447779280↫Short 1500 Night 6000-Escorts Service In ...
Call Girls in Janakpuri ↫8447779280↫Short 1500 Night 6000-Escorts Service In ...Call Girls in Janakpuri ↫8447779280↫Short 1500 Night 6000-Escorts Service In ...
Call Girls in Janakpuri ↫8447779280↫Short 1500 Night 6000-Escorts Service In ...
 
Call Girls in Noida Sector 12 Noida 💯Call Us 🔝 9582086666 🔝 South Delhi Escor...
Call Girls in Noida Sector 12 Noida 💯Call Us 🔝 9582086666 🔝 South Delhi Escor...Call Girls in Noida Sector 12 Noida 💯Call Us 🔝 9582086666 🔝 South Delhi Escor...
Call Girls in Noida Sector 12 Noida 💯Call Us 🔝 9582086666 🔝 South Delhi Escor...
 
Purva Palm Hills Devanahalli, Bangalore E- Brochure.pdf
Purva Palm Hills Devanahalli, Bangalore E- Brochure.pdfPurva Palm Hills Devanahalli, Bangalore E- Brochure.pdf
Purva Palm Hills Devanahalli, Bangalore E- Brochure.pdf
 
Call Girls in Khan Market 9654467111 ESCORTS SERVICE
Call Girls in Khan Market 9654467111 ESCORTS SERVICECall Girls in Khan Market 9654467111 ESCORTS SERVICE
Call Girls in Khan Market 9654467111 ESCORTS SERVICE
 
How to Build Multifamily and Laneway Suites in Toronto!! (feat. Expert Archi...
How to Build Multifamily and Laneway Suites  in Toronto!! (feat. Expert Archi...How to Build Multifamily and Laneway Suites  in Toronto!! (feat. Expert Archi...
How to Build Multifamily and Laneway Suites in Toronto!! (feat. Expert Archi...
 
Omaxe Dwarka In Delhi E Brochure Pdf
Omaxe Dwarka In Delhi E Brochure     PdfOmaxe Dwarka In Delhi E Brochure     Pdf
Omaxe Dwarka In Delhi E Brochure Pdf
 
9990771857 Call Girls in Noida Sector 11 Noida (Call Girls) Delhi
9990771857 Call Girls in Noida Sector 11 Noida (Call Girls) Delhi9990771857 Call Girls in Noida Sector 11 Noida (Call Girls) Delhi
9990771857 Call Girls in Noida Sector 11 Noida (Call Girls) Delhi
 
Call Girls in Pitampura Delhi 💯Call Us 🔝8264348440🔝
Call Girls in Pitampura Delhi 💯Call Us 🔝8264348440🔝Call Girls in Pitampura Delhi 💯Call Us 🔝8264348440🔝
Call Girls in Pitampura Delhi 💯Call Us 🔝8264348440🔝
 
call girls in Shahdara (DELHI) 🔝 >༒9953330565🔝 genuine Escort Service 🔝✔️✔️
call girls in Shahdara (DELHI) 🔝 >༒9953330565🔝 genuine Escort Service 🔝✔️✔️call girls in Shahdara (DELHI) 🔝 >༒9953330565🔝 genuine Escort Service 🔝✔️✔️
call girls in Shahdara (DELHI) 🔝 >༒9953330565🔝 genuine Escort Service 🔝✔️✔️
 
Rustomjee The Panorama At Pali Hill, Bandra West, Mumbai - Brochure.pdf
Rustomjee The Panorama At Pali Hill, Bandra West, Mumbai - Brochure.pdfRustomjee The Panorama At Pali Hill, Bandra West, Mumbai - Brochure.pdf
Rustomjee The Panorama At Pali Hill, Bandra West, Mumbai - Brochure.pdf
 
Call girls in Jeewan Park .Delhi↫8447779280↬ ꧂Escorts Service In Delhi Ncr
Call girls in Jeewan Park .Delhi↫8447779280↬ ꧂Escorts Service In Delhi NcrCall girls in Jeewan Park .Delhi↫8447779280↬ ꧂Escorts Service In Delhi Ncr
Call girls in Jeewan Park .Delhi↫8447779280↬ ꧂Escorts Service In Delhi Ncr
 
Call Girls in shastri nagar Delhi 8264348440 ✅ call girls ❤️
Call Girls in shastri nagar Delhi 8264348440 ✅ call girls ❤️Call Girls in shastri nagar Delhi 8264348440 ✅ call girls ❤️
Call Girls in shastri nagar Delhi 8264348440 ✅ call girls ❤️
 
Call Girls in Noida Sector 11 Noida 💯Call Us 🔝 9582086666 🔝 South Delhi Escor...
Call Girls in Noida Sector 11 Noida 💯Call Us 🔝 9582086666 🔝 South Delhi Escor...Call Girls in Noida Sector 11 Noida 💯Call Us 🔝 9582086666 🔝 South Delhi Escor...
Call Girls in Noida Sector 11 Noida 💯Call Us 🔝 9582086666 🔝 South Delhi Escor...
 
Call Girls in Model Town Delhi 💯Call Us 🔝8264348440🔝
Call Girls in Model Town Delhi 💯Call Us 🔝8264348440🔝Call Girls in Model Town Delhi 💯Call Us 🔝8264348440🔝
Call Girls in Model Town Delhi 💯Call Us 🔝8264348440🔝
 
83770-87607 ۞Call Girls In Near The Park Hotel (Cp) Delhi
83770-87607 ۞Call Girls In Near The Park Hotel (Cp) Delhi83770-87607 ۞Call Girls In Near The Park Hotel (Cp) Delhi
83770-87607 ۞Call Girls In Near The Park Hotel (Cp) Delhi
 
The Omaxe State Dwarka Delhi-broucher.pdf.pdf
The Omaxe State Dwarka Delhi-broucher.pdf.pdfThe Omaxe State Dwarka Delhi-broucher.pdf.pdf
The Omaxe State Dwarka Delhi-broucher.pdf.pdf
 
Aparna Greenscapes Kompally Hyderabad E - Brochure.pdf
Aparna Greenscapes Kompally Hyderabad E - Brochure.pdfAparna Greenscapes Kompally Hyderabad E - Brochure.pdf
Aparna Greenscapes Kompally Hyderabad E - Brochure.pdf
 

Missoula Market Update 1-23-2012

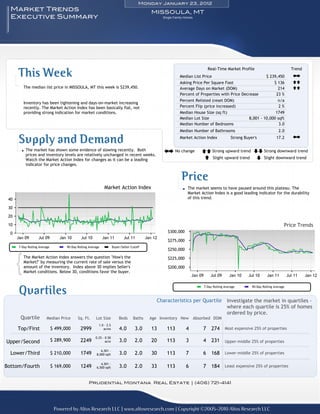
  • 1. Monday January 23, 2012 Market Trends MISSOULA, MT Executive Summary Single Family Homes This Week Real-Time Market Profile Trend Median List Price $ 239,450 ±+ Asking Price Per Square Foot $ 136 == The median list price in MISSOULA, MT this week is $239,450. Average Days on Market (DOM) 214 == Percent of Properties with Price Decrease 23 % Percent Relisted (reset DOM) n/a Inventory has been tightening and days-on-market increasing recently. The Market Action Index has been basically flat, not Percent Flip (price increased) 2% providing strong indication for market conditions. Median House Size (sq ft) 1749 Median Lot Size 8,001 - 10,000 sqft Median Number of Bedrooms 3.0 Median Number of Bathrooms 2.0 Supply and Demand Market Action Index Strong Buyer's 17.2 ±+ The market has shown some evidence of slowing recently. Both ±+ No change == Strong upward trend ≠≠ Strong downward trend prices and inventory levels are relatively unchanged in recent weeks. Watch the Market Action Index for changes as it can be a leading = Slight upward trend ≠ Slight downward trend indicator for price changes. Price Market Action Index The market seems to have paused around this plateau. The Market Action Index is a good leading indicator for the durability of this trend. Price Trends 7-Day Rolling Average 90-Day Rolling Average Buyer/Seller Cutoff The Market Action Index answers the question "How's the Market?" by measuring the current rate of sale versus the amount of the inventory. Index above 30 implies Seller's Market conditions. Below 30, conditions favor the buyer. Quartiles 7-Day Rolling Average 90-Day Rolling Average Characteristics per Quartile Investigate the market in quartiles - where each quartile is 25% of homes ordered by price. Quartile Median Price Sq. Ft. Lot Size Beds Baths Age Inventory New Absorbed DOM 1.0 - 2.5 Top/First $ 499,000 2999 acres 4.0 3.0 13 113 4 7 274 Most expensive 25% of properties 0.25 - 0.50 Upper/Second $ 289,900 2249 acre 3.0 2.0 20 113 3 4 231 Upper-middle 25% of properties 6,501 - Lower/Third $ 210,000 1749 8,000 sqft 3.0 2.0 30 113 7 6 168 Lower-middle 25% of properties 4,501 - Bottom/Fourth $ 169,000 1249 6,500 sqft 3.0 2.0 33 113 6 7 184 Least expensive 25% of properties Prudential Montana Real Estate | (406) 721-4141 Powered by Altos Research LLC | www.altosresearch.com | Copyright ©2005-2010 Altos Research LLC
  • 2. City Overview Single Family Homes in Prudential Montana Real Estate | (406) 721-4141 MISSOULA, MT This Week Real-Time Market Profile Trend The median list price in MISSOULA, Median List Price $ 239,450 ±+ MT this week is $239,450. The 452 Average List Price $ 323,586 properties have been on the market Asking Price Per Square Foot $ 136 == for an average of 214 days. Average Days on Market (DoM) 214 == Inventory of Properties Listed 452 ≠≠ Most Expensive Listing $ 3,985,000 Inventory has been tightening and Least Expensive Listing $ 45,900 days-on-market increasing recently. Average Age of Listing 30 The Market Action Index has been Percent of Properties with Price Decrease 23 % basically flat, not providing strong Percent Relisted (reset DOM) n/a indication for market conditions. Percent Flip (price increased) 2% Median House Size (sq ft) 1749 Median Lot Size 8,001 - 10,000 sqft Median Number of Bedrooms 3.0 Supply and Demand Median Number of Bathrooms 2.0 Altos Research Value Statistics The market has shown some Market Action Index Strong Buyer's 17.2 ±+ evidence of slowing recently. Both The Market Action Index answers the question "How's the Market?" by measuring the current rate of sale versus the amount of the inventory. Index above 30 prices and inventory levels are implies a seller's advantage. Below 30, conditions give the advantage to the relatively unchanged in recent buyer. weeks. Watch the Market Action Index for changes as it can be a Trend Key: == Strong upward trend ≠≠ Strong downward trend leading indicator for price changes. ±+ No change = Slight upward trend ≠ Slight downward trend Characteristics per Quartile Quartile Median Price Sq. Ft. Lot Size Beds Baths Age Inventory New Absorbed DOM 1.0 - 2.5 Top/First $ 499,000 2999 acres 4.0 3.0 13 113 4 7 274 Most expensive 25% of properties 0.25 - 0.50 Upper/Second $ 289,900 2249 acre 3.0 2.0 20 113 3 4 231 Upper-middle 25% of properties 6,501 - Lower/Third $ 210,000 1749 8,000 sqft 3.0 2.0 30 113 7 6 168 Lower-middle 25% of properties 4,501 - Bottom/Fourth $ 169,000 1249 6,500 sqft 3.0 2.0 33 113 6 7 184 Least expensive 25% of properties Page 2 of 31 Monday January 23, 2012
  • 3. Single Family Homes in City Overview Prudential Montana Real Estate | (406) 721-4141 MISSOULA, MT Median Price The market seems to have paused around this plateau. The Market Action Index is a good leading indicator for the durability of this trend. 7-day Average 90-day Average Quartile Prices Prices have settled at a price plateau across the board. Prices in all four quartiles are basically mixed. Look for a persistent shift (up or down) in the Market Action Index before prices move from these current levels. First/Top Second/Upper Third/Lower Fourth/Bottom Page 3 of 31 Monday January 23, 2012
  • 4. Single Family Homes in City Overview Prudential Montana Real Estate | (406) 721-4141 MISSOULA, MT Price per Square Foot The value placed on homes continues to increase, despite the fact that prices in general have been basically flat recently. These conditions can arise when inventory is light and more, smaller homes have more influence on overall prices. 7-day Average 90-day Average Inventory of Properties Listed for Sale Inventory has been falling in recent weeks. Note that declining inventory alone does not signal a strengthening market. Look to the Market Action Index and Days on Market trends to gauge whether buyer interest is changing with the available supply. 7-day Average 90-day Average Page 4 of 31 Monday January 23, 2012
  • 5. Single Family Homes in City Overview Prudential Montana Real Estate | (406) 721-4141 MISSOULA, MT Market Action Index The MISSOULA market is currently quite strongly in the Buyer's Advantage zone (below 30). The 90-day Market Action Index stands at 17.19. With several months of inventory available at the current sales rate, buyers should find ample choice. 90-day Average Buyers/Sellers Cutoff Market Action Index per Quartile Not surprisingly given the overall Market Action Index, all quartiles are in the Buyer's Market zone with several months of inventory given the current rate of demand for homes in the quartile. Watch the quartile for changes before the overall market shifts. Often one end of the market (e.g. the low end) will improve and signal a strengthening market before the whole group changes. First/Top Second/Upper Third/Lower Fourth/Bottom Buyers/Sellers Cutoff Residential house prices are a function of supply and demand, and market conditions can be characterized by analyzing those factors. Watch this index for sustained changes: if the index falls into the Buyer’s Advantage zone (below 30) for a long period, prices are likely in for a downward correction. Page 5 of 31 Monday January 23, 2012
  • 6. Single Family Homes in City Overview Prudential Montana Real Estate | (406) 721-4141 MISSOULA, MT Days on Market The properties have been on the market for an average of 214 days. Half of the listings have come newly on the market in the past 152 or so days. 7-day Average 90-day Average Days on Market per Quartile It is not uncommon for the higher priced homes in an area to take longer to sell than those in the lower quartiles. First/Top Second/Upper Third/Lower Fourth/Bottom Page 6 of 31 Monday January 23, 2012
  • 7. Monday January 23, 2012 Market Trends MISSOULA, MT Executive Summary Condos - Townhomes This Week Real-Time Market Profile Trend Median List Price $ 179,900 == Asking Price Per Square Foot $ 139 == The median list price in MISSOULA, MT this week is $179,900. Average Days on Market (DOM) 255 == Percent of Properties with Price Decrease 18 % Percent Relisted (reset DOM) n/a Inventory has been decreasing lately but the Market Action Index is falling also. With days-on-market climbing, these are relatively Percent Flip (price increased) 0% negative implications for the market. Median House Size (sq ft) 1249 Median Number of Bedrooms 2.0 Median Number of Bathrooms 2.0 Market Action Index Strong Buyer's 10.9 ≠≠ Supply and Demand In terms of supply and demand, the market is getting cooler - more ±+ No change == Strong upward trend ≠≠ Strong downward trend supply is coming on the market relative to the sales demand. However, in recent weeks prices have been moving higher. Since it is = Slight upward trend ≠ Slight downward trend technically a Buyer's market, this price trend may be a result of improved quality (newer, larger homes) of the homes being listed. Look at the descriptive statistics where you may notice the homes being listed are larger and younger than they have been in the past. Price Market Action Index Price trends continued their recent uptrend this week. While still below the market's price high-point, we've seen a nice run recently. Price Trends 7-Day Rolling Average 90-Day Rolling Average Buyer/Seller Cutoff The Market Action Index answers the question "How's the Market?" by measuring the current rate of sale versus the amount of the inventory. Index above 30 implies Seller's Market conditions. Below 30, conditions favor the buyer. Quartiles 7-Day Rolling Average 90-Day Rolling Average Characteristics per Quartile Investigate the market in quartiles - where each quartile is 25% of homes ordered by price. Quartile Median Price Square Feet Beds Baths Age Inventory New Absorbed DOM Top/First $ 375,000 2249 3.0 2.2 4 29 0 0 488 Most expensive 25% of properties Upper/Second $ 210,000 1249 2.0 2.0 18 30 3 0 187 Upper-middle 25% of properties Lower/Third $ 161,950 1249 2.0 1.8 4 30 0 0 180 Lower-middle 25% of properties Bottom/Fourth $ 125,750 999 2.0 1.0 10 30 0 2 174 Least expensive 25% of properties Prudential Montana Real Estate | (406) 721-4141 Powered by Altos Research LLC | www.altosresearch.com | Copyright ©2005-2010 Altos Research LLC
  • 8. City Overview Condos & Townhomes in Prudential Montana Real Estate | (406) 721-4141 MISSOULA, MT This Week Real-Time Market Profile Trend The median list price in MISSOULA, Median List Price $ 179,900 == MT this week is $179,900. The 119 Average List Price $ 226,840 properties have been on the market Asking Price Per Square Foot $ 139 == for an average of 255 days. Average Days on Market (DoM) 255 == Inventory of Properties Listed 119 ≠≠ Most Expensive Listing $ 667,500 Inventory has been decreasing lately Least Expensive Listing $ 77,500 but the Market Action Index is falling Average Age of Listing 21 also. With days-on-market climbing, Percent of Properties with Price Decrease 18 % these are relatively negative Percent Relisted (reset DOM) n/a implications for the market. Percent Flip (price increased) 0% Median House Size (sq ft) 1249 Median Number of Bedrooms 2.0 Median Number of Bathrooms 2.0 Supply and Demand Altos Research Value Statistics Inventory levels have been relatively Market Action Index Strong Buyer's 10.9 ≠≠ consistent relative to sales. Despite The Market Action Index answers the question "How's the Market?" by measuring the current rate of sale versus the amount of the inventory. Index above 30 the fact that there is a relatively implies a seller's advantage. Below 30, conditions give the advantage to the high amount of available inventory, buyer. this Buyer's market is still seeing prices move higher. Given inventory Trend Key: == Strong upward trend ≠≠ Strong downward trend levels, these price conditions are ±+ No change = Slight upward trend ≠ Slight downward trend relatively fragile. If the market cools off further, the price trend is likely to reverse. Characteristics per Quartile Quartile Median Price Sq. Ft. Beds Baths Age Inventory New Absorbed DOM Top/First $ 375,000 2249 3.0 2.2 4 29 0 0 488 Most expensive 25% of properties Upper/Second $ 210,000 1249 2.0 2.0 18 30 3 0 187 Upper-middle 25% of properties Lower/Third $ 161,950 1249 2.0 1.8 4 30 0 0 180 Lower-middle 25% of properties Bottom/Fourth $ 125,750 999 2.0 1.0 10 30 0 2 174 Least expensive 25% of properties Page 2 of 26 Monday January 23, 2012
  • 9. Condos & Townhomes in City Overview Prudential Montana Real Estate | (406) 721-4141 MISSOULA, MT Median Price Price trends continued their recent uptrend this week. While still below the market's price high-point, we've seen a nice run recently. 7-day Average 90-day Average Quartile Prices Prices have settled at a price plateau across the board. Prices in all four quartiles are basically mixed. Look for a persistent shift (up or down) in the Market Action Index before prices move from these current levels. First/Top Second/Upper Third/Lower Fourth/Bottom Page 3 of 26 Monday January 23, 2012
  • 10. Condos & Townhomes in City Overview Prudential Montana Real Estate | (406) 721-4141 MISSOULA, MT Price per Square Foot The market appears to be placing an increasing premium on homes. When list prices and price per square foot consistently increase in tandem, as they're doing now, you can often find short-term investment opportunities. Watch the Market Action Index for persistent changes as a leading indicator for these trends to flatten or drop. 7-day Average 90-day Average Inventory of Properties Listed for Sale Inventory has been falling in recent weeks. Note that declining inventory alone does not signal a strengthening market. Look to the Market Action Index and Days on Market trends to gauge whether buyer interest is changing with the available supply. 7-day Average 90-day Average Page 4 of 26 Monday January 23, 2012
  • 11. Condos & Townhomes in City Overview Prudential Montana Real Estate | (406) 721-4141 MISSOULA, MT Market Action Index The MISSOULA market is currently quite strongly in the Buyer's Advantage zone (below 30). The 90-day Market Action Index stands at 10.94. With several months of inventory available at the current sales rate, buyers should find ample choice. 90-day Average Buyers/Sellers Cutoff Market Action Index per Quartile Not surprisingly given the overall Market Action Index, all quartiles are in the Buyer's Market zone with several months of inventory given the current rate of demand for homes in the quartile. Watch the quartile for changes before the overall market shifts. Often one end of the market (e.g. the low end) will improve and signal a strengthening market before the whole group changes. First/Top Second/Upper Third/Lower Fourth/Bottom Buyers/Sellers Cutoff Residential house prices are a function of supply and demand, and market conditions can be characterized by analyzing those factors. Watch this index for sustained changes: if the index falls into the Buyer’s Advantage zone (below 30) for a long period, prices are likely in for a downward correction. Page 5 of 26 Monday January 23, 2012
  • 12. Condos & Townhomes in City Overview Prudential Montana Real Estate | (406) 721-4141 MISSOULA, MT Days on Market The properties have been on the market for an average of 255 days. Half of the listings have come newly on the market in the past 162 or so days. 7-day Average 90-day Average Days on Market per Quartile It is not uncommon for the higher priced homes in an area to take longer to sell than those in the lower quartiles. First/Top Second/Upper Third/Lower Fourth/Bottom Page 6 of 26 Monday January 23, 2012