
Recomendados

Recomendados
Más contenido relacionado
La actualidad más candente
La actualidad más candente (19)
Destacado
Destacado (9)
Similar a Luminescent bacteria test aditya parmar
Similar a Luminescent bacteria test aditya parmar (20)
Último
Último (20)
Luminescent bacteria test aditya parmar
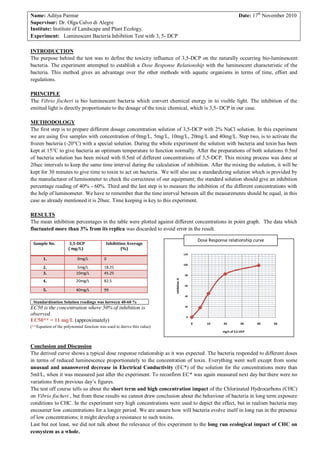
- 1. Name: Aditya Parmar Date: 17th November 2010 Supervisor: Dr. Olga Calvo di Alegre Institute: Institute of Landscape and Plant Ecology. Experiment: Luminescent Bacteria Inhibition Test with 3, 5- DCP INTRODUCTION The purpose behind the test was to define the toxicity influence of 3,5-DCP on the naturally occurring bio-luminescent bacteria. The experiment attempted to establish a Dose Response Relationship with the luminescent characteristic of the bacteria. This method gives an advantage over the other methods with aquatic organisms in terms of time, effort and regulations. PRINCIPLE The Vibrio fischeri is bio luminescent bacteria which convert chemical energy in to visible light. The inhibition of the emitted light is directly proportionate to the dosage of the toxic chemical, which is 3,5- DCP in our case. METHODOLOGY The first step is to prepare different dosage concentration solution of 3,5-DCP with 2% NaCl solution. In this experiment we are using five samples with concentration of 0mg/L, 5mg/L, 10mg/L, 20mg/L and 40mg/L. Step two, is to activate the frozen bacteria (-20°C) with a special solution. During the whole experiment the solution with bacteria and toxin has been kept at 15°C to give bacteria an optimum temperature to function normally. After the preparations of both solutions 0.5ml of bacteria solution has been mixed with 0.5ml of different concentrations of 3,5-DCP. This mixing process was done at 20sec intervals to keep the same time interval during the calculation of inhibition. After the mixing the solution, it will be kept for 30 minutes to give time to toxin to act on bacteria. We will also use a standardizing solution which is provided by the manufacturer of luminometer to check the correctness of our equipment; the standard solution should give an inhibition percentage reading of 40% - 60%. Third and the last step is to measure the inhibition of the different concentrations with the help of luminometer. We have to remember that the time interval between all the measurements should be equal, in this case as already mentioned it is 20sec. Time keeping is key to this experiment. RESULTS The mean inhibition percentages in the table were plotted against different concentrations in point graph. The data which fluctuated more than 3% from its replica was discarded to avoid error in the result. Dose Response relationship curve Sample No. 3,5-DCP Inhibition Average ( mg/L) (%) 120 1. 0mg/L 0 100 2. 5mg/L 18.25 3. 10mg/L 45.25 80 inhibition % 4. 20mg/L 82.5 60 5. 40mg/L 99 40 Standardisation Solution readings was between 40-60 % 20 EC50 is the concentration where 50% of inhibition is observed. 0 EC50** = 11 mg/L (approximately) 0 10 20 30 40 50 (**Equation of the polynomial function was used to derive this value) mg/L of 3,5-DCP Conclusion and Discussion The derived curve shows a typical dose response relationship as it was expected. The bacteria responded to different doses in terms of reduced luminescence proportionately to the concentration of toxin. Everything went well except from some unusual and unanswered decrease in Electrical Conductivity (EC*) of the solution for the concentrations more than 5ml/L, when it was measured just after the experiment. To reconfirm EC* was again measured next day but there were no variations from previous day’s figures. The test off course tells us about the short term and high concentration impact of the Chlorinated Hydrocarbons (CHC) on Vibrio fischeri , but from these results we cannot draw conclusion about the behaviour of bacteria in long term exposure conditions to CHC. In the experiment very high concentrations were used to depict the effect, but in realism bacteria may encounter low concentrations for a longer period. We are unsure how will bacteria evolve itself in long run in the presence of low concentrations; it might develop a resistance to such toxins. Last but not least, we did not talk about the relevance of this experiment to the long run ecological impact of CHC on ecosystem as a whole.