SlideShare a Scribd company logo
1 of 6
Download to read offline
Commerce Quarterly Trade Bulletin
                                                                                                                                                                                          Vol. 2, No.3, September 2010

    As the global economy continues to sputter along at an ane-                                                                           quarterly year-over-year basis, varied between 81.9% growth (Q1
mic pace, trade tensions are inevitably on the rise. In early Sep-                                                                        2008) and 15.6% contraction (Q1 2007). While the exchange rate
tember, the United Steelworkers union filed a formal, 5,800 page                                                                          does affect exports, there are many other mitigating factors that
complaint to the Obama administration requesting action on al-                                                                            influence total export flows. In the case of our non-aerospace,
leged illegal trade subsidies and other World Trade Organization                                                                          non-agriculture exports, a large portion of these are technology
(WTO) violations by China in support of its (fast growing) clean                                                                          exports, which may be less sensitive to exchange rate fluctuations
energy sector. On September 14, the administration filed two for-                                                                         than other merchandise goods and commodities. Lag times be-
mal complaints to the WTO, on payment-processing companies                                                                                tween product orders and deliveries also play an important part.
and steel duties. While these issues are federal, Washington state                                                                        Agriculture exports exhibited more consistent year-over-year
has a real stake in the outcome of these disputes over unfair trade                                                                       growth, with only two quarters between Q1 2006 and Q3 2008
policies. China has been our state’s second largest market for non-                                                                       exhibiting negative growth in exports to China (a 22.4% decline
aerospace, non-agriculture products; exports in this grouping                                                                             in Q1 2006, and 26.8% decline in Q3 2006).
reached more than $971.3 million in the first half of 2010, a 35.8%
increase over H1 2009. And despite the Chinese government’s                                                                               Trends through the First Half of 2010
announcement in June that it will allow the renminbi (RMB) to                                                                                Total exports increased 1.8% quarter-over-quarter in Q2,
fluctuate within a wider daily band, the currency has appreciated                                                                         though the non-aerospace, non-agriculture exports (using the
only 1.8% against the dollar since then. In Japan, the govern-                                                                            crude acronym “NANA”) grouping fell 3.6% over the previous
ment’s unilateral decision to intervene in currency markets for the                                                                       quarter, following a 2.3% quarter-over-quarter drop in Q1. How-
first time in more than six years to weaken the yen (in response                                                                          ever, seasonality may have played a role—comparing year-over-
to strengthening of the yen due to Chinese large-scale purchas-                                                                           year, Q2 2010 NANA exports were 25% above Q2 2009. While im-
ing of Japanese government securities) is perhaps a sign of things                                                                        pressive, this actually lagged overall U.S. NANA export growth in
to come over the next 6–12 months. Yet despite all this, after a                                                                          Q2, which surged to 30.6% over the same quarter in 2009 (Figure
12.2% contraction in global merchandise trade volumes in 2009,                                                                            1). Roughly 60.6% of the decline in exports from Q1 to Q2 can
the WTO now forecasts a record 13.5% year-over-year increase in                                                                           be attributed to declines in three markets: Japan (30.3% of total
2010.1                                                                                                                                    declines in exports), Chile (21.9%), and Mexico (8.4%); overall, ex-
    How much does China’s exchange rate affect Washington’s                                                                               ports to these markets collectively declined 40% from Q1 2010.
exports? From Q1 2005 to Q4 2008, the Chinese RMB nominally                                                                               Exports to Taiwan, however, grew 32.5% from Q1 to Q2, reaching
appreciated roughly 21.1% against the U.S. dollar. During this pe-                                                                        $210.5 million (Figure 2).
riod, Washington’s non-aerospace, non-agriculture exports, on a

       Year-over-Year Change in Non-aero-
Figure 1.                                                                                                                                       Washington’s Top Non-aerospace,
                                                                                                                                          Figure 2.
Figure 1. Year-Over-Year Change in NANA                                                                                                               Figure 2. Washington's Top Five Markets, Q2 2010
space, Non agriculture Exports (NANA)
by Quarter 2007-2010                                                                                                                      Non-agriculture Markets (NANA), Q2 2010
                                                                                                                                                      Non-Aerospace, Non-Agriculture Goods (NANA)

                   Washington                    U.S.                                 Data source: WISER Trade                                                        Q2 2010            Q2 2009         Data source: WISER Trade

40%                                                                                                                                                                                                                       1,318.9
                                                                                                                                           CanadaCanada                                                      1,039.0
30%
                                                                                                                                                                                    482.1
20%                                                                                                                                          China        China
                                                                                                                                                                                 396.7
10%
                                                                                                                                                                                 378.1
    0%
                                                                                                                                             Japan        Japan
                                                                                                                                                                               324.9
-10%                                                                                                                                                                   203.1
                                                                                                                                            Korea,
                                                                                                                                           Korea, Republic Of
                                                                                                                                                                      159.5
                                                                                                                                            Republic of
-20%
                                                                                                                                                                    210.5
-30%                                                                                                                                        TaiwanTaiwan          129.5
-40%
                                                                                                                                                                  0                          500                  1,000             1,500
          Q1 '07

                     Q2 '07

                              Q3 '07

                                       Q4 '07

                                                Q1 '08

                                                         Q2 '08

                                                                  Q3 '08

                                                                           Q4 '08

                                                                                    Q1 '09

                                                                                             Q2 '09

                                                                                                      Q3 '09

                                                                                                               Q4 '09

                                                                                                                        Q1 '10

                                                                                                                                 Q2 '10


                                                                                                                                                                                                   Millions USD


1
    World Trade Organization, “Press release: Trade likely to grow by 13.5% in 2010, WTO says,” 20 September 2010.


                                                                                                                                                                  Commerce Quarterly Trade Bulletin, September 2010 | 01
Among Washington’s top ten largest NANA exports in Q2 2010, in 2009. Between Q3 2006 and Q2 2010, China has ranked as Wash-
the largest year-over-year increases were in iron and steel ($436.2 ington’s largest aerospace export market for nine quarters, includ-
million, 70.6% increase over Q2 2009); wood and articles of wood ing the last three. More to the point, over this time span, aerospace
($586.6 million, 53.7%); industrial machinery, including computers exports to China constituted nearly 15% of all Washington’s aero-
($955.5 million, 38.5%); inorganic chemicals, precious & rare earth space exports. China has also purchased nearly $4 billion in aero-
metals and radioactive compounds ($602.5 million, 31.4%); and space goods from Washington state over the past four quarters.
vehicles and parts, excluding railway or tramways ($227.2 million,                     A more interesting breakdown disaggregates export flows by
23.1%). Aerospace exports grew 5.6% over the previous quarter, country and product. The single largest NANA export flow through
but were 20.4% below exports sales for the same period in 2009. the first half of 2010, was for mineral fuels and oils to Canada
Comparing the first half of 2010 with the same period in 2009, ($573.8 million). This was followed by exports, also to Canada, of
Washington’s NANA exports grew 27.8%, and each of the top five industrial machinery ($258.2 million) and electrical machinery
markets in H1 exhibited a minimum of 20.5% growth over H1 2009, and sound equipment ($222.0 million); and exports to Japan of
led by Taiwan at nearly 107%. In terms of gross increases by prod- inorganic chemicals, precious & rare earth metals and radioactive
uct category, aerospace was the largest single contributor (28.5%), compounds ($215.2 million), and wood and wood articles ($189.4
followed by wood and wood articles (7.8%), industrial machinery, million).
including computers (5.7%), and wheat and meslin (4.4%). The larg-
est drags on growth, measured by their quarter-over-quarter net
loss as a share of gross loss, were mineral fuels and oils (a decline of
$317.8 million, or 49.7% gross losses by product) and pharmaceuti-
cals (decline of $172.0 million, 26.9% of gross losses).                          Figure 3. Major Technology Exports
    Tech exports, using the definition developed by TechAmerica                                                            Q2 2010  Q2 2009        Data source: WISER Trade
(for a full description, see our December 2009 edition, footnotes 8
                                                                                           Ultrasonic scanningscanning
                                                                                               Ultrasonic apparatus                                                114.6
and 9), increased 0.3% from Q1 to Q2, though they were 17.0% over                                        apparatuses                                         102.5

the same period in 2009 (Figure 3). Ultrasonic scanning apparatus                           TV receivers, including                                         96.7
                                                                                                video monitors and
                                                                     TV receivers, including video monitors & projectors
was the largest tech export in Q2 2010, reaching $114.7 million—                                             projectors                                   93.6
                                                                                              Electronic integrated                                 75.8
though this was 7.6% below exports in Q1 2010, and the lowest                           circuits & microassembly
                                                               Electronic integrated circuits & microassembly and parts
                                                                                                             and parts                     59.1
quarterly amount since Q2 2009. Television receivers (including                       Automatic data processing                                   72.4
                                                                                          machines and magnetic
                                                               Automatic data process machines and magnetic readers
video monitors and receivers) grew 32.1% over Q1 reaching $96.7                                                 readers                   55.6

million, followed by electric integrated circuits and micro-assembly                     Oscilloscopes, spectrum
                                                                            Oscilloscopes, spectrum analyzers, andparts
                                                                                                                                        53.6
                                                                                               analyzers, and parts                41.0
parts ($75.8 million, a 15.9% increase over Q1) and automatic data
                                                                                                                         0             40                80              120
processing machines and magnetic readers ($72.4 million; 18.0%                                                                               Millions
                                                                                                                                           Millions USD
decline over Q1, but a 30.2% year-over-year increase over Q2 2009).
    Aerospace exports grew 5.6% quarter-over-quarter in Q2,
though this was 20.5% below export flows during the same period


Market Focus: Brazil
    Often lost in the discussions over China and India is the emer-                    Economic Overview
gence of Brazil as the “other” engine of global growth in the twenty-                      Brazil is the largest economy in South America and eighth larg-
first century. More than the other “BRIC” countries (Brazil, Russia, In-               est in the world as measured by gross domestic product (GDP). Af-
dia, and China), Brazil is perhaps best positioned as a natural trade                  ter a difficult period of hyperinflation in the 1990s (2,477% in 1993),
partner with the United States: a per capita GDP twice that of China,                  Brazil has made significant strides and has emerged as a major in-
close proximity to the United States, and arguably the “freest” and                    ternational hub for clean energy, information and communication
most market-oriented economy of the four. In this edition of the                       technologies (ICT), and biotechnology in recent years. In recent de-
trade bulletin, we take a closer look at Brazil and opportunities for                  cades, aircraft manufacturer Embraer has grown into a world-rec-
Washington exporters in the near and medium term.                                      ognized original equipment manufacturer (OEM) of business and


                                                                                                           Commerce Quarterly Trade Bulletin, September 2010 | 02
regional jets. Brazil is also home to forty-five of the top fifty largest       ery, electrical and transport equipment, chemical products, oil,
multinational companies in the world. The country is a leading ex-              automotive parts, and electronics.6 In 2008, machinery and elec-
porter of coffee, soy beans, beef, poultry, sugar, and orange juice. In         trical equipment accounted for 26.49% of Brazil’s imports, oil and
the clean energy space, roughly 75% of Brazil’s entire grid is pow-             derivatives for 18.17%, chemical products for 14.25%, and transport
ered by hydro, and 50% of all cars on the road use biofuels. In ad-             equipment and parts for 12.6%.7
dition to Embraer, major Brazilian multinationals include Petrobras,
Vale, CSN, Gerdau, Aracruz, Suzano, Sadia, Imbev, Itau/Unibanco,                Information Technology
and Bradesco. Per capita GDP adjusted for purchasing power par-                     Brazil’s IT sector is the eighth largest in the world and largest in
ity was US $10,100 in 2009. With a cumulative stock of US $319.9                Latin America. Notable firms with operations in the United States
billion in inbound foreign direct investment (FDI) as of the end of             include BRQ, Ci&T, CPM Braxis, Politec, Stefanini, TOTVS, and Spring
2009, Brazil ranks thirteenth in the world for investment attraction.2          Wireless (with their U.S. headquarters in Seattle). There are more
    With a population of roughly 200 million, Brazil is the fifth most          than 1.7 million IT professionals; each year another 100,000 new
populous country in the world.3 About 10% of their total popula-                professionals enroll in IT-related courses. Last year, the Brazilian IT
tion in 2009 was over 60 years of age, with this forecasted to increase         market was worth US $31.0 billion, constituting 3% of the coun-
to 29% by 2050. The old age support ratio for 2009 showed ten                   try’s gross domestic product (GDP). Roughly 35% of the sector is
working people (aged 15–64) for every retired person (aged 65+).                in IT services, with the business process outsourcing (BPO) market
However, the forecast for 2050 showed only three working people                 worth US $4.5 billion. For 2010, the IT market growth is forecasted
for every retired person—a decline of more than half.4 The Econo-               to expand 15%, with total IT exports expected to reach US $3.5 bil-
mist Intelligence Unit’s 10 year forecast shows a general downward              lion. And despite the recent slowdown in the Brazilian economy,
trend in GDP growth; a predicted drop from 7.8% in 2010 to 4.5%                 the Brazilian IT industry thrived, growing by 7.8% (software, hard-
in 2011, then a slight increase to 4.7% in 2013, followed by a steady           ware, and services) in 2008.8
and gradual decline to 3.3% by 2020.5 The IMF’s estimates are
similar, with GDP growing 7.1% in 2010 and 4.2% in 2011. Drivers                Global Recession and Recovery
of economic growth over the next 10 years include Brazil’s exports                  Brazil’s economy contracted by 0.2% in 2009. The World Bank es-
of commodities to China, the country’s leading ethanol production               timates Brazil’s current account deficit increased in 2009, though as
industry, continuing growth in information technology, and the                  a percentage of GDP, it declined from 3.3% to 3.2%. Foreign direct
presalt oil reserves off the coast of Brazil. In preparation for the 2014       investment dropped from US $42 billion in 2008 to US $25.9 billion
World Cup and 2016 Summer Olympics, the Brazilian government                    in 2009. There was a significant reduction of investment during the
will spend close to US $100 billion on infrastructure and other in-             deepest throes of the recession, including a 30% reduction of in-
vestments.                                                                      vestment into Brazil’s mining sector. However, Brazil was in recovery
    Brazil’s biggest import partner is the United States, accounting            position by the end of 2009—faster than most major economies.9
for 16.12% of all imports. China, at 12.61% of imports, Argentina,
at 8.77%, Germany, at 7.65%, and Japan, at 4.3%, follow on the list
of Brazil’s main import partners. Brazil’s main imports are machin-


Washington Exports to Brazil
     In 2009, Washington’s exports to Brazil totaled $836.1 million.            port markets, 2008 was a peak year for sales, followed by a contrac-
This was more than 17% below 2008 export levels, but still the sec-             tion in 2009 (Figure 4). Nonetheless, exports to Brazil have been
ond highest annual total recorded between Washington and Bra-                   on the upswing for some time now, with a per annum growth rate
zil. As seen with many markets, the largest single export good was              of 4.3% seen from 2001 to 2009. If we stretch our period of interest
aerospace products, totaling $659.2 million in 2009, and constitut-             to 2000–2009, exports have grown on average more than 28.1%
ing 78.1% of all exports to Brazil. This was down from $807.8 million           per year, though much of this follows the volatile ups and downs of
in 2008, an 18.4% decline. As with many of Washington’s major ex-               aerospace exports.

2
  Central Intelligence Agency, World Factbook.
3
  Central Intelligence Agency, World Factbook, July 2010.
4
  United Nations, Population Ageing and Development, 2009.
5
  Economist Intelligence Unit, Country Data, August 2010.
6
  Central Intelligence Agency, World Factbook, 2009.
7
  Economist Intelligence Unit, Country Data, August 2010.
8
  Brazilian Association of Information Technology and Communication Companies (Brasscom).
9
  US Department of State and US & Foreign Commercial Service, “Doing Business in Brazil: 2010 Country Commercial Guide for US Companies,” 2010.

                                                                                                  Commerce Quarterly Trade Bulletin, September 2010 | 03
As we often do in this bulletin, we prefer to look at the NANA                                       million; 14.2% growth).
export segment of Washington’s exports portfolio. Exports in this                                            Brazil ranked as Washington’s second largest export market in
grouping increased every year from 2005 to 2008. Even in 2009, to-                                       South America in 2009, just slightly behind Chile; this was true for
tal NANA goods exports were the second highest on record, reach-                                         both total exports and after removing aerospace products. How-
ing $162.3 million.                                                                                      ever, 2009 was the first year Brazil was not Washington’s top export
    The largest NANA exports by product type in 2009 were: (1)                                           market in the region for non-aerospace goods, owing more to sig-
petroleum coke ($64.5 million; 12.9% year-over-year increase);                                           nificant growth in the Chilean market than to a decrease in exports
(2) voice/data/imaging and data machines ($10.6 million; 143.4%                                          to Brazil (though exports did decline from 2008, they were still well
growth); (3) ultrasonic scanning apparatuses ($9.3 million; decline                                      above previous years). Over the past ten years, Brazil and Chile have
of 37.0%); (4) fork lifts and work trucks ($8.4 million; decline of                                      frequently swapped positions as Washington’s top NANA export
75.2%); and (5) relays for voltage between 60 and 100 volts ($7.4                                        market in the region.

Figure 4.                     Brazil: Brazil: Economic Growth and Washington Exports
                                      Economic Growth and Washington Exports
                              Figure 4.
                               Data source: WISER Trade and International Monetary Fund (IMF)

                                      Gross domestic product based on purchasing-power-parity (PPP) valuation of country GDP          Washington exports to Brazil      NANA exports

                              2500                                                                                                                                           1,200


                                                                                                                                                                             1,000


                                                                                                                                                                                             Millions USD
                              2000
      PPP GDP (US billions)


                                                                                                                                                                             800
     PPP GDP(Billions USD)


                              1500


                                                                                                                                                                                     Millions USD
                                                                                                                                                                             600

                              1000
                                                                                                                                                                             400

                               500
                                                                                                                                                                             200


                                  0                                                                                                                                          0
                                          1996    1997      1998     1999     2000      2001     2002     2003      2004       2005     2006      2007     2008      2009


New Exporter Profile: Flux Drive
   In September, we spoke with Libby Dunkin, Vice President for                                           Flux Drive Flexible Coupling line is designed for soft starting con-
Operations at Sumner, WA-based Flux Drive. Flux Drive is a small                                          stant speed applications. Both the ASD and Coupling product lines
engineering design and new manufacturing firm specializing in                                             can be installed in-line between the motor and load or can be belt
magnetic couplings for industrial- and heavy-load motors used un-                                         driven. Flux Drive’s orders are split roughly 50-50 between retrofits
der harsh conditions. After several years of in-house testing and                                         and new applications.
design, Flux Drive began business operations in 2007, and currently                                          Earlier this year, after placing a free company listing in a global
employs eight full time equivalents (FTEs). Their main product is                                         business supplier catalogue, Flux Drive was contacted by Vulcan In-
the Adjustable Speed Drive (ASD), designed for soft-start and vari-                                       dustries, a large Brazilian original equipment manufacturer (OEM)
able speed mechanical applicants. Flux Drive has developed two                                            specializing in the assembly and some component manufacture of
product lines that offer industry the benefits associated with this                                       motors used in mining and agriculture applications. Brazil’s agricul-
power transmission technology. The Flux Drive Adjustable Speed                                            ture and mining industries, while sizable, still use many antiquated
Drive (ASD) is designed for variable speed applications while the                                         technologies, including hydraulic couplings in heavy-load motors.


                                                                                                                               Commerce Quarterly Trade Bulletin, September 2010 | 04
Flux Drive’s magnetic couplings can be retrofitted onto older mo-               new to the export of an actual product. As a small company with
tors, are far more energy efficient, and significantly reduce mainte-           little exporting experience, Flux Drive lacked the clout needed to
nance costs and ecological and environmental damage compared                    navigate through Brazil’s labyrinthine system of import product
with hydraulic couplings. Vulcan has since visited Washington                   codes and tariffs. To get around this, the company arranged for
twice and has placed two initial orders for Flux Drive’s magnetic               Vulcan to purchase the couplings in Washington and then assume
couplings.                                                                      the responsibility of importer, including the use of their own freight
   Flux Drive has done overseas services work in the past, but is               forwarder.


Trade Issues: Brazil
    Probably the biggest trade issue with Brazil involves the U.S.              countries approved tariff increases for hundreds of products in the
compliance with a WTO panel ruling against U.S. cotton subsidies.               CET, including dairy, textiles, bags, backpacks, and suitcases. Bot-
The question is whether the deal to postpone the imposition of                  tom line: There is quite a bid of uncertainty on tariffs. Brazil applies
retaliatory duties on U.S. products will hold. Brazil and the United            federal and state taxes and charges to imports that can effectively
States reached a deal on June 17, 2010, under which Brazil agreed               double the actual cost of importing products into Brazil.
to refrain from imposing $830 million in annual sanction on U.S. im-
ports as a result of the U.S. failure to comply with a WTO dispute              Government procurement
panel against U.S. subsidies for cotton growers. The sanctions will                 Brazil is not a signatory to the WTO Government Procurement
remain suspended until 2012 when the United States will adopt a                 Agreement, which precludes discrimination against goods and
new farm bill establishing agricultural spending for the next 5 years.          services from other signatory countries. As a result, U.S. compa-
In return, the United States agreed to continue financing a national            nies have found it difficult to participate in Brazil’s public sector
fund that will pay out $147 million annually in financial technical as-         procurement unless they are associated with a local firm. Without
sistance for Brazilian cotton farms. The United States also agreed to           a substantial presence in Brazil, U.S. companies frequently face sig-
add additional restrictions to the GSM-12 export credit guarantee               nificant obstacles in winning government contracts. They are usu-
program to minimize their subsidization impacts.                                ally more successful in subcontracting with larger Brazilian firms.
    Brazil has recently removed import duties on aircraft, flight               Note that in July 2010, there was a Brazilian decree establishing a
simulators, and all aeronautical equipment and spares. The govern-              “Buy Brazil” policy for government purchases. The decree allows the
ment also reduced the import duty from 14% to 2% on 410 capital                 government to favor domestic suppliers over foreign firms even if
goods items, including IT and telecommunication products. This                  the Brazilian company prices are up to 25% higher. In addition, the
reduction is due to expire on June 30, 2012.10                                  decree states that the government may designate goods and ser-
                                                                                vices in the areas of information technology and communications
Tariffs                                                                         as “strategic” and require that a supplier use technology developed
     In 2009, Brazilian tariffs ranged from 0% to 35%, with an average          in Brazil.
applied tariff rate of 11.5%. However, Brazil’s average bound tariff,
i.e., the rate that generally cannot be exceeded under WTO rules, is            Intellectual property rights (IPR) protection
significantly higher at 31.4%. Given the large gap between bound                   IPR piracy continues to be major issue, although Brazil has made
and applied duties, U.S. exporters face quite a bit of uncertainty in           important progress in enhancing the effectiveness of intellectual
terms of tariffs because Brazil is allowed to raise the applied rate            property enforcement, particularly with respect to pirated audio-
up to the bound level. Brazil has used this flexibility on many occa-           visual goods. Among other things, the U.S. Trade Representative
sions to increase tariffs. For example, in August and September of              (USTR) has urged Brazil to increase raids and seizures of pirated and
2009, the country raised tariffs by as much as 14 percentage points             counterfeit products, and increase actions against book and Inter-
on several industrial products including industrial fatty alcohols, re-         net piracy. The United States is also concerned with patent protec-
fractory bricks, valves for oleohydraulic or pneumatic transmissions,           tion for pharmaceuticals and medical devices, including with re-
and parts of electric appliances.                                               spect to the role of Brazil’s health authority (ANVISA) in the patent
     Brazil is a member of the MERCOSUR common market which                     application process; inadequate protection against unfair commer-
includes Argentina, Paraguay, and Uruguay. MERCOSUR maintains                   cial use of undisclosed test and other data generated to obtain mar-
a Common External Tariff (CET) which averages 11.5%, but ranges                 keting approval for human-use pharmaceutical products; and an
from 0% to 35% ad valorem. MERCOSUR currently is allowed to                     inter-ministerial decision against granting patents for polymorphs
maintain 93 exceptions to the CET. Brazil recently used these excep-            and second-use inventions.
tions on some steel products. In December 2009, all MERCOSUR

10
     Mike Godfrey, “Brazil Cuts Import Tariffs,” Tax-news.com,10 August 2010.
                                                                                                Commerce Quarterly Trade Bulletin, September 2010 | 05
How Washington State Can Help You Export

The Washington State Department of Commerce provides free export assistance for Washington state companies, including client
searches, export leads, and consultation on a variety of export-related issues. For export-related inquiries, please contact Mark Calhoon,
Managing Director for International Trade, mark.calhoon@commerce.wa.gov.


Inquiries on trade data and activities can be sent to:

Washington State Department of Commerce

Attn Spencer Cohen
Research Manager
2001 Sixth Avenue, Suite 2600
Seattle, WA 98121
spencer.cohen@commerce.wa.gov
Phone: (206) 256-6100


                                                                                       Commerce Quarterly Trade Bulletin, September 2010 | 06

More Related Content

What's hot

Quarterly Report Perspectives Spanish and Global Economy Q3-2020
Quarterly Report Perspectives Spanish and Global Economy Q3-2020Quarterly Report Perspectives Spanish and Global Economy Q3-2020
Quarterly Report Perspectives Spanish and Global Economy Q3-2020Círculo de Empresarios
 
Patterns of Economic Growth of the Brazilian Economy 1970-2007: Demand led gr...
Patterns of Economic Growth of the Brazilian Economy 1970-2007: Demand led gr...Patterns of Economic Growth of the Brazilian Economy 1970-2007: Demand led gr...
Patterns of Economic Growth of the Brazilian Economy 1970-2007: Demand led gr...Grupo de Economia Política IE-UFRJ
 
Paper on Inter-Asian Trade (delivered on 291009 in Bangkok, at the Thai Ports...
Paper on Inter-Asian Trade (delivered on 291009 in Bangkok, at the Thai Ports...Paper on Inter-Asian Trade (delivered on 291009 in Bangkok, at the Thai Ports...
Paper on Inter-Asian Trade (delivered on 291009 in Bangkok, at the Thai Ports...China Intelligence Online
 
The Estonian Economy, No 7, November 28, 2011
The Estonian Economy, No 7, November 28, 2011The Estonian Economy, No 7, November 28, 2011
The Estonian Economy, No 7, November 28, 2011Swedbank
 
Mercer Capital's Value Focus: Real Estate Industry | Q1 2016 | Segment Focus:...
Mercer Capital's Value Focus: Real Estate Industry | Q1 2016 | Segment Focus:...Mercer Capital's Value Focus: Real Estate Industry | Q1 2016 | Segment Focus:...
Mercer Capital's Value Focus: Real Estate Industry | Q1 2016 | Segment Focus:...Mercer Capital
 
Ukrainian Pharmaceutical Market Monthly - Upharmacia - Feb 2018
Ukrainian Pharmaceutical Market Monthly - Upharmacia - Feb 2018Ukrainian Pharmaceutical Market Monthly - Upharmacia - Feb 2018
Ukrainian Pharmaceutical Market Monthly - Upharmacia - Feb 2018Eirhub
 
Market Outlook- 2019
Market Outlook- 2019Market Outlook- 2019
Market Outlook- 2019Shreya Gulati
 
Metal Price Outlook 2013-14, presented by Patricia Mohr at 2013 CMIC Signatur...
Metal Price Outlook 2013-14, presented by Patricia Mohr at 2013 CMIC Signatur...Metal Price Outlook 2013-14, presented by Patricia Mohr at 2013 CMIC Signatur...
Metal Price Outlook 2013-14, presented by Patricia Mohr at 2013 CMIC Signatur...Canada Mining Innovation Council
 
2002 jetro white paper on international trade and foreign direct investment b...
2002 jetro white paper on international trade and foreign direct investment b...2002 jetro white paper on international trade and foreign direct investment b...
2002 jetro white paper on international trade and foreign direct investment b...Pim Piepers
 
China and pakistan. abuzar
China and pakistan. abuzarChina and pakistan. abuzar
China and pakistan. abuzarAhmad Salman
 
FED: THIS IS WHAT IT SOUNDS LIKE WHEN DOVES CRY
FED: THIS IS WHAT IT SOUNDS LIKE WHEN DOVES CRYFED: THIS IS WHAT IT SOUNDS LIKE WHEN DOVES CRY
FED: THIS IS WHAT IT SOUNDS LIKE WHEN DOVES CRYOlivier Desbarres
 
Imports Exports (2)
Imports  Exports (2)Imports  Exports (2)
Imports Exports (2)mkalina
 
Tamohara investment newsletter August
Tamohara investment newsletter AugustTamohara investment newsletter August
Tamohara investment newsletter Augusttamohara
 
Weekly media update 29 06_2020
Weekly media update 29 06_2020Weekly media update 29 06_2020
Weekly media update 29 06_2020BalmerLawrie
 
Perspectives Global and Spanish Economy G4 2019
Perspectives Global and Spanish Economy G4 2019Perspectives Global and Spanish Economy G4 2019
Perspectives Global and Spanish Economy G4 2019Círculo de Empresarios
 
Impact of covid 19 on global economy
Impact of covid 19 on global economyImpact of covid 19 on global economy
Impact of covid 19 on global economyM S Siddiqui
 

What's hot (19)

Quarterly Report Perspectives Spanish and Global Economy Q3-2020
Quarterly Report Perspectives Spanish and Global Economy Q3-2020Quarterly Report Perspectives Spanish and Global Economy Q3-2020
Quarterly Report Perspectives Spanish and Global Economy Q3-2020
 
Patterns of Economic Growth of the Brazilian Economy 1970-2007: Demand led gr...
Patterns of Economic Growth of the Brazilian Economy 1970-2007: Demand led gr...Patterns of Economic Growth of the Brazilian Economy 1970-2007: Demand led gr...
Patterns of Economic Growth of the Brazilian Economy 1970-2007: Demand led gr...
 
Paper on Inter-Asian Trade (delivered on 291009 in Bangkok, at the Thai Ports...
Paper on Inter-Asian Trade (delivered on 291009 in Bangkok, at the Thai Ports...Paper on Inter-Asian Trade (delivered on 291009 in Bangkok, at the Thai Ports...
Paper on Inter-Asian Trade (delivered on 291009 in Bangkok, at the Thai Ports...
 
The Estonian Economy, No 7, November 28, 2011
The Estonian Economy, No 7, November 28, 2011The Estonian Economy, No 7, November 28, 2011
The Estonian Economy, No 7, November 28, 2011
 
120305 wma
120305 wma120305 wma
120305 wma
 
Mercer Capital's Value Focus: Real Estate Industry | Q1 2016 | Segment Focus:...
Mercer Capital's Value Focus: Real Estate Industry | Q1 2016 | Segment Focus:...Mercer Capital's Value Focus: Real Estate Industry | Q1 2016 | Segment Focus:...
Mercer Capital's Value Focus: Real Estate Industry | Q1 2016 | Segment Focus:...
 
Ukrainian Pharmaceutical Market Monthly - Upharmacia - Feb 2018
Ukrainian Pharmaceutical Market Monthly - Upharmacia - Feb 2018Ukrainian Pharmaceutical Market Monthly - Upharmacia - Feb 2018
Ukrainian Pharmaceutical Market Monthly - Upharmacia - Feb 2018
 
Inflation
InflationInflation
Inflation
 
Market Outlook- 2019
Market Outlook- 2019Market Outlook- 2019
Market Outlook- 2019
 
Metal Price Outlook 2013-14, presented by Patricia Mohr at 2013 CMIC Signatur...
Metal Price Outlook 2013-14, presented by Patricia Mohr at 2013 CMIC Signatur...Metal Price Outlook 2013-14, presented by Patricia Mohr at 2013 CMIC Signatur...
Metal Price Outlook 2013-14, presented by Patricia Mohr at 2013 CMIC Signatur...
 
2002 jetro white paper on international trade and foreign direct investment b...
2002 jetro white paper on international trade and foreign direct investment b...2002 jetro white paper on international trade and foreign direct investment b...
2002 jetro white paper on international trade and foreign direct investment b...
 
China and pakistan. abuzar
China and pakistan. abuzarChina and pakistan. abuzar
China and pakistan. abuzar
 
Cheap Oil and Gas, Employment and OFWs
Cheap Oil and Gas, Employment and OFWsCheap Oil and Gas, Employment and OFWs
Cheap Oil and Gas, Employment and OFWs
 
FED: THIS IS WHAT IT SOUNDS LIKE WHEN DOVES CRY
FED: THIS IS WHAT IT SOUNDS LIKE WHEN DOVES CRYFED: THIS IS WHAT IT SOUNDS LIKE WHEN DOVES CRY
FED: THIS IS WHAT IT SOUNDS LIKE WHEN DOVES CRY
 
Imports Exports (2)
Imports  Exports (2)Imports  Exports (2)
Imports Exports (2)
 
Tamohara investment newsletter August
Tamohara investment newsletter AugustTamohara investment newsletter August
Tamohara investment newsletter August
 
Weekly media update 29 06_2020
Weekly media update 29 06_2020Weekly media update 29 06_2020
Weekly media update 29 06_2020
 
Perspectives Global and Spanish Economy G4 2019
Perspectives Global and Spanish Economy G4 2019Perspectives Global and Spanish Economy G4 2019
Perspectives Global and Spanish Economy G4 2019
 
Impact of covid 19 on global economy
Impact of covid 19 on global economyImpact of covid 19 on global economy
Impact of covid 19 on global economy
 

Viewers also liked

SWOT For Business Growth Network Of Roseville
SWOT For Business Growth Network Of RosevilleSWOT For Business Growth Network Of Roseville
SWOT For Business Growth Network Of RosevilleMark Germanos
 
Coffee marketer Organo Gold brews up controversy
Coffee marketer Organo Gold brews up controversyCoffee marketer Organo Gold brews up controversy
Coffee marketer Organo Gold brews up controversymarkedqueue6348
 
John Harris for EANGUS President 2014
John Harris for EANGUS President 2014John Harris for EANGUS President 2014
John Harris for EANGUS President 2014Kenneth Hardy, CMIIB
 
Get the Facts on Why We Need Youth Sports Character Programs
Get the Facts on Why We Need Youth Sports Character ProgramsGet the Facts on Why We Need Youth Sports Character Programs
Get the Facts on Why We Need Youth Sports Character ProgramsIntello
 
Sponsor change request form
Sponsor change request formSponsor change request form
Sponsor change request formChance Freeman
 
Oakland Strategic Plan Progress Report (1996-1998)
Oakland Strategic Plan Progress Report (1996-1998)Oakland Strategic Plan Progress Report (1996-1998)
Oakland Strategic Plan Progress Report (1996-1998)OakMayor2014
 
Wine In No Time
Wine In No TimeWine In No Time
Wine In No TimeDeanna Kim
 

Viewers also liked (19)

Germanos
GermanosGermanos
Germanos
 
SWOT For Business Growth Network Of Roseville
SWOT For Business Growth Network Of RosevilleSWOT For Business Growth Network Of Roseville
SWOT For Business Growth Network Of Roseville
 
Partisan use of State TV signal (Venezuela Alert #22)
Partisan use of State TV signal (Venezuela Alert #22)Partisan use of State TV signal (Venezuela Alert #22)
Partisan use of State TV signal (Venezuela Alert #22)
 
Brazil in Numbers
Brazil in NumbersBrazil in Numbers
Brazil in Numbers
 
Excellent Data About Brazil
Excellent Data About BrazilExcellent Data About Brazil
Excellent Data About Brazil
 
Coffee marketer Organo Gold brews up controversy
Coffee marketer Organo Gold brews up controversyCoffee marketer Organo Gold brews up controversy
Coffee marketer Organo Gold brews up controversy
 
Brazil/Displays
Brazil/Displays Brazil/Displays
Brazil/Displays
 
Javita fa qs
Javita fa qsJavita fa qs
Javita fa qs
 
Policies & procedures
Policies & proceduresPolicies & procedures
Policies & procedures
 
G20 yea 2014 communique¦β and all final reports
G20 yea 2014 communique¦β and all final reportsG20 yea 2014 communique¦β and all final reports
G20 yea 2014 communique¦β and all final reports
 
John Harris for EANGUS President 2014
John Harris for EANGUS President 2014John Harris for EANGUS President 2014
John Harris for EANGUS President 2014
 
Fedecámaras Producción Nacional (versión 2014)
Fedecámaras Producción Nacional (versión 2014)Fedecámaras Producción Nacional (versión 2014)
Fedecámaras Producción Nacional (versión 2014)
 
9 11
9 119 11
9 11
 
Get the Facts on Why We Need Youth Sports Character Programs
Get the Facts on Why We Need Youth Sports Character ProgramsGet the Facts on Why We Need Youth Sports Character Programs
Get the Facts on Why We Need Youth Sports Character Programs
 
Professional Resume
Professional ResumeProfessional Resume
Professional Resume
 
Chronicle 48 web
Chronicle 48 webChronicle 48 web
Chronicle 48 web
 
Sponsor change request form
Sponsor change request formSponsor change request form
Sponsor change request form
 
Oakland Strategic Plan Progress Report (1996-1998)
Oakland Strategic Plan Progress Report (1996-1998)Oakland Strategic Plan Progress Report (1996-1998)
Oakland Strategic Plan Progress Report (1996-1998)
 
Wine In No Time
Wine In No TimeWine In No Time
Wine In No Time
 

Similar to Trade Bulletin Highlights State Export Trends

2003 jetro white paper on international trade and foreign direct investment b...
2003 jetro white paper on international trade and foreign direct investment b...2003 jetro white paper on international trade and foreign direct investment b...
2003 jetro white paper on international trade and foreign direct investment b...Pim Piepers
 
2004 jetro white paper on international trade and foreign direct investment b...
2004 jetro white paper on international trade and foreign direct investment b...2004 jetro white paper on international trade and foreign direct investment b...
2004 jetro white paper on international trade and foreign direct investment b...Pim Piepers
 
Assessing the evolution of the international trading system and enhancing its...
Assessing the evolution of the international trading system and enhancing its...Assessing the evolution of the international trading system and enhancing its...
Assessing the evolution of the international trading system and enhancing its...Ira Tobing
 
GDP & Comms (Mar Qtr 2016) - June 2016
GDP & Comms (Mar Qtr 2016) - June 2016GDP & Comms (Mar Qtr 2016) - June 2016
GDP & Comms (Mar Qtr 2016) - June 2016Mark Kooymans (M.Econ)
 
The effects of China-US trade war on GVCs and how Covid-19 is shifting the GVCs
The effects of China-US trade war on GVCs and how Covid-19 is shifting the GVCsThe effects of China-US trade war on GVCs and how Covid-19 is shifting the GVCs
The effects of China-US trade war on GVCs and how Covid-19 is shifting the GVCsJoselyn Escobal
 
World Bank Quarterly December 2008
World Bank Quarterly December 2008World Bank Quarterly December 2008
World Bank Quarterly December 2008Glenn Klith Andersen
 
World Economic Outlook
World Economic Outlook World Economic Outlook
World Economic Outlook SABC News
 
Quarterly Update - June 2009
Quarterly Update - June 2009Quarterly Update - June 2009
Quarterly Update - June 2009Peter Ho
 
Ouribpresentationtommorowfinalppt
OuribpresentationtommorowfinalpptOuribpresentationtommorowfinalppt
OuribpresentationtommorowfinalpptJitendra Kumar
 
Slowdown is structural or cyclical
Slowdown is structural or  cyclicalSlowdown is structural or  cyclical
Slowdown is structural or cyclicalNishant Kumar
 
K bank capital market perspectives aug 25 trade data
K bank capital market perspectives aug 25   trade dataK bank capital market perspectives aug 25   trade data
K bank capital market perspectives aug 25 trade dataKBank Fx Dealing Room
 
Flash comment: Latvia - September 8, 2012
Flash comment: Latvia  - September 8, 2012Flash comment: Latvia  - September 8, 2012
Flash comment: Latvia - September 8, 2012Swedbank
 
National Market Report
National Market ReportNational Market Report
National Market Reportjonathanrutman
 
A4120109.pdf
A4120109.pdfA4120109.pdf
A4120109.pdfaijbm
 
Así está the economy... September 2016 Círculo de Empresarios
Así está the economy... September 2016 Círculo de EmpresariosAsí está the economy... September 2016 Círculo de Empresarios
Así está the economy... September 2016 Círculo de EmpresariosCírculo de Empresarios
 
Global Trade Flow Index Q2 2010
Global Trade Flow Index Q2 2010Global Trade Flow Index Q2 2010
Global Trade Flow Index Q2 2010Capgemini
 
1999 jetro white paper on international trade and foreign direct investment b...
1999 jetro white paper on international trade and foreign direct investment b...1999 jetro white paper on international trade and foreign direct investment b...
1999 jetro white paper on international trade and foreign direct investment b...Pim Piepers
 
Country Report > Aumento de la insolvencia en la zona NAFTA
Country Report > Aumento de la insolvencia en la zona NAFTACountry Report > Aumento de la insolvencia en la zona NAFTA
Country Report > Aumento de la insolvencia en la zona NAFTAIgnacio Jimenez
 

Similar to Trade Bulletin Highlights State Export Trends (20)

2003 jetro white paper on international trade and foreign direct investment b...
2003 jetro white paper on international trade and foreign direct investment b...2003 jetro white paper on international trade and foreign direct investment b...
2003 jetro white paper on international trade and foreign direct investment b...
 
2004 jetro white paper on international trade and foreign direct investment b...
2004 jetro white paper on international trade and foreign direct investment b...2004 jetro white paper on international trade and foreign direct investment b...
2004 jetro white paper on international trade and foreign direct investment b...
 
Assessing the evolution of the international trading system and enhancing its...
Assessing the evolution of the international trading system and enhancing its...Assessing the evolution of the international trading system and enhancing its...
Assessing the evolution of the international trading system and enhancing its...
 
Report march 2020
Report march 2020Report march 2020
Report march 2020
 
GDP & Comms (Mar Qtr 2016) - June 2016
GDP & Comms (Mar Qtr 2016) - June 2016GDP & Comms (Mar Qtr 2016) - June 2016
GDP & Comms (Mar Qtr 2016) - June 2016
 
The effects of China-US trade war on GVCs and how Covid-19 is shifting the GVCs
The effects of China-US trade war on GVCs and how Covid-19 is shifting the GVCsThe effects of China-US trade war on GVCs and how Covid-19 is shifting the GVCs
The effects of China-US trade war on GVCs and how Covid-19 is shifting the GVCs
 
World Bank Quarterly December 2008
World Bank Quarterly December 2008World Bank Quarterly December 2008
World Bank Quarterly December 2008
 
World Economic Outlook
World Economic Outlook World Economic Outlook
World Economic Outlook
 
Quarterly Update - June 2009
Quarterly Update - June 2009Quarterly Update - June 2009
Quarterly Update - June 2009
 
Ouribpresentationtommorowfinalppt
OuribpresentationtommorowfinalpptOuribpresentationtommorowfinalppt
Ouribpresentationtommorowfinalppt
 
The Covid.docx
The Covid.docxThe Covid.docx
The Covid.docx
 
Slowdown is structural or cyclical
Slowdown is structural or  cyclicalSlowdown is structural or  cyclical
Slowdown is structural or cyclical
 
K bank capital market perspectives aug 25 trade data
K bank capital market perspectives aug 25   trade dataK bank capital market perspectives aug 25   trade data
K bank capital market perspectives aug 25 trade data
 
Flash comment: Latvia - September 8, 2012
Flash comment: Latvia  - September 8, 2012Flash comment: Latvia  - September 8, 2012
Flash comment: Latvia - September 8, 2012
 
National Market Report
National Market ReportNational Market Report
National Market Report
 
A4120109.pdf
A4120109.pdfA4120109.pdf
A4120109.pdf
 
Así está the economy... September 2016 Círculo de Empresarios
Así está the economy... September 2016 Círculo de EmpresariosAsí está the economy... September 2016 Círculo de Empresarios
Así está the economy... September 2016 Círculo de Empresarios
 
Global Trade Flow Index Q2 2010
Global Trade Flow Index Q2 2010Global Trade Flow Index Q2 2010
Global Trade Flow Index Q2 2010
 
1999 jetro white paper on international trade and foreign direct investment b...
1999 jetro white paper on international trade and foreign direct investment b...1999 jetro white paper on international trade and foreign direct investment b...
1999 jetro white paper on international trade and foreign direct investment b...
 
Country Report > Aumento de la insolvencia en la zona NAFTA
Country Report > Aumento de la insolvencia en la zona NAFTACountry Report > Aumento de la insolvencia en la zona NAFTA
Country Report > Aumento de la insolvencia en la zona NAFTA
 

More from The Information Company

Sales Force & Merchandiser Enablement Through Mobility
Sales Force & Merchandiser Enablement Through MobilitySales Force & Merchandiser Enablement Through Mobility
Sales Force & Merchandiser Enablement Through MobilityThe Information Company
 
Sales Force & Merchandiser Enablement Through Mobility
Sales Force & Merchandiser Enablement Through MobilitySales Force & Merchandiser Enablement Through Mobility
Sales Force & Merchandiser Enablement Through MobilityThe Information Company
 
Pepsi sales force enablement & merchandising through mobility
Pepsi  sales force enablement & merchandising through mobilityPepsi  sales force enablement & merchandising through mobility
Pepsi sales force enablement & merchandising through mobilityThe Information Company
 
Us sw solution architecture consultant jd
Us sw solution architecture consultant jdUs sw solution architecture consultant jd
Us sw solution architecture consultant jdThe Information Company
 
Job: Us sw solution architecture consultant jd
Job: Us sw solution architecture consultant jdJob: Us sw solution architecture consultant jd
Job: Us sw solution architecture consultant jdThe Information Company
 
Us sw solution architecture consultant jd
Us sw solution architecture consultant jdUs sw solution architecture consultant jd
Us sw solution architecture consultant jdThe Information Company
 
How to understand_legal_aspects_on_doing_infrastructure_business_in_brazil
How to understand_legal_aspects_on_doing_infrastructure_business_in_brazilHow to understand_legal_aspects_on_doing_infrastructure_business_in_brazil
How to understand_legal_aspects_on_doing_infrastructure_business_in_brazilThe Information Company
 

More from The Information Company (13)

Agribusiness Brasileiro em Números
Agribusiness Brasileiro em NúmerosAgribusiness Brasileiro em Números
Agribusiness Brasileiro em Números
 
Sales Force & Merchandiser Enablement Through Mobility
Sales Force & Merchandiser Enablement Through MobilitySales Force & Merchandiser Enablement Through Mobility
Sales Force & Merchandiser Enablement Through Mobility
 
Sales Force & Merchandiser Enablement Through Mobility
Sales Force & Merchandiser Enablement Through MobilitySales Force & Merchandiser Enablement Through Mobility
Sales Force & Merchandiser Enablement Through Mobility
 
Pepsi sales force enablement & merchandising through mobility
Pepsi  sales force enablement & merchandising through mobilityPepsi  sales force enablement & merchandising through mobility
Pepsi sales force enablement & merchandising through mobility
 
Us sw solution architecture consultant jd
Us sw solution architecture consultant jdUs sw solution architecture consultant jd
Us sw solution architecture consultant jd
 
Job: Us sw solution architecture consultant jd
Job: Us sw solution architecture consultant jdJob: Us sw solution architecture consultant jd
Job: Us sw solution architecture consultant jd
 
Us sw solution architecture consultant jd
Us sw solution architecture consultant jdUs sw solution architecture consultant jd
Us sw solution architecture consultant jd
 
In bev case study_spring wireless
In bev case study_spring wirelessIn bev case study_spring wireless
In bev case study_spring wireless
 
How to understand_legal_aspects_on_doing_infrastructure_business_in_brazil
How to understand_legal_aspects_on_doing_infrastructure_business_in_brazilHow to understand_legal_aspects_on_doing_infrastructure_business_in_brazil
How to understand_legal_aspects_on_doing_infrastructure_business_in_brazil
 
Apex/Brazil
Apex/BrazilApex/Brazil
Apex/Brazil
 
BNDES/Brazilian Development Agency
BNDES/Brazilian Development AgencyBNDES/Brazilian Development Agency
BNDES/Brazilian Development Agency
 
Brazil/Displays
Brazil/DisplaysBrazil/Displays
Brazil/Displays
 
Investing in Brazil, by Pedro Alem
Investing in Brazil, by Pedro AlemInvesting in Brazil, by Pedro Alem
Investing in Brazil, by Pedro Alem
 

Trade Bulletin Highlights State Export Trends

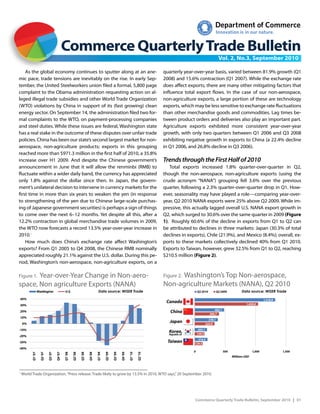
  • 1. Commerce Quarterly Trade Bulletin Vol. 2, No.3, September 2010 As the global economy continues to sputter along at an ane- quarterly year-over-year basis, varied between 81.9% growth (Q1 mic pace, trade tensions are inevitably on the rise. In early Sep- 2008) and 15.6% contraction (Q1 2007). While the exchange rate tember, the United Steelworkers union filed a formal, 5,800 page does affect exports, there are many other mitigating factors that complaint to the Obama administration requesting action on al- influence total export flows. In the case of our non-aerospace, leged illegal trade subsidies and other World Trade Organization non-agriculture exports, a large portion of these are technology (WTO) violations by China in support of its (fast growing) clean exports, which may be less sensitive to exchange rate fluctuations energy sector. On September 14, the administration filed two for- than other merchandise goods and commodities. Lag times be- mal complaints to the WTO, on payment-processing companies tween product orders and deliveries also play an important part. and steel duties. While these issues are federal, Washington state Agriculture exports exhibited more consistent year-over-year has a real stake in the outcome of these disputes over unfair trade growth, with only two quarters between Q1 2006 and Q3 2008 policies. China has been our state’s second largest market for non- exhibiting negative growth in exports to China (a 22.4% decline aerospace, non-agriculture products; exports in this grouping in Q1 2006, and 26.8% decline in Q3 2006). reached more than $971.3 million in the first half of 2010, a 35.8% increase over H1 2009. And despite the Chinese government’s Trends through the First Half of 2010 announcement in June that it will allow the renminbi (RMB) to Total exports increased 1.8% quarter-over-quarter in Q2, fluctuate within a wider daily band, the currency has appreciated though the non-aerospace, non-agriculture exports (using the only 1.8% against the dollar since then. In Japan, the govern- crude acronym “NANA”) grouping fell 3.6% over the previous ment’s unilateral decision to intervene in currency markets for the quarter, following a 2.3% quarter-over-quarter drop in Q1. How- first time in more than six years to weaken the yen (in response ever, seasonality may have played a role—comparing year-over- to strengthening of the yen due to Chinese large-scale purchas- year, Q2 2010 NANA exports were 25% above Q2 2009. While im- ing of Japanese government securities) is perhaps a sign of things pressive, this actually lagged overall U.S. NANA export growth in to come over the next 6–12 months. Yet despite all this, after a Q2, which surged to 30.6% over the same quarter in 2009 (Figure 12.2% contraction in global merchandise trade volumes in 2009, 1). Roughly 60.6% of the decline in exports from Q1 to Q2 can the WTO now forecasts a record 13.5% year-over-year increase in be attributed to declines in three markets: Japan (30.3% of total 2010.1 declines in exports), Chile (21.9%), and Mexico (8.4%); overall, ex- How much does China’s exchange rate affect Washington’s ports to these markets collectively declined 40% from Q1 2010. exports? From Q1 2005 to Q4 2008, the Chinese RMB nominally Exports to Taiwan, however, grew 32.5% from Q1 to Q2, reaching appreciated roughly 21.1% against the U.S. dollar. During this pe- $210.5 million (Figure 2). riod, Washington’s non-aerospace, non-agriculture exports, on a Year-over-Year Change in Non-aero- Figure 1. Washington’s Top Non-aerospace, Figure 2. Figure 1. Year-Over-Year Change in NANA Figure 2. Washington's Top Five Markets, Q2 2010 space, Non agriculture Exports (NANA) by Quarter 2007-2010 Non-agriculture Markets (NANA), Q2 2010 Non-Aerospace, Non-Agriculture Goods (NANA) Washington U.S. Data source: WISER Trade Q2 2010 Q2 2009 Data source: WISER Trade 40% 1,318.9 CanadaCanada 1,039.0 30% 482.1 20% China China 396.7 10% 378.1 0% Japan Japan 324.9 -10% 203.1 Korea, Korea, Republic Of 159.5 Republic of -20% 210.5 -30% TaiwanTaiwan 129.5 -40% 0 500 1,000 1,500 Q1 '07 Q2 '07 Q3 '07 Q4 '07 Q1 '08 Q2 '08 Q3 '08 Q4 '08 Q1 '09 Q2 '09 Q3 '09 Q4 '09 Q1 '10 Q2 '10 Millions USD 1 World Trade Organization, “Press release: Trade likely to grow by 13.5% in 2010, WTO says,” 20 September 2010. Commerce Quarterly Trade Bulletin, September 2010 | 01
  • 2. Among Washington’s top ten largest NANA exports in Q2 2010, in 2009. Between Q3 2006 and Q2 2010, China has ranked as Wash- the largest year-over-year increases were in iron and steel ($436.2 ington’s largest aerospace export market for nine quarters, includ- million, 70.6% increase over Q2 2009); wood and articles of wood ing the last three. More to the point, over this time span, aerospace ($586.6 million, 53.7%); industrial machinery, including computers exports to China constituted nearly 15% of all Washington’s aero- ($955.5 million, 38.5%); inorganic chemicals, precious & rare earth space exports. China has also purchased nearly $4 billion in aero- metals and radioactive compounds ($602.5 million, 31.4%); and space goods from Washington state over the past four quarters. vehicles and parts, excluding railway or tramways ($227.2 million, A more interesting breakdown disaggregates export flows by 23.1%). Aerospace exports grew 5.6% over the previous quarter, country and product. The single largest NANA export flow through but were 20.4% below exports sales for the same period in 2009. the first half of 2010, was for mineral fuels and oils to Canada Comparing the first half of 2010 with the same period in 2009, ($573.8 million). This was followed by exports, also to Canada, of Washington’s NANA exports grew 27.8%, and each of the top five industrial machinery ($258.2 million) and electrical machinery markets in H1 exhibited a minimum of 20.5% growth over H1 2009, and sound equipment ($222.0 million); and exports to Japan of led by Taiwan at nearly 107%. In terms of gross increases by prod- inorganic chemicals, precious & rare earth metals and radioactive uct category, aerospace was the largest single contributor (28.5%), compounds ($215.2 million), and wood and wood articles ($189.4 followed by wood and wood articles (7.8%), industrial machinery, million). including computers (5.7%), and wheat and meslin (4.4%). The larg- est drags on growth, measured by their quarter-over-quarter net loss as a share of gross loss, were mineral fuels and oils (a decline of $317.8 million, or 49.7% gross losses by product) and pharmaceuti- cals (decline of $172.0 million, 26.9% of gross losses). Figure 3. Major Technology Exports Tech exports, using the definition developed by TechAmerica Q2 2010 Q2 2009 Data source: WISER Trade (for a full description, see our December 2009 edition, footnotes 8 Ultrasonic scanningscanning Ultrasonic apparatus 114.6 and 9), increased 0.3% from Q1 to Q2, though they were 17.0% over apparatuses 102.5 the same period in 2009 (Figure 3). Ultrasonic scanning apparatus TV receivers, including 96.7 video monitors and TV receivers, including video monitors & projectors was the largest tech export in Q2 2010, reaching $114.7 million— projectors 93.6 Electronic integrated 75.8 though this was 7.6% below exports in Q1 2010, and the lowest circuits & microassembly Electronic integrated circuits & microassembly and parts and parts 59.1 quarterly amount since Q2 2009. Television receivers (including Automatic data processing 72.4 machines and magnetic Automatic data process machines and magnetic readers video monitors and receivers) grew 32.1% over Q1 reaching $96.7 readers 55.6 million, followed by electric integrated circuits and micro-assembly Oscilloscopes, spectrum Oscilloscopes, spectrum analyzers, andparts 53.6 analyzers, and parts 41.0 parts ($75.8 million, a 15.9% increase over Q1) and automatic data 0 40 80 120 processing machines and magnetic readers ($72.4 million; 18.0% Millions Millions USD decline over Q1, but a 30.2% year-over-year increase over Q2 2009). Aerospace exports grew 5.6% quarter-over-quarter in Q2, though this was 20.5% below export flows during the same period Market Focus: Brazil Often lost in the discussions over China and India is the emer- Economic Overview gence of Brazil as the “other” engine of global growth in the twenty- Brazil is the largest economy in South America and eighth larg- first century. More than the other “BRIC” countries (Brazil, Russia, In- est in the world as measured by gross domestic product (GDP). Af- dia, and China), Brazil is perhaps best positioned as a natural trade ter a difficult period of hyperinflation in the 1990s (2,477% in 1993), partner with the United States: a per capita GDP twice that of China, Brazil has made significant strides and has emerged as a major in- close proximity to the United States, and arguably the “freest” and ternational hub for clean energy, information and communication most market-oriented economy of the four. In this edition of the technologies (ICT), and biotechnology in recent years. In recent de- trade bulletin, we take a closer look at Brazil and opportunities for cades, aircraft manufacturer Embraer has grown into a world-rec- Washington exporters in the near and medium term. ognized original equipment manufacturer (OEM) of business and Commerce Quarterly Trade Bulletin, September 2010 | 02
  • 3. regional jets. Brazil is also home to forty-five of the top fifty largest ery, electrical and transport equipment, chemical products, oil, multinational companies in the world. The country is a leading ex- automotive parts, and electronics.6 In 2008, machinery and elec- porter of coffee, soy beans, beef, poultry, sugar, and orange juice. In trical equipment accounted for 26.49% of Brazil’s imports, oil and the clean energy space, roughly 75% of Brazil’s entire grid is pow- derivatives for 18.17%, chemical products for 14.25%, and transport ered by hydro, and 50% of all cars on the road use biofuels. In ad- equipment and parts for 12.6%.7 dition to Embraer, major Brazilian multinationals include Petrobras, Vale, CSN, Gerdau, Aracruz, Suzano, Sadia, Imbev, Itau/Unibanco, Information Technology and Bradesco. Per capita GDP adjusted for purchasing power par- Brazil’s IT sector is the eighth largest in the world and largest in ity was US $10,100 in 2009. With a cumulative stock of US $319.9 Latin America. Notable firms with operations in the United States billion in inbound foreign direct investment (FDI) as of the end of include BRQ, Ci&T, CPM Braxis, Politec, Stefanini, TOTVS, and Spring 2009, Brazil ranks thirteenth in the world for investment attraction.2 Wireless (with their U.S. headquarters in Seattle). There are more With a population of roughly 200 million, Brazil is the fifth most than 1.7 million IT professionals; each year another 100,000 new populous country in the world.3 About 10% of their total popula- professionals enroll in IT-related courses. Last year, the Brazilian IT tion in 2009 was over 60 years of age, with this forecasted to increase market was worth US $31.0 billion, constituting 3% of the coun- to 29% by 2050. The old age support ratio for 2009 showed ten try’s gross domestic product (GDP). Roughly 35% of the sector is working people (aged 15–64) for every retired person (aged 65+). in IT services, with the business process outsourcing (BPO) market However, the forecast for 2050 showed only three working people worth US $4.5 billion. For 2010, the IT market growth is forecasted for every retired person—a decline of more than half.4 The Econo- to expand 15%, with total IT exports expected to reach US $3.5 bil- mist Intelligence Unit’s 10 year forecast shows a general downward lion. And despite the recent slowdown in the Brazilian economy, trend in GDP growth; a predicted drop from 7.8% in 2010 to 4.5% the Brazilian IT industry thrived, growing by 7.8% (software, hard- in 2011, then a slight increase to 4.7% in 2013, followed by a steady ware, and services) in 2008.8 and gradual decline to 3.3% by 2020.5 The IMF’s estimates are similar, with GDP growing 7.1% in 2010 and 4.2% in 2011. Drivers Global Recession and Recovery of economic growth over the next 10 years include Brazil’s exports Brazil’s economy contracted by 0.2% in 2009. The World Bank es- of commodities to China, the country’s leading ethanol production timates Brazil’s current account deficit increased in 2009, though as industry, continuing growth in information technology, and the a percentage of GDP, it declined from 3.3% to 3.2%. Foreign direct presalt oil reserves off the coast of Brazil. In preparation for the 2014 investment dropped from US $42 billion in 2008 to US $25.9 billion World Cup and 2016 Summer Olympics, the Brazilian government in 2009. There was a significant reduction of investment during the will spend close to US $100 billion on infrastructure and other in- deepest throes of the recession, including a 30% reduction of in- vestments. vestment into Brazil’s mining sector. However, Brazil was in recovery Brazil’s biggest import partner is the United States, accounting position by the end of 2009—faster than most major economies.9 for 16.12% of all imports. China, at 12.61% of imports, Argentina, at 8.77%, Germany, at 7.65%, and Japan, at 4.3%, follow on the list of Brazil’s main import partners. Brazil’s main imports are machin- Washington Exports to Brazil In 2009, Washington’s exports to Brazil totaled $836.1 million. port markets, 2008 was a peak year for sales, followed by a contrac- This was more than 17% below 2008 export levels, but still the sec- tion in 2009 (Figure 4). Nonetheless, exports to Brazil have been ond highest annual total recorded between Washington and Bra- on the upswing for some time now, with a per annum growth rate zil. As seen with many markets, the largest single export good was of 4.3% seen from 2001 to 2009. If we stretch our period of interest aerospace products, totaling $659.2 million in 2009, and constitut- to 2000–2009, exports have grown on average more than 28.1% ing 78.1% of all exports to Brazil. This was down from $807.8 million per year, though much of this follows the volatile ups and downs of in 2008, an 18.4% decline. As with many of Washington’s major ex- aerospace exports. 2 Central Intelligence Agency, World Factbook. 3 Central Intelligence Agency, World Factbook, July 2010. 4 United Nations, Population Ageing and Development, 2009. 5 Economist Intelligence Unit, Country Data, August 2010. 6 Central Intelligence Agency, World Factbook, 2009. 7 Economist Intelligence Unit, Country Data, August 2010. 8 Brazilian Association of Information Technology and Communication Companies (Brasscom). 9 US Department of State and US & Foreign Commercial Service, “Doing Business in Brazil: 2010 Country Commercial Guide for US Companies,” 2010. Commerce Quarterly Trade Bulletin, September 2010 | 03
  • 4. As we often do in this bulletin, we prefer to look at the NANA million; 14.2% growth). export segment of Washington’s exports portfolio. Exports in this Brazil ranked as Washington’s second largest export market in grouping increased every year from 2005 to 2008. Even in 2009, to- South America in 2009, just slightly behind Chile; this was true for tal NANA goods exports were the second highest on record, reach- both total exports and after removing aerospace products. How- ing $162.3 million. ever, 2009 was the first year Brazil was not Washington’s top export The largest NANA exports by product type in 2009 were: (1) market in the region for non-aerospace goods, owing more to sig- petroleum coke ($64.5 million; 12.9% year-over-year increase); nificant growth in the Chilean market than to a decrease in exports (2) voice/data/imaging and data machines ($10.6 million; 143.4% to Brazil (though exports did decline from 2008, they were still well growth); (3) ultrasonic scanning apparatuses ($9.3 million; decline above previous years). Over the past ten years, Brazil and Chile have of 37.0%); (4) fork lifts and work trucks ($8.4 million; decline of frequently swapped positions as Washington’s top NANA export 75.2%); and (5) relays for voltage between 60 and 100 volts ($7.4 market in the region. Figure 4. Brazil: Brazil: Economic Growth and Washington Exports Economic Growth and Washington Exports Figure 4. Data source: WISER Trade and International Monetary Fund (IMF) Gross domestic product based on purchasing-power-parity (PPP) valuation of country GDP Washington exports to Brazil NANA exports 2500 1,200 1,000 Millions USD 2000 PPP GDP (US billions) 800 PPP GDP(Billions USD) 1500 Millions USD 600 1000 400 500 200 0 0 1996 1997 1998 1999 2000 2001 2002 2003 2004 2005 2006 2007 2008 2009 New Exporter Profile: Flux Drive In September, we spoke with Libby Dunkin, Vice President for Flux Drive Flexible Coupling line is designed for soft starting con- Operations at Sumner, WA-based Flux Drive. Flux Drive is a small stant speed applications. Both the ASD and Coupling product lines engineering design and new manufacturing firm specializing in can be installed in-line between the motor and load or can be belt magnetic couplings for industrial- and heavy-load motors used un- driven. Flux Drive’s orders are split roughly 50-50 between retrofits der harsh conditions. After several years of in-house testing and and new applications. design, Flux Drive began business operations in 2007, and currently Earlier this year, after placing a free company listing in a global employs eight full time equivalents (FTEs). Their main product is business supplier catalogue, Flux Drive was contacted by Vulcan In- the Adjustable Speed Drive (ASD), designed for soft-start and vari- dustries, a large Brazilian original equipment manufacturer (OEM) able speed mechanical applicants. Flux Drive has developed two specializing in the assembly and some component manufacture of product lines that offer industry the benefits associated with this motors used in mining and agriculture applications. Brazil’s agricul- power transmission technology. The Flux Drive Adjustable Speed ture and mining industries, while sizable, still use many antiquated Drive (ASD) is designed for variable speed applications while the technologies, including hydraulic couplings in heavy-load motors. Commerce Quarterly Trade Bulletin, September 2010 | 04
  • 5. Flux Drive’s magnetic couplings can be retrofitted onto older mo- new to the export of an actual product. As a small company with tors, are far more energy efficient, and significantly reduce mainte- little exporting experience, Flux Drive lacked the clout needed to nance costs and ecological and environmental damage compared navigate through Brazil’s labyrinthine system of import product with hydraulic couplings. Vulcan has since visited Washington codes and tariffs. To get around this, the company arranged for twice and has placed two initial orders for Flux Drive’s magnetic Vulcan to purchase the couplings in Washington and then assume couplings. the responsibility of importer, including the use of their own freight Flux Drive has done overseas services work in the past, but is forwarder. Trade Issues: Brazil Probably the biggest trade issue with Brazil involves the U.S. countries approved tariff increases for hundreds of products in the compliance with a WTO panel ruling against U.S. cotton subsidies. CET, including dairy, textiles, bags, backpacks, and suitcases. Bot- The question is whether the deal to postpone the imposition of tom line: There is quite a bid of uncertainty on tariffs. Brazil applies retaliatory duties on U.S. products will hold. Brazil and the United federal and state taxes and charges to imports that can effectively States reached a deal on June 17, 2010, under which Brazil agreed double the actual cost of importing products into Brazil. to refrain from imposing $830 million in annual sanction on U.S. im- ports as a result of the U.S. failure to comply with a WTO dispute Government procurement panel against U.S. subsidies for cotton growers. The sanctions will Brazil is not a signatory to the WTO Government Procurement remain suspended until 2012 when the United States will adopt a Agreement, which precludes discrimination against goods and new farm bill establishing agricultural spending for the next 5 years. services from other signatory countries. As a result, U.S. compa- In return, the United States agreed to continue financing a national nies have found it difficult to participate in Brazil’s public sector fund that will pay out $147 million annually in financial technical as- procurement unless they are associated with a local firm. Without sistance for Brazilian cotton farms. The United States also agreed to a substantial presence in Brazil, U.S. companies frequently face sig- add additional restrictions to the GSM-12 export credit guarantee nificant obstacles in winning government contracts. They are usu- program to minimize their subsidization impacts. ally more successful in subcontracting with larger Brazilian firms. Brazil has recently removed import duties on aircraft, flight Note that in July 2010, there was a Brazilian decree establishing a simulators, and all aeronautical equipment and spares. The govern- “Buy Brazil” policy for government purchases. The decree allows the ment also reduced the import duty from 14% to 2% on 410 capital government to favor domestic suppliers over foreign firms even if goods items, including IT and telecommunication products. This the Brazilian company prices are up to 25% higher. In addition, the reduction is due to expire on June 30, 2012.10 decree states that the government may designate goods and ser- vices in the areas of information technology and communications Tariffs as “strategic” and require that a supplier use technology developed In 2009, Brazilian tariffs ranged from 0% to 35%, with an average in Brazil. applied tariff rate of 11.5%. However, Brazil’s average bound tariff, i.e., the rate that generally cannot be exceeded under WTO rules, is Intellectual property rights (IPR) protection significantly higher at 31.4%. Given the large gap between bound IPR piracy continues to be major issue, although Brazil has made and applied duties, U.S. exporters face quite a bit of uncertainty in important progress in enhancing the effectiveness of intellectual terms of tariffs because Brazil is allowed to raise the applied rate property enforcement, particularly with respect to pirated audio- up to the bound level. Brazil has used this flexibility on many occa- visual goods. Among other things, the U.S. Trade Representative sions to increase tariffs. For example, in August and September of (USTR) has urged Brazil to increase raids and seizures of pirated and 2009, the country raised tariffs by as much as 14 percentage points counterfeit products, and increase actions against book and Inter- on several industrial products including industrial fatty alcohols, re- net piracy. The United States is also concerned with patent protec- fractory bricks, valves for oleohydraulic or pneumatic transmissions, tion for pharmaceuticals and medical devices, including with re- and parts of electric appliances. spect to the role of Brazil’s health authority (ANVISA) in the patent Brazil is a member of the MERCOSUR common market which application process; inadequate protection against unfair commer- includes Argentina, Paraguay, and Uruguay. MERCOSUR maintains cial use of undisclosed test and other data generated to obtain mar- a Common External Tariff (CET) which averages 11.5%, but ranges keting approval for human-use pharmaceutical products; and an from 0% to 35% ad valorem. MERCOSUR currently is allowed to inter-ministerial decision against granting patents for polymorphs maintain 93 exceptions to the CET. Brazil recently used these excep- and second-use inventions. tions on some steel products. In December 2009, all MERCOSUR 10 Mike Godfrey, “Brazil Cuts Import Tariffs,” Tax-news.com,10 August 2010. Commerce Quarterly Trade Bulletin, September 2010 | 05
  • 6. How Washington State Can Help You Export The Washington State Department of Commerce provides free export assistance for Washington state companies, including client searches, export leads, and consultation on a variety of export-related issues. For export-related inquiries, please contact Mark Calhoon, Managing Director for International Trade, mark.calhoon@commerce.wa.gov. Inquiries on trade data and activities can be sent to: Washington State Department of Commerce Attn Spencer Cohen Research Manager 2001 Sixth Avenue, Suite 2600 Seattle, WA 98121 spencer.cohen@commerce.wa.gov Phone: (206) 256-6100 Commerce Quarterly Trade Bulletin, September 2010 | 06